> For the complete documentation index, see [llms.txt](https://docs.bdb.ai/bdb-documentation/llms.txt). Markdown versions of documentation pages are available by appending `.md` to page URLs; this page is available as [Markdown](https://docs.bdb.ai/bdb-documentation/data-visualization/governed-dashboards/connecting-to-a-data-source/establishing-a-data-connection/data-science-service.md).
# Data Science Service
Steps to develop a data connection based on the Data Science Service.
{% hint style="info" %}
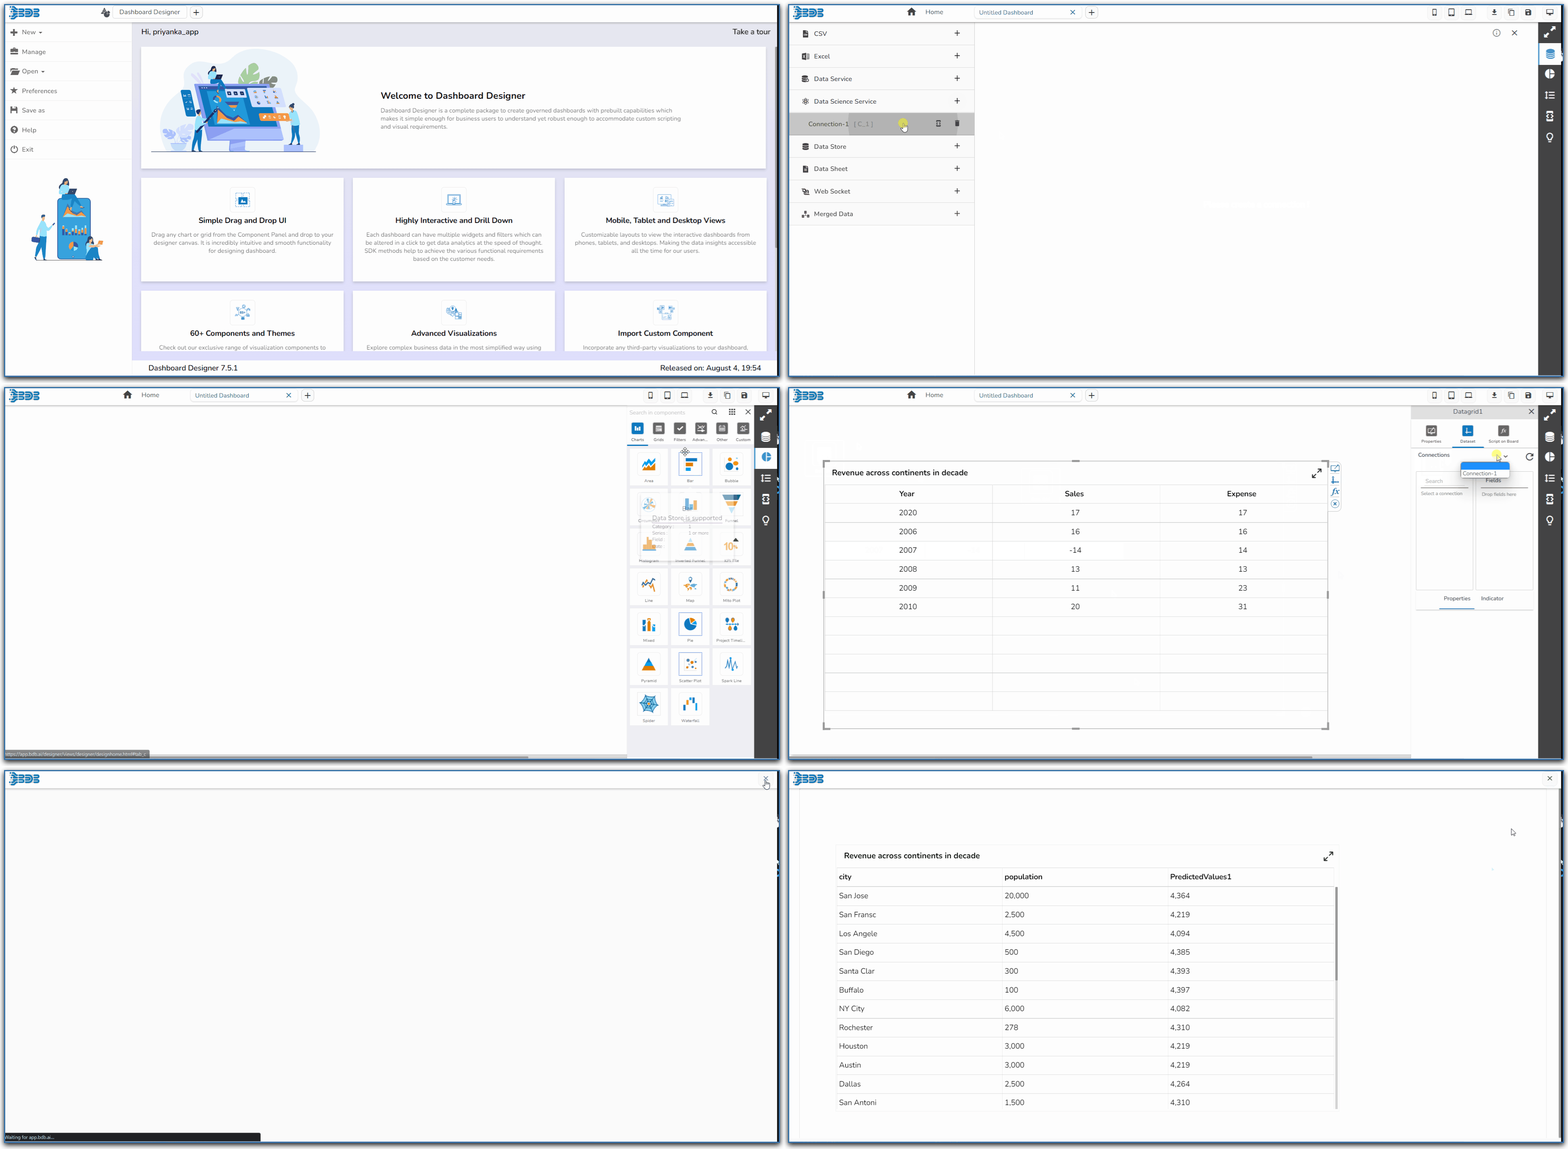
Check out the given illustration on how to create a Data Science Service connection and associate it to a charting component.
{% endhint %}
* Navigate to the Data Connector page by clicking the ***Data Connectors*** icon.
* Click the ***Create New Connection*** icon provided next to the ***Data Science Service*** connector.
* A new connection gets created under the Data Science Service connector type.

* The configurable connection-specific fields display on the right side of the page as explained below:
* **Name:** Name the connection.
* **Data Science Workflows:** Select a deployed Data Science Workflow from the drop-down menu.
* **Load at Start:** Enable this option to get up-to-date data / pull the updated data from the data source before loading it into charts.
* **Timely Refresh:** Enable this option to get the refreshed data.
* **Refresh Interval:** Set the time for refresh interval. (This field appears when the ***Timely Refreshe*****d** field has been enabled.)
* The ***Field Set*** tab displays all the fields after establishing the data connection.

{% hint style="info" %} Please Note:
* Click the ***Refresh Workflows*** icon to refresh the Data Science Workflows.
* The users can filter the targeted data set using the ***Condition*** option.
{% endhint %}