Canvas Properties
The Canvas Properties helps users to configure properties for the entire dashboard.
The Designer canvass is provided with specific properties.
Navigate to the Designer canvas.
Use the Right-click anywhere on the canvas to get the Dashboard properties.
Select the Properties option from the context menu.
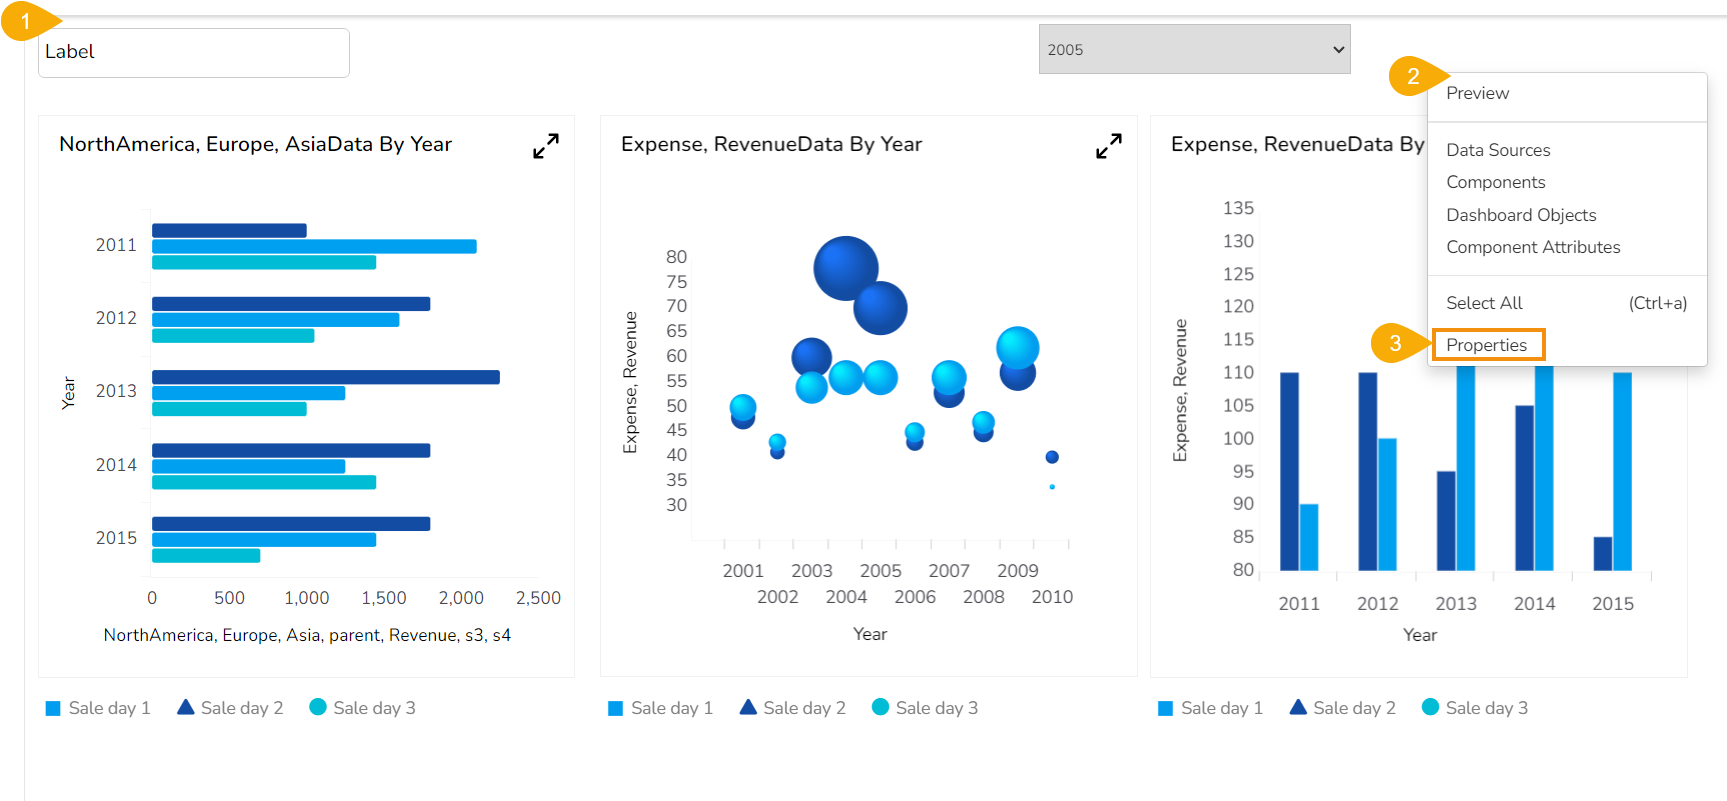
Various Dashboard level properties get listed in the displayed context menu as shown in the below-given image:
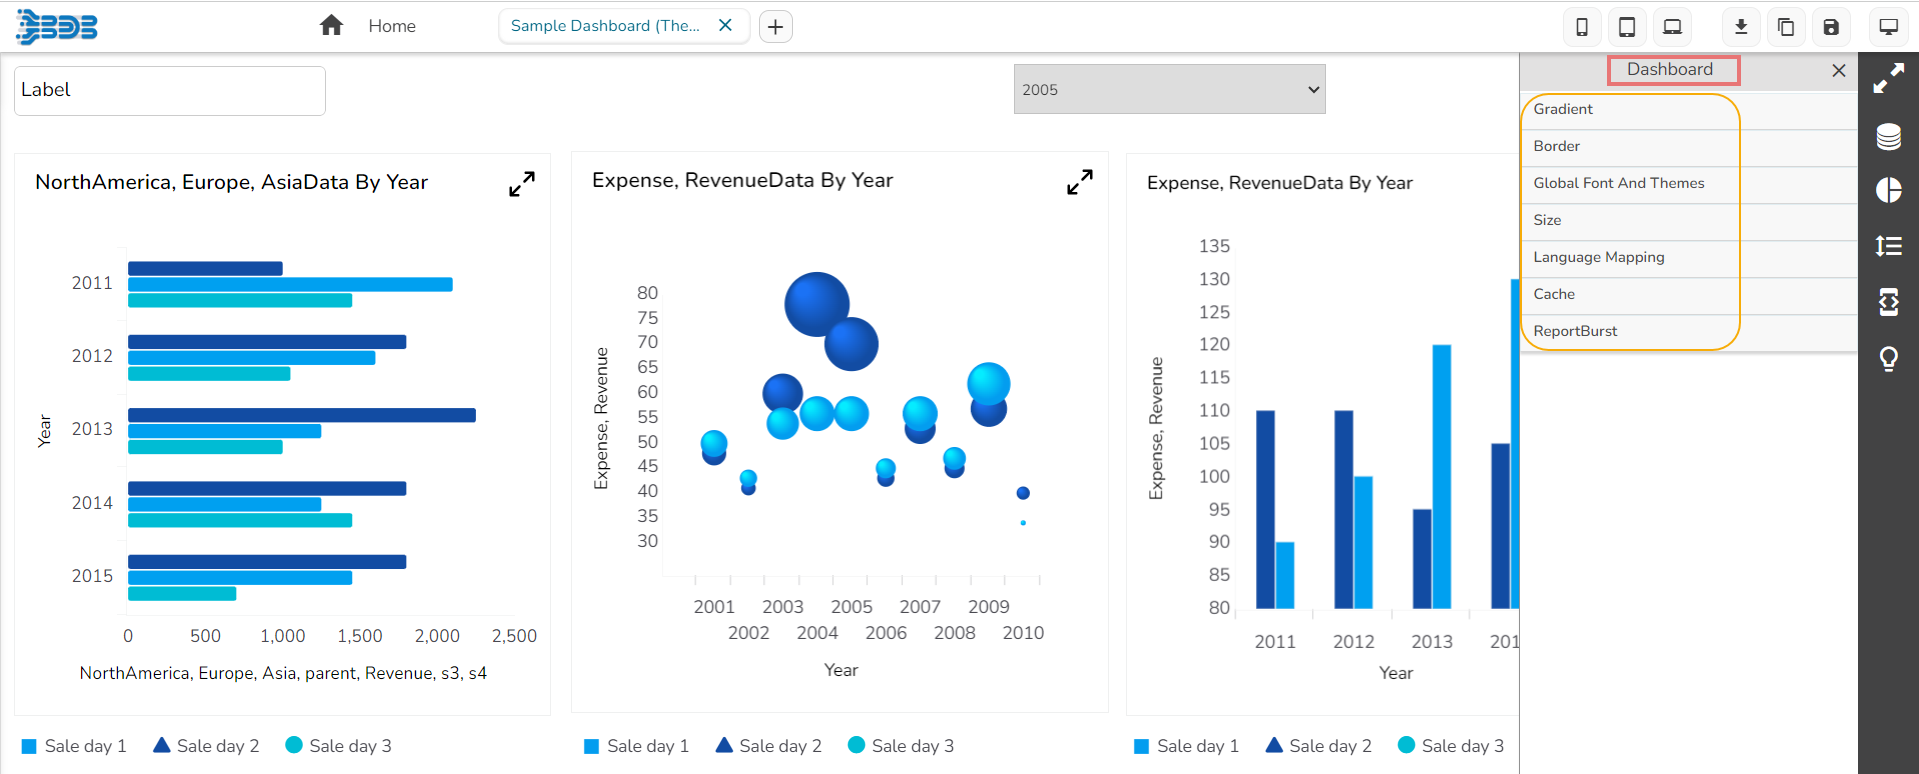
Gradient

Parameter Name
Description
Background Colors
Users will be directed to select a background color.
Opacity
Set background-color opacity.
Background Rotation
Set the value to rotate the background color accordingly
Please Note: By clicking the Background Colors icon, a new window opens with a menu to select a color for the Background (as displayed in the below-given image) gradient colors. The users can select a color using the menu and click the Save option to apply the selected background gradient color. The colors pallet to set background gradient color is given below:

Border

Parameter Name
Description
Thickness
Set border thickness.
Border Color
Select a border color from the menu.
Global Font And Themes
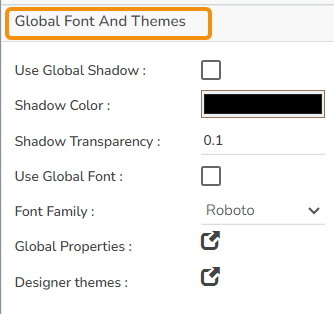
Parameter Name
Description
Use Global Shadow
Enable this option to display global shadow
Shadow Color
Select a color from using the menu
Shadow Transparency
Set the transparency for the shadow
Use Global Font
Enable this option to use the global font.
Font Family
Select a font type from the drop-down menu.
Designer Themes
Select a theme from the drop-down menu.
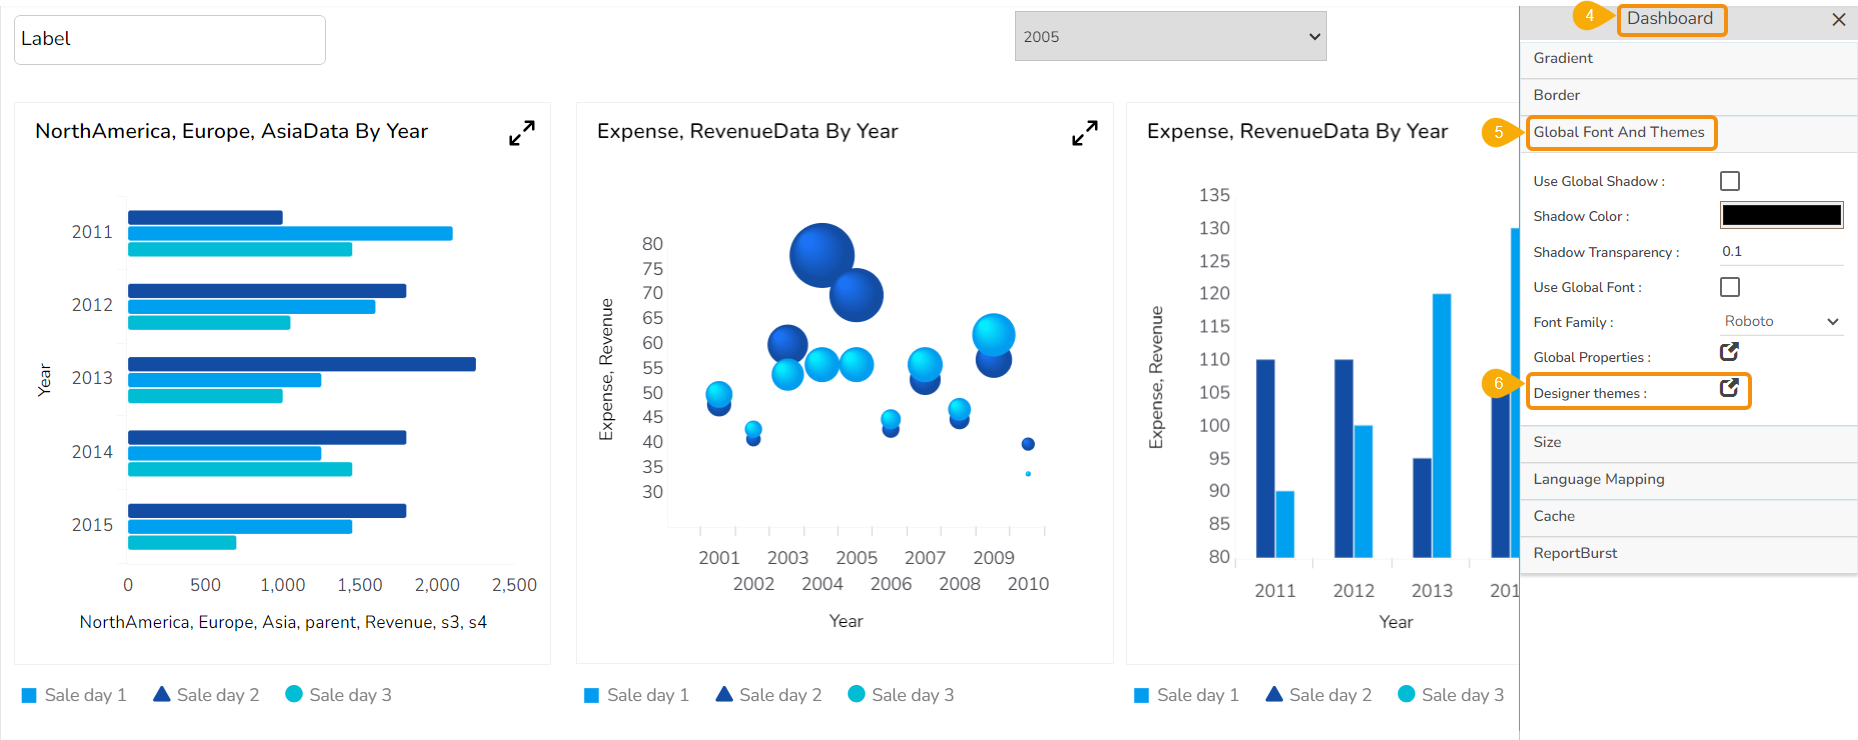
Select the Global Font And Themes option from the context menu.
Click on the Designer themes icon.
Screen Size
The Size Properties option helps to
Check out the given walk-through on how redraw on resize Property gets applied to the Dashboard.

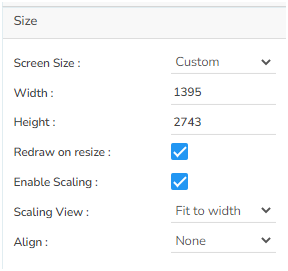
Parameter Name
Description
Screen Size
Select an option from the drop-down menu.
Width
Increase/decrease the width of the dashboard.
Height
Increase/decrease the height of the dashboard.
Redraw on resize
Redraws the dashboard while resizing it.
Enable Scaling
Enable this option to display scaling.
Scaling View
Select an option from the drop-down menu (Fit to page/Fit to width/Fit to height/Proportional).
Align
Gets aligns based on the selected Align option.
Please Note: The Dashboard screen size can be scaled based on display devices (E.g., Mobile, iPad, and PC).
Steps to set the Screen Size
Click the drop-down icon for the Screen Size field.
A context menu appears displaying various options to set the Screen Size.

Language Mapping

Parameter Name
Description
Enable
Enable this option to apply language mapping functionality.
Hide Curly Braces
Enable this option to hide the curly braces.
Select a Mapping
Select a language mapping using the drop-down menu.
Please Note: By clicking on the Select a Mapping icon, the Language Mapping Selection dialog box opens.
Steps to Map a Language
Navigate to the Language Mapping Selection dialog box.
Select a language mapping option using the Mapping List drop-down menu.
Click the Save option.

Cache

Use a checkmark in the given box to enable the Enable Cache option for the data service. If cache is enabled for a dashboard with a data service as a data source it will do the following tasks:
While loading the dashboard, for the first time data will hit from database.
The same dashboard while loading again it will load the data from the Cache.
Report Burst

Use a checkmark in the given box to Enable Report Burst. By enabling the Report Burst option from the Dashboard properties displays the Report Burst option for a published Dashboard. Refer the Report Burst section from the Options for a Published Dashboard section for more details.
Please Note: The Report Burst option comes pre-selected in all the new dashboards.