
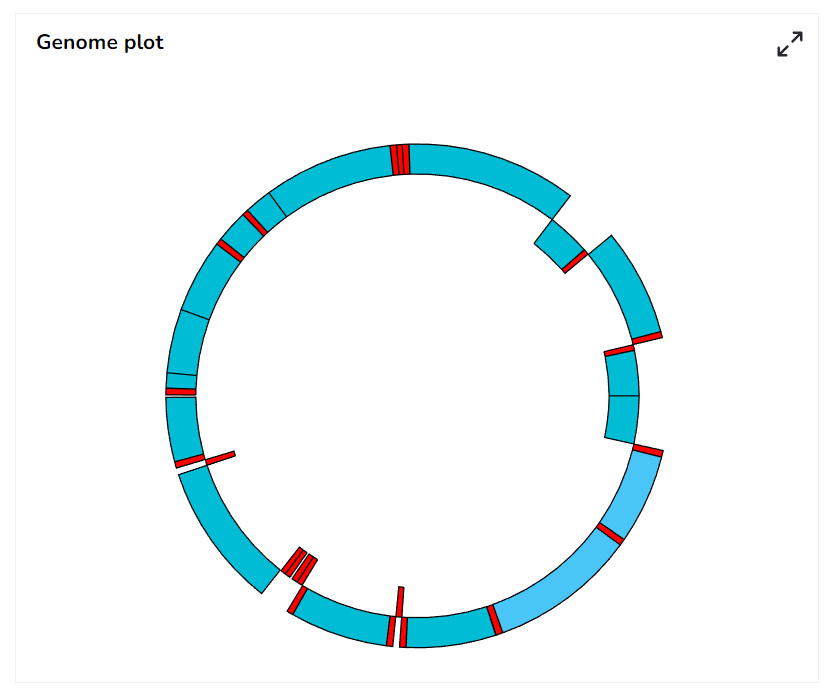
Mito Plot
Mito is a very advanced chart that is based on mitochondrial DNA study. The Mito-plot chart shows the basic structure of mitochondrial DNA, as shown in the figure. Mito-Plot chart divided into different segments each segment produces a protein (RNA type) these proteins is essential during the cellular respiration cycle. These segments have been defined through the category, and its color depends on the RNA type what it contains. Mitochondrial DNA has two strands, and that can be differentiated based on their nucleotide content, these two strands are a heavy strand or H-strand and a light strand or L-strand. H-strand is a genuine rich strand and represents through the segment which orientation towards outside. L-strand is a cytosine-rich strand that represents through the segment which orients towards inside.
Check out the below given walk-through on how to use the Mito Plot chart component in Designer module.

Best Situations to Use a Mito Plot chart
This chart can be used by the medical expert to provide data visualization of person-specific mitochondrial DNA damage.
Default Mito Plot Image

Properties of the Mito Plot
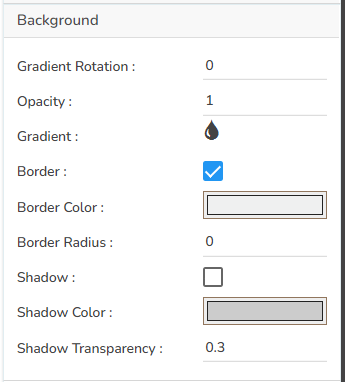
Background
The user can get the reflection of the chart by enabling the shadow option can also change the color and increase & decrease the transparency of the shadow. The user can also set the background color and adjust its transparency. Border can be enabled, and its radius can be adjusted.
Export Options
The user can enable the 'Enable Context Menu’ from the preview section to download the reports in different formats. The user can change the heading and subheading of the downloaded charts and the name of the downloaded files from the Export context menu.
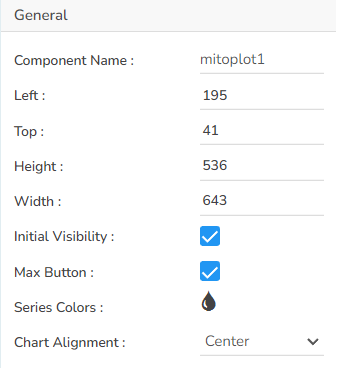
General
The user can change the height, width, top, left. If initial visibility is not enabled, then the chart won’t be available for the first preview. If the Max button is enabled, the user can maximize the chart. Under series color, we can adjust the pie colors. Chart alignment can be Center or Right or Left.
Subtitle
The user can enable the subtitle if we have any second title and also, we can change the Name, Font color, size, style, etc.
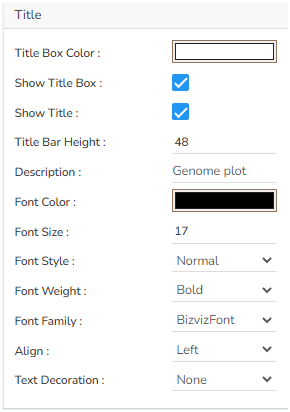
Title
The user can change Title Name, Font color, size, style, etc.
Tooltip
The user can show the description of the series can use the tooltip by enabling it.
Mito Plot after changing its Properties
Sample Data
Download the given sample data and map it as mentioned below to plot your Mito chart.
Use the Cat_Label column as Category field, Color_rnaType column as RNA Type, orientation column as Orientation field, start column as Start field, stop column as Stop field, and dataLabel_pos column as Marker field to plot data.