The Data Search can use this to search for particular data. The user can also search for Chart, Query & Data Store.
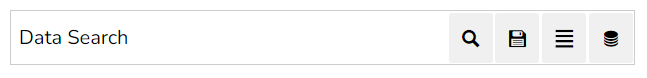
Default Component Image
Properties of the Data Search
Background
The user can get the reflection of the chart by enabling the shadow option can also change the color and increase & decrease the transparency of the shadow.
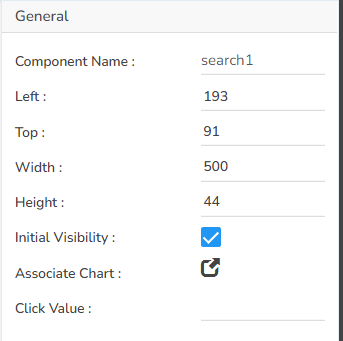
General
The user can change the height, width, top, left. If initial visibility is not enabled, then the chart won’t be available for the first preview. In Associate Chart section user can establish the connection between the data search and component. The value user type in the “Click Value” field is passed to the backend.
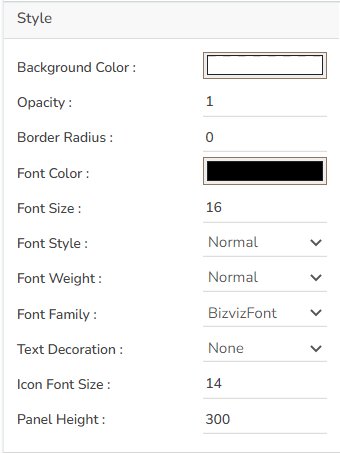
Style
The User can set the background color and font color as well as font style-weight-family etc. in this section.
Associating a Chart
It is possible to associate multiple charting components with the Data Search component. The user gets the Associate Chart option under the General properties.
Click the Associate Chart iconfrom the General Properties of the Search component.
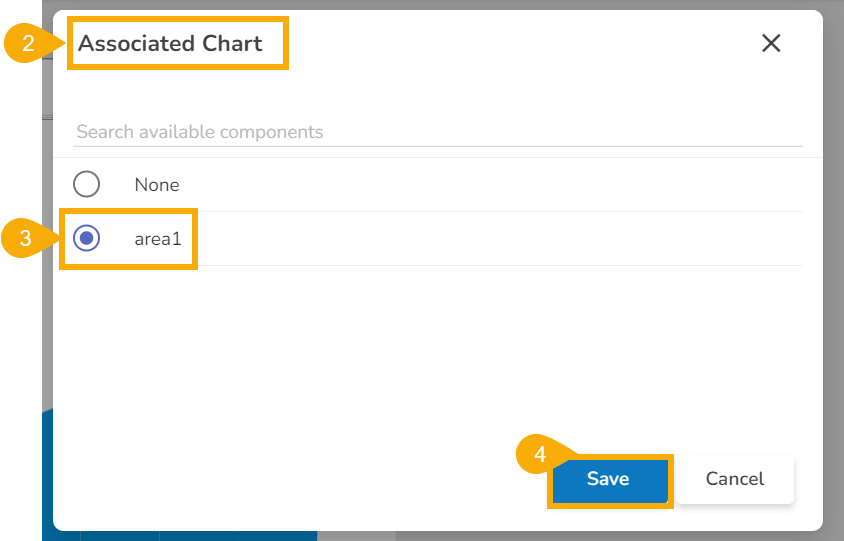
The Associated chart dialog box appears as displayed below:
The user can use the given check box to select the dragged chart component.
Click the Save to associate the selected charting component with the Data Search option.
Data search in preview mode
The following image displays the Data Search component in the preview mode:
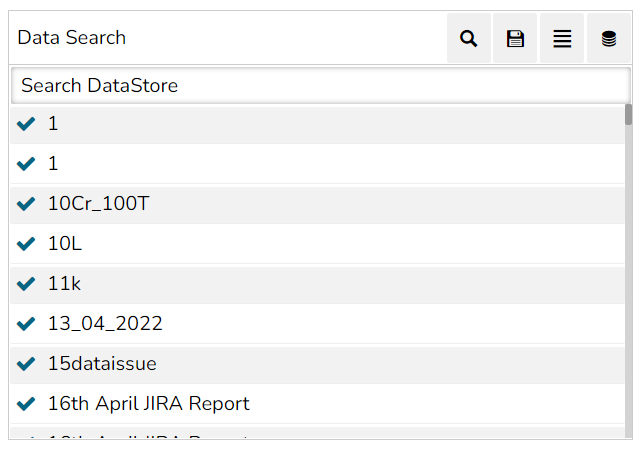
The below-given image displays the auto generated suggestions to provide a text query in the Data Search bar:


 from the General Properties of the Search component.