
Box Plot
Check out the below given walk-through on how to use the Box Plot chart component in Designer module.

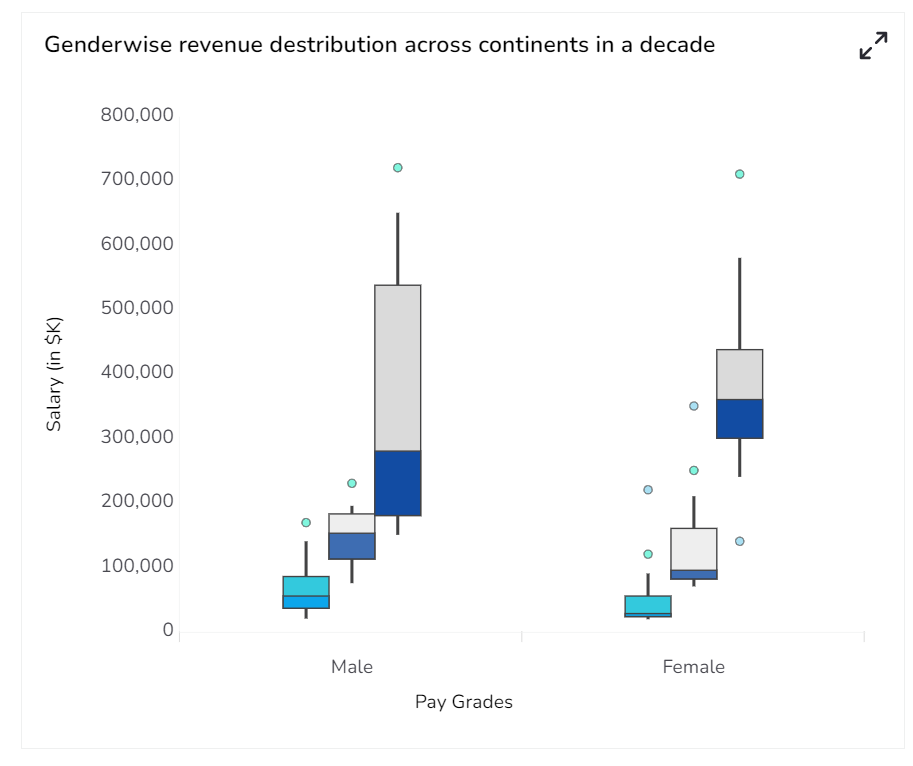
A box plot or whisker plot chart uses boxes and lines to depict the distributions of one or more groups of numeric data.
Box limits indicate the range of the central 50% of the data, with a central line marking the median value.
Lines extend from each box to capture the range of the remaining data, with dots placed past the line edges to indicate outliers.
The Box Plot chart helps to visualize the dataset in 5 number summaries (Min-Max-Q1-Q3-Median) along with the outliers.
Best Situation to use Box Plot chart
To show distributions of numeric data values
To compare multiple groups.
Consider the order of the groups.
Variations of this chart
Letter-Value Plots: It is an extension of the standard box plot. Letter-value plots use multiple boxes to enclose increasingly-larger proportions of the dataset.
Violin Plot: It is another alternative to the Box Plot wherein each group's distribution is indicated by a density curve.
Default Chart Image

Properties of Box Plot chart
Axis Setup
The user can enable auto axis and also provide maximum & minimum value to the axis. Also, if user need to see the zero-marker line, horizontal marker line and vertical marker line, then enable it here. Also, they can edit its color.
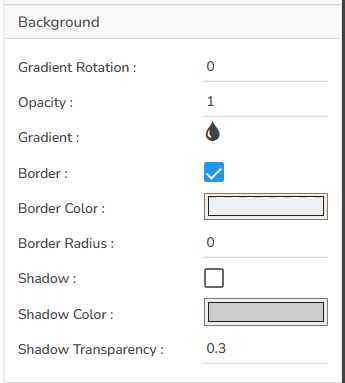
Background
The user can change the background color of the chart, can enable the border for the chart and can change the border color. Also, user can get the reflection of the chart by enable the shadow option can also change the color and increase & decrease the transparency of the shadow.
Formatter
The user can change units to % or none. Precision is given ifuser want the value in decimal format. Currency if user want the value in INR, Pound, USD. Position of the currency: if it's in prefix and currency in Rupee then the sign will be seen in left-side if it's in suffix then it will be seen in right-side. Number Formatter if we want it in Indian or international.
General
The user can change the height, width, top, left. If initial visibility is unchecked, then the chart won’t be visible at the first preview. If max button is unchecked, then user can’t maximize the chart separately. User can provide the fill color in order to make meaning full charts.
Legend
The user can enable the internal legend if they want to show and can change the font size, color, style etc.
Range
The user can enable Auto range option or else provide it in the range section.
Subtitle
The user can enable the subtitle if they have any second title and also, they can change the Name, Font color, size, style etc.
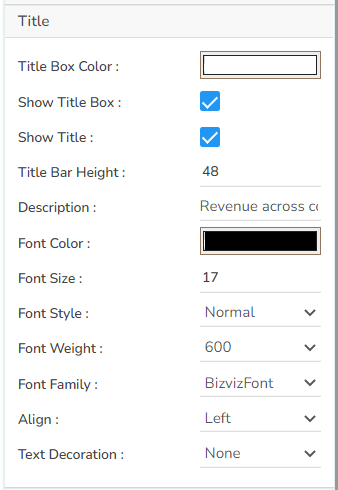
Title
The user can change Title Name, Font color, size, style etc.
Tooltip
If the user wants to show the description of series can use tooltip by enabling it.
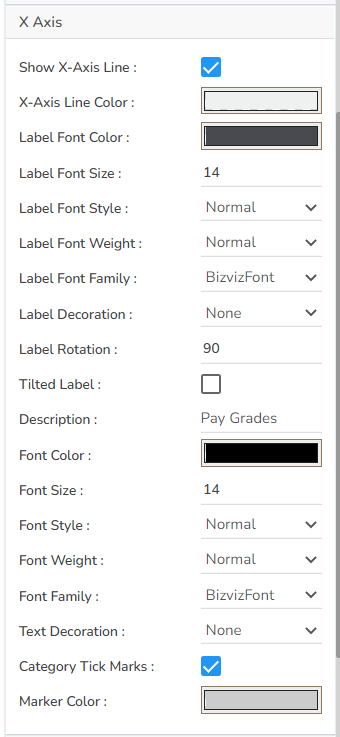
X Axis
The user can show the x-axis line, change the x-axis line color, label color, font size, font weight, font family, description etc. here. Also, if we want to rotate the label, it is also possible.
Y Axis
The user can show the y-axis line, change the y-axis line color, label color, font size, font weight, font family, description etc.

Dataset Properties Tab
Outlier-1 Properties

Outlier-2 Properties

Modified Chart after changing the Properties
Sample Data
Download the given sample data and map it as mentioned below to plot your Box Plot chart:
Select the Gender column as Category, Grade column as Subcategory. Select the rest of the columns based on their names such as choose the Min column under the Min field, the Max column under the Max field.