
Data Label
Check out the walk-through given below on how to configure Data Label in the charting components in the Designer.

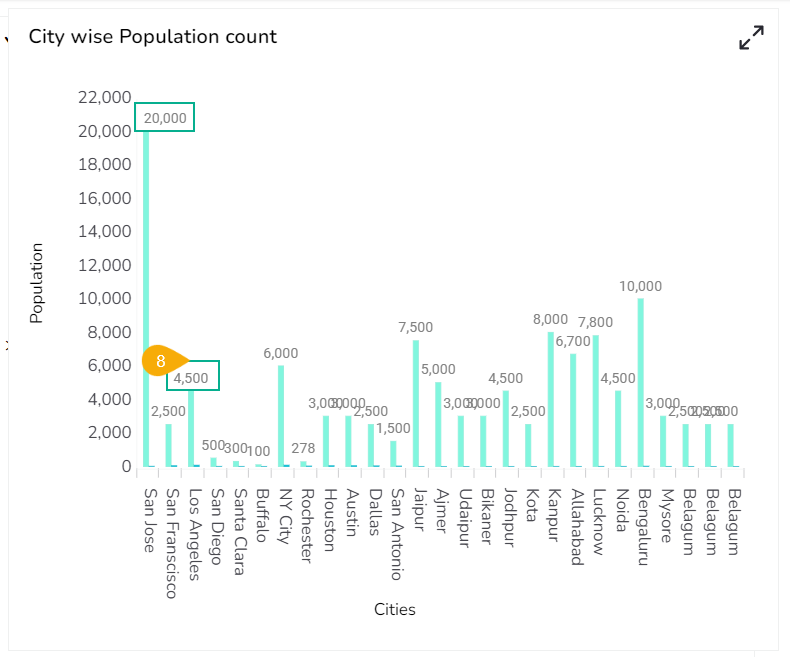
Drag and drop a chart component (as Column chart has been displayed in the given image).
Associate category and series fields to the chart.

Select a field from the Series section.
Navigate to the Properties of the selected series field.
Select the Data label icon.

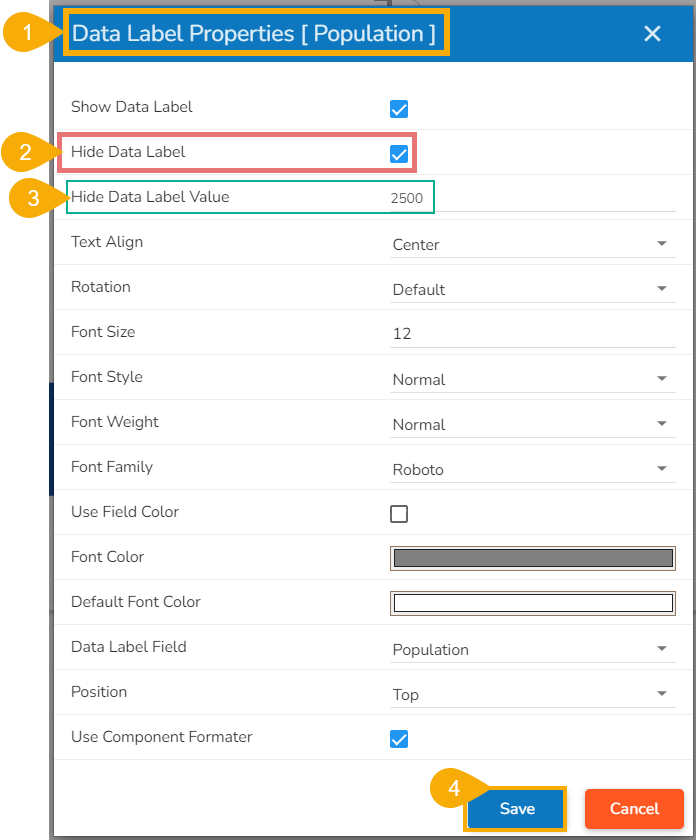
Enable the Show Data label from the Data Label Properties dialog box.
Click the Save option.

The configured Data Label properties will be displayed.
Hiding Data Label
The user can enable the Hide Data Label option from the Dataset Properties.
Access the Data Label properties fields.
Enable the Hide Data Label field.
Provide a specific value for which the Data Label should be hidden.
Click the Save option.
The Data Label gets hidden for the selected value in the chart preview.
E.g., No Data Label appears for the column displaying 2500 value as displayed in the given image.
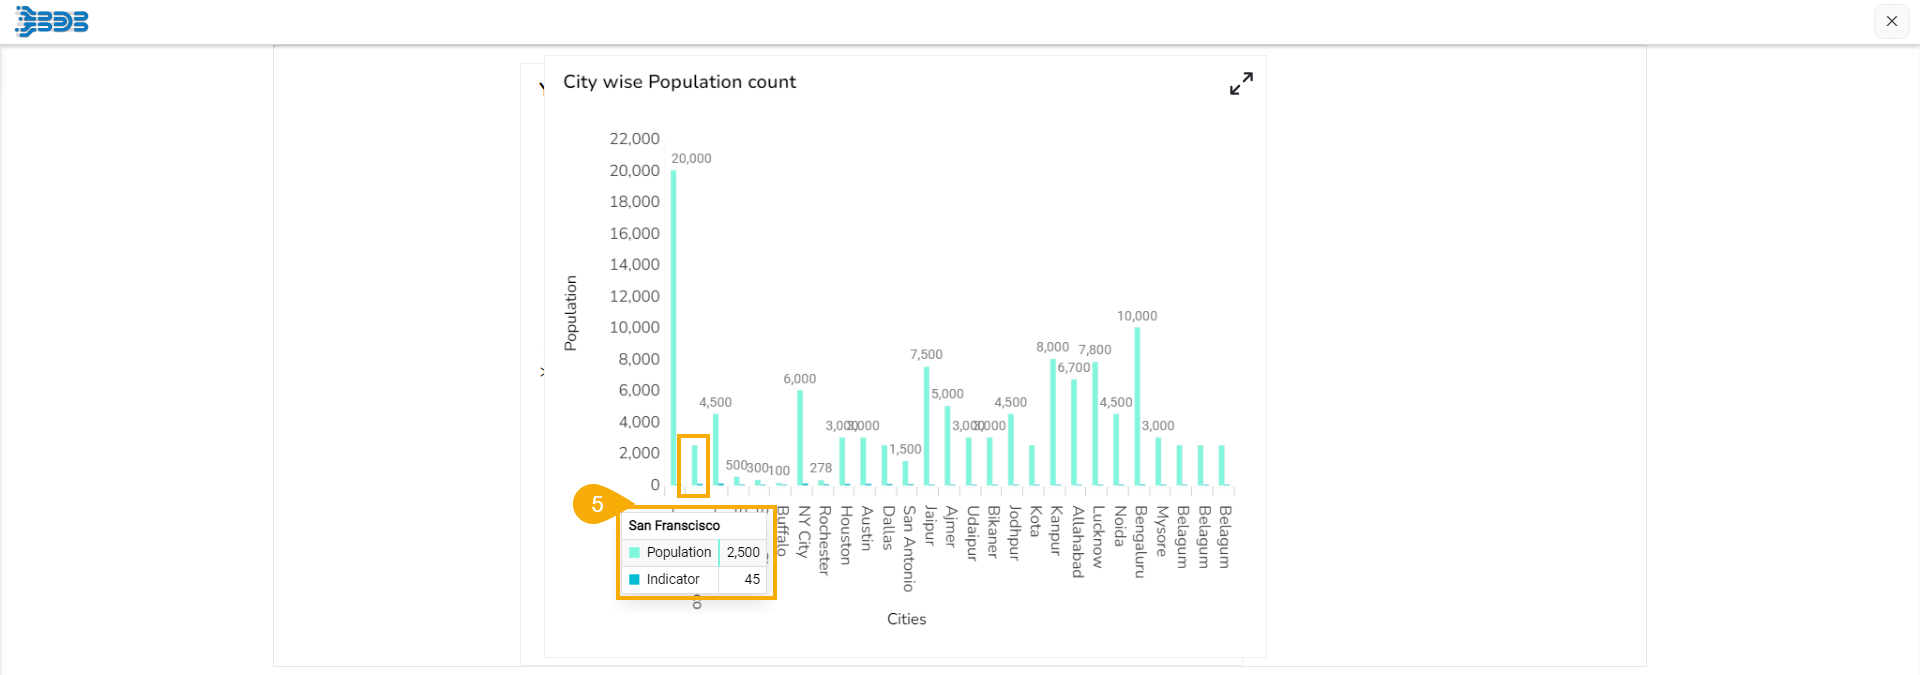

Please Note: The Hide Data Label field has been provided to hide the data label when the values are not needed to be shown (i.e., as the value 2 is hidden in the given walk-through).