# Indicators in Charts

{% hint style="success" %}
*Check out the walk-through given below on how to apply an Indictor to a charting component in the Designer.*
{% endhint %}

<figure><img src="https://859511478-files.gitbook.io/~/files/v0/b/gitbook-x-prod.appspot.com/o/spaces%2FGDmsjfjJBNqow7Fo97cO%2Fuploads%2FVqa38noebJGYUDYFYDdN%2FApply%20Indicator%20on%20chart%20.gif?alt=media&#x26;token=5470ae94-86ab-4c0f-9c5d-daba9aa2171f" alt=""><figcaption></figcaption></figure>

* Drag and drop chart component.

<figure><img src="https://859511478-files.gitbook.io/~/files/v0/b/gitbook-x-prod.appspot.com/o/spaces%2FGDmsjfjJBNqow7Fo97cO%2Fuploads%2FVvLsQHjXIxUXxNwB19T8%2Fimage.png?alt=media&#x26;token=44744b29-462c-4ff5-b4a4-b1809b104972" alt=""><figcaption></figcaption></figure>

* Associate category and series fields to the chart component.

<figure><img src="https://859511478-files.gitbook.io/~/files/v0/b/gitbook-x-prod.appspot.com/o/spaces%2FGDmsjfjJBNqow7Fo97cO%2Fuploads%2Fx720REgQUzl0J7n29SHr%2Fimage.png?alt=media&#x26;token=3695162c-6ad6-4d33-9e41-e45d40c1487b" alt=""><figcaption></figcaption></figure>

* There are two types of indicators in the chart component:
  * Category Indicator
  * Series Indicator

## **Category Indicator**

* Select the category field & navigate to the indicator tab.

![](https://859511478-files.gitbook.io/~/files/v0/b/gitbook-x-prod.appspot.com/o/spaces%2FGDmsjfjJBNqow7Fo97cO%2Fuploads%2FRjfjAHhn1HgX1AEGn7KV%2Fimage.png?alt=media\&token=03d64888-ff8a-4d9b-8cec-1ace917a8e74)​

* Click on the “+” icon to create a new indicator.
* Add the Category value and change the color based on the required conditions.

​![](https://859511478-files.gitbook.io/~/files/v0/b/gitbook-x-prod.appspot.com/o/spaces%2FGDmsjfjJBNqow7Fo97cO%2Fuploads%2FO6HeNmYW8JOe9nRVW2ru%2Fimage.png?alt=media\&token=d6aff5d6-e1fb-4ac2-8960-1eb23b20ce1d)​

* The created Category Indicator gets displayed in the preview mode as shown below:

<figure><img src="https://859511478-files.gitbook.io/~/files/v0/b/gitbook-x-prod.appspot.com/o/spaces%2FGDmsjfjJBNqow7Fo97cO%2Fuploads%2FxEJ181ZCXRMhPhd176ff%2Fimage.png?alt=media&#x26;token=be7b1123-c69f-4f1e-b2fc-f3683d163d52" alt=""><figcaption></figcaption></figure>

## **Series Indicator**

* Select the series field & navigate to the indicator tab.
* Click on the “+” icon to create a new indicator.

![](https://859511478-files.gitbook.io/~/files/v0/b/gitbook-x-prod.appspot.com/o/spaces%2FGDmsjfjJBNqow7Fo97cO%2Fuploads%2FJIjQxxao0wQrQffBi4N4%2Fimage.png?alt=media\&token=9cd3eecc-6cbb-49a7-95e8-e7b5c6661bf8)​

* An indicator dialog box appears with the required conditions.

![](https://859511478-files.gitbook.io/~/files/v0/b/gitbook-x-prod.appspot.com/o/spaces%2FGDmsjfjJBNqow7Fo97cO%2Fuploads%2FBximy40qJXuLIEgaBdGg%2Fimage.png?alt=media\&token=361ebe75-c8ff-4210-a27e-46e923c95e5c)​

* ***Operator:*** Multiple comparators are available for choosing the comparison process.

![](https://859511478-files.gitbook.io/~/files/v0/b/gitbook-x-prod.appspot.com/o/spaces%2FGDmsjfjJBNqow7Fo97cO%2Fuploads%2FRCeUw0yxw5d12FDVQWip%2Fimage.png?alt=media\&token=aef3e391-810f-436a-bdb8-b146354c5062)

* ***Fixed Value Comparison:*** By enabling this, we can compare a ***Compared Field*** against static values given in the ***Compare to*** text area.

![](https://859511478-files.gitbook.io/~/files/v0/b/gitbook-x-prod.appspot.com/o/spaces%2FGDmsjfjJBNqow7Fo97cO%2Fuploads%2ForZjbHejXKGbdi76hllJ%2Fimage.png?alt=media\&token=e09bd093-0a54-4843-8f1e-42a9bbfa9995)

* ***Fixed Value Comparison:*** By disabling this, we can compare a ***Compared Field*** against field values given in the ***Compare to*** field.

![](https://859511478-files.gitbook.io/~/files/v0/b/gitbook-x-prod.appspot.com/o/spaces%2FGDmsjfjJBNqow7Fo97cO%2Fuploads%2FMajvvLgpfNmuXDdM0dLM%2Fimage.png?alt=media\&token=e2cf197c-b0c2-4db1-8518-31ed97dc0d31)

* The created Indicator conditions get added.

![](https://859511478-files.gitbook.io/~/files/v0/b/gitbook-x-prod.appspot.com/o/spaces%2FGDmsjfjJBNqow7Fo97cO%2Fuploads%2FxIlhMuZ7xSKxylAlcV7R%2Fimage.png?alt=media\&token=588d335c-aacf-4815-97f1-328086238e07)​

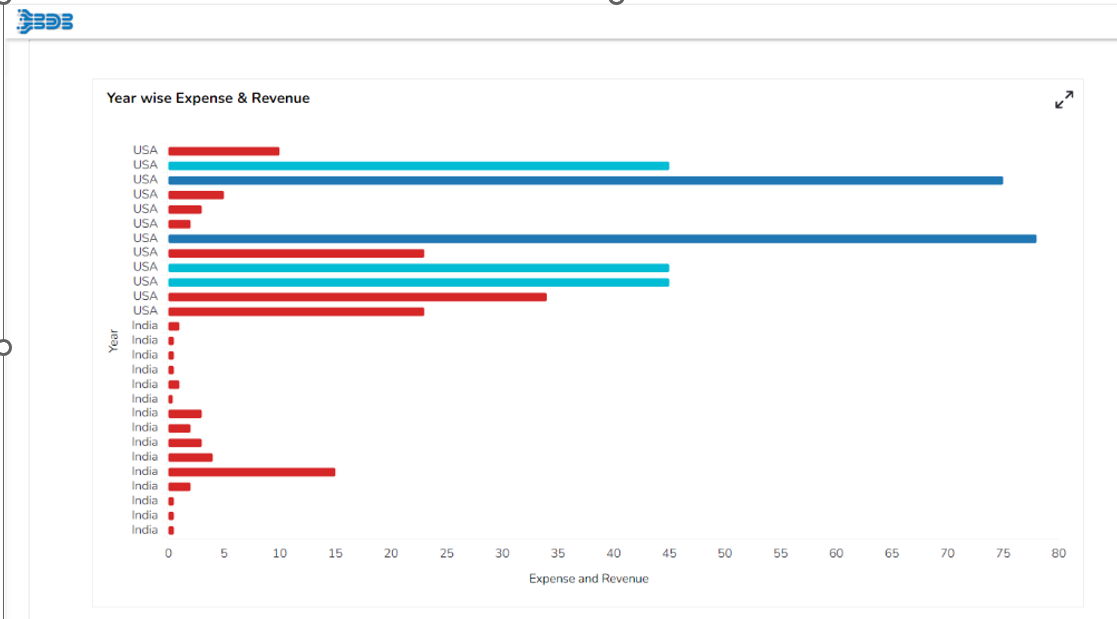
* The applied series Indicators appears in the preview mode of a Bar chart as given below:​

<figure><img src="https://content.gitbook.com/content/q31vylHQzfu10ahsh9Qq/blobs/dhBIorKmUT5JszeBK2g2/image.png" alt=""><figcaption></figcaption></figure>

{% hint style="info" %}
*<mark style="color:green;">Please Note:</mark> If the Category indicator is applied, the series indicator is not considered.*
{% endhint %}
