
Project Timeline
Check out the below given walk-through on how to use the Project Timeline chart component in Designer module.

The Project Timeline is an interactive visualization chart to visualize data in time. The data items can take place on a single date or have a start and end date (a range). Users can easily move and zoom in on the timeline by using the drag-drop and scroll functionalities. The time scale on the axis is adjusted automatically, and it supports scales ranging from milliseconds to hours to days to years. The Project Timeline uses regular HTML DOM to render the timeline and items placed on the timeline. It allows for flexible customization using CSS styling.
Best Situations to Use a Project Timeline chart
To track project deadlines and status with the timeline template. To update status throughout the project
Default Chart Image

Properties of the Project Timeline chart
Background
The user can change the background color of the chart, get the border for the chart, and change the border color. Get the reflection of the chart by enabling the shadow option and also change the color, increase or decrease the transparency of the shadow.
Export Options
The user can enable the 'Enable Context Menu’ from the preview section to download the reports in different formats. The user can change the heading and subheading of the downloaded charts and the name of the downloaded files from the Export context menu.
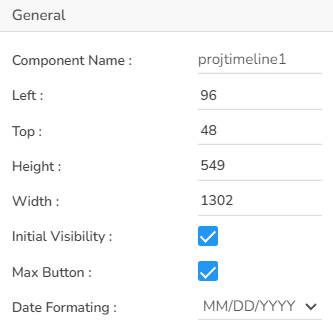
General
The user can change the height, width, top, left, can change date formatting.
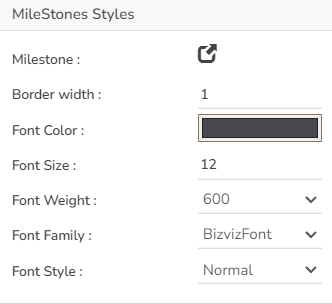
Milestone Styles
The user can change the task date flag color together with border width, font size, font color, etc.
Subtitle
The user can enable the subtitle to display the second title. The user can change the Name, Font color, size, style for the subtitle.
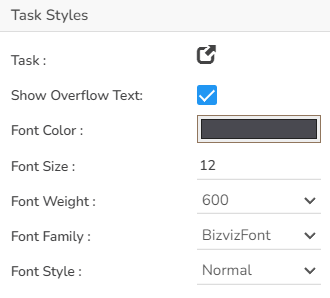
Task Styles
The user can change the task box color, can enable the text Overflow task font color, size.
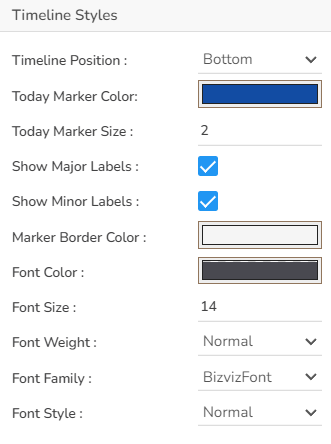
Timeline Styles
The user can change the Timeline position to bottom, left, right, can change the Today marker line color & marker size, can enable the minor & major labels, can change the font size, color, style, etc.
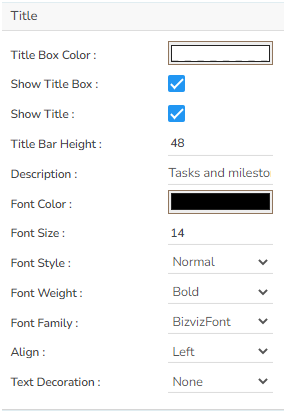
Title
The user can change Title Name, Font color, font size, font style, etc.
Tooltip
The user can show the description of the series can use the tooltip by enabling it.
Project Timeline chart by changing the Properties

Sample Data
Download the given sample data and map it as mentioned below to plot your Project Timeline chart.
Use the Category column as Category field, Start Date as Start Date field, End Date as End Date to plot data.