Title & Sub-title
Pre-requisite: To get data preview of any chart it is required to associate a data connection with the selected/ dragged charting component. To know how to create a Data Connection refer the Establishing a Data Connection section.
Check out the given walk-through on how to insert Title and Sub-title on the Designer charts.

The user can provide description for Title and Sub-title using the Title and Sub-Title properties fields.
Default Title Properties:

Modified Title Properties:

Default Sub-title Properties:

Please Note: The Show Sub Title field is not marked in the default properties display so, the Sub-title does not appear in the default data display of the chart.
Modified Sub-title Properties:

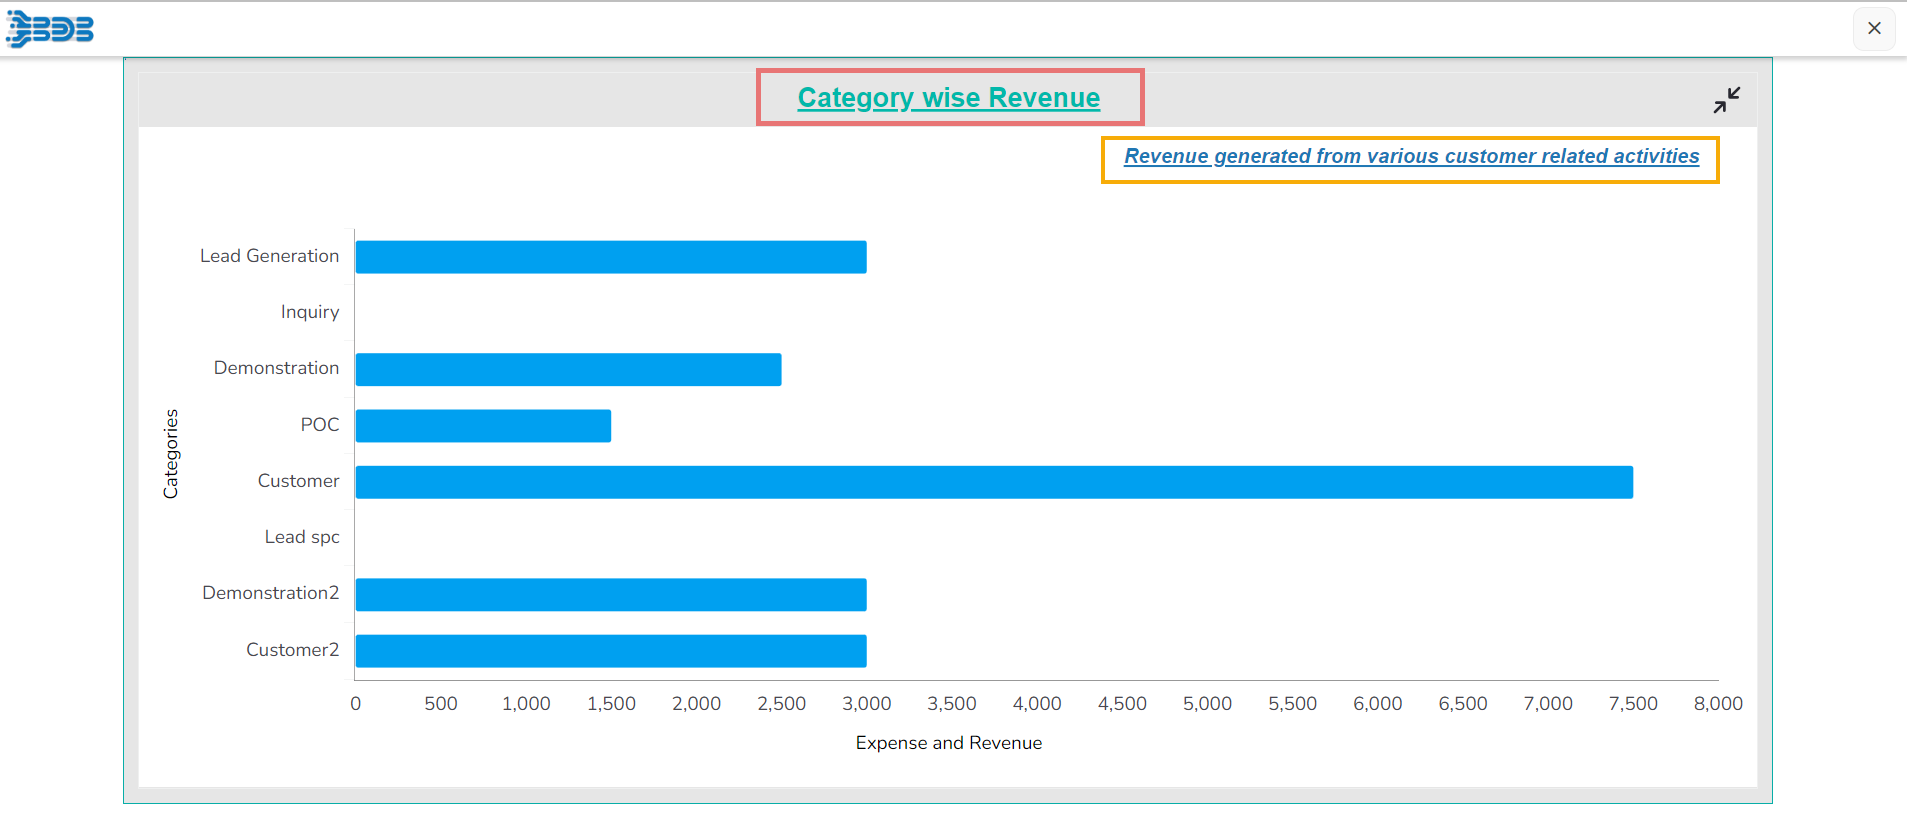
The below-given image displays data preview of a specific data with modified Title and Sub-title properties:

Please Note: All the charts with Title and Subtitle Properties contain a built-in text wrap functionality.
Show Dataset Description
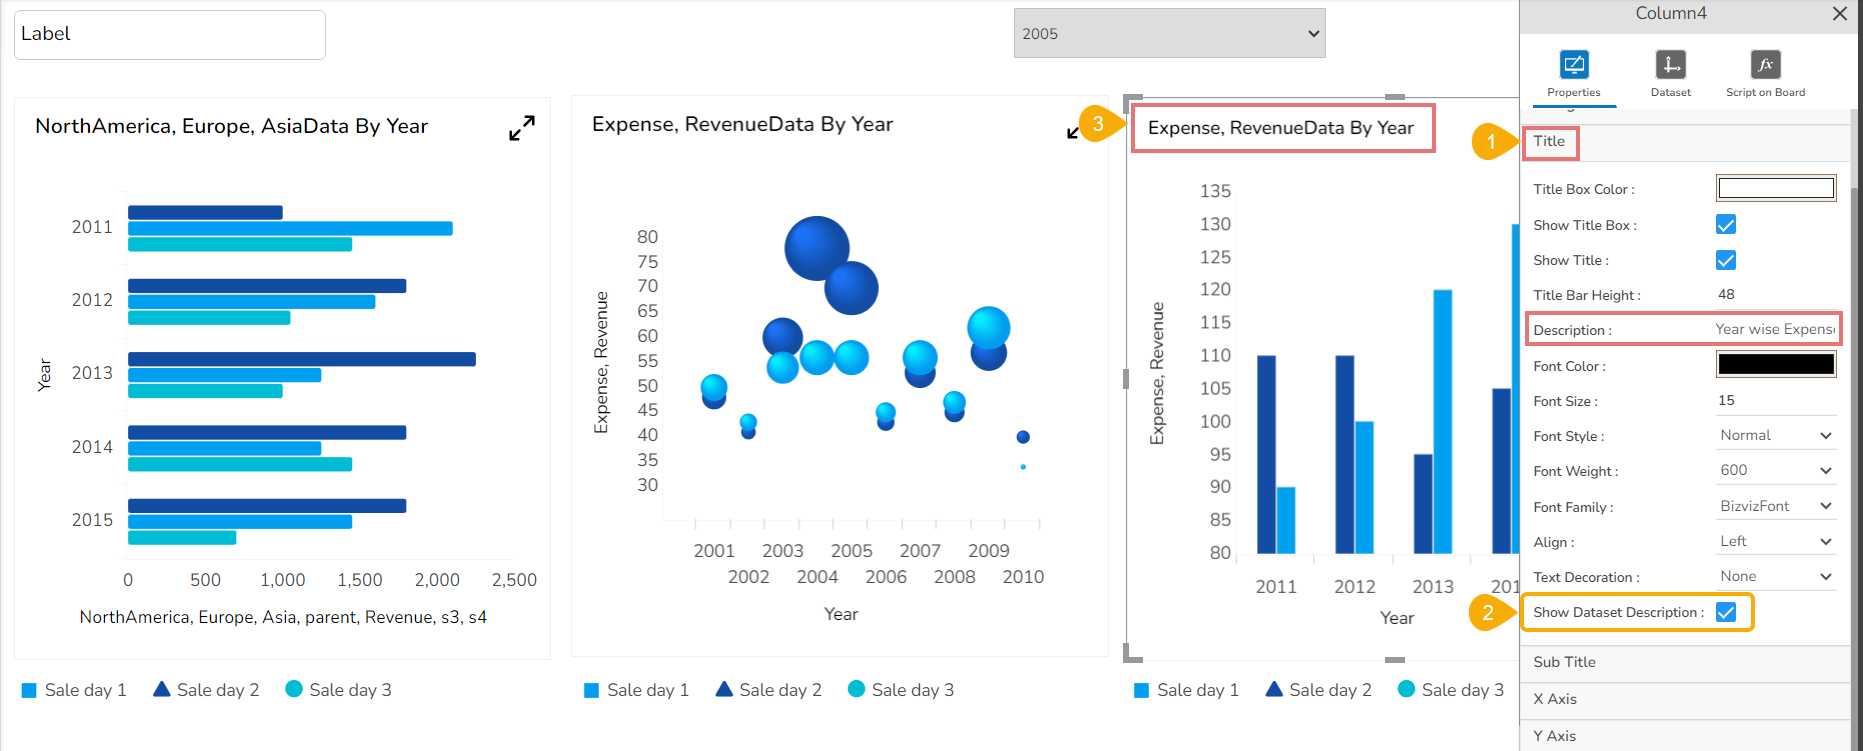
This properties option helps to get a Title for the selected component based on the selected dataset fields. The selected component must be mapped with a dataset.
Open the Title Properties section for a dragged chart component.
Enable the Show Dataset Description option.
It will reflect the Title description based on the selected category and series fields for that charting component ignoring the inserted Title description for that chart.
