Drill Highlighter
The Drill Highlighter feature in a dashboard helps to focus on specific data points or insights by drilling down into the data and highlighting relevant information. As the dashboard drills down to more granular data, the Drill Highlighter feature emphasizes the selected data point or elements by highlighting them. This makes it easier for users to focus on the relevant information and understand how their selection affects the overall data.
Please Note: This feature is available for Bar, Timeline, Bubble, Group Bar, Group Column, Mixed, Scatterplot, Line, and Column charting components.
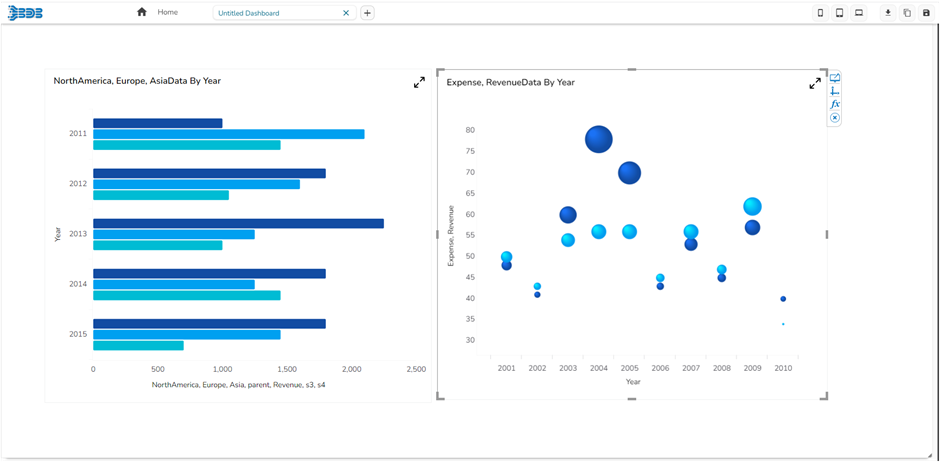
Drag & drop Bar & Bubble chart into canvas and assign data to it.

Navigate to dashboard script area, and write the script to enable drill highlighter (the script used has been provided in the code block).

Go to source component script area .ex, Go to bar chart script area & write a script to enable drill (the script used has been provided in the code block).

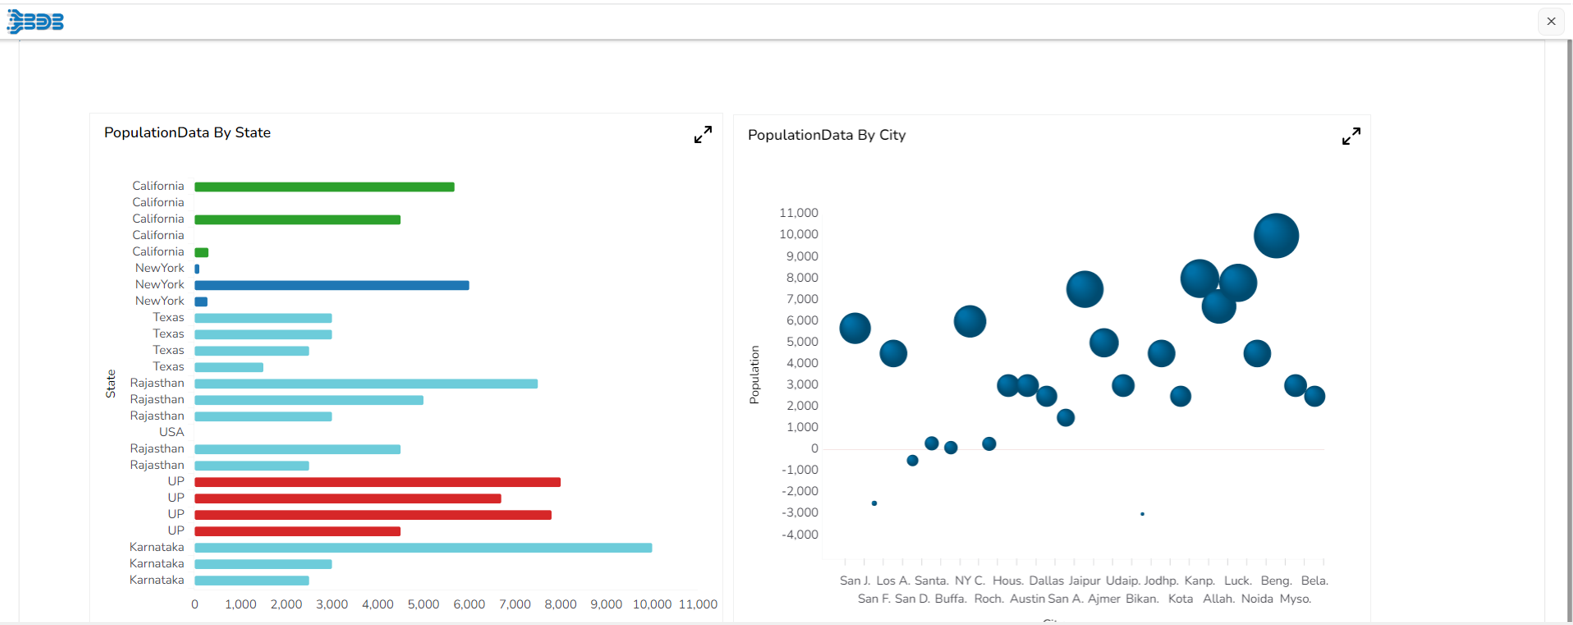
Preview the dashboard.

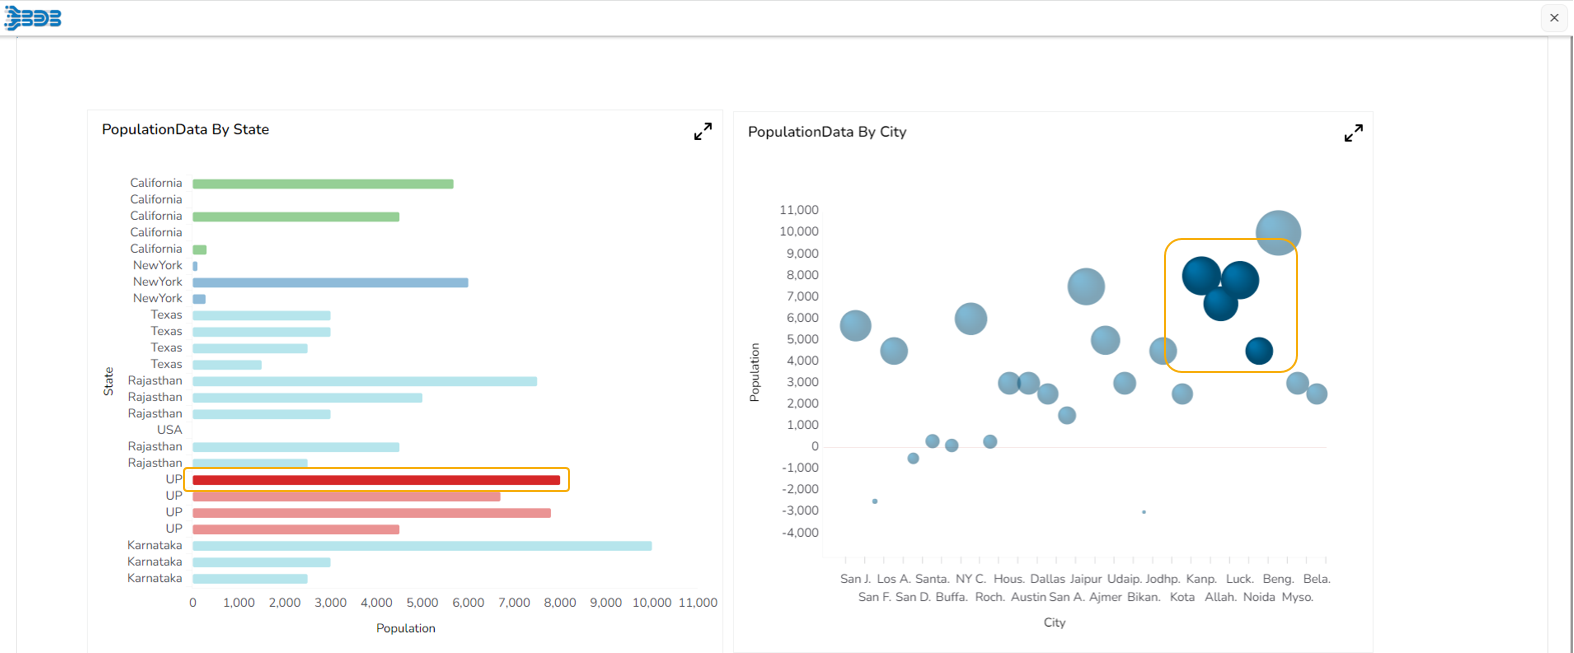
Click on a bar from the Bar chart, the drill will get applied in the associated chart. The drill highlighter will be applied to both the charts.
