
Data Sheet
Data Sheets are used to capturing various process, mechanical, electrical, technical, and control requirements for equipment and instruments. The sheets incorporate information about the selected components, usually with input from multiple users.
Best Situation to use Data Sheet Grid
To collect information from various users. To bring the collected information from the various users to one place. To search, filter, and compare the collected data.
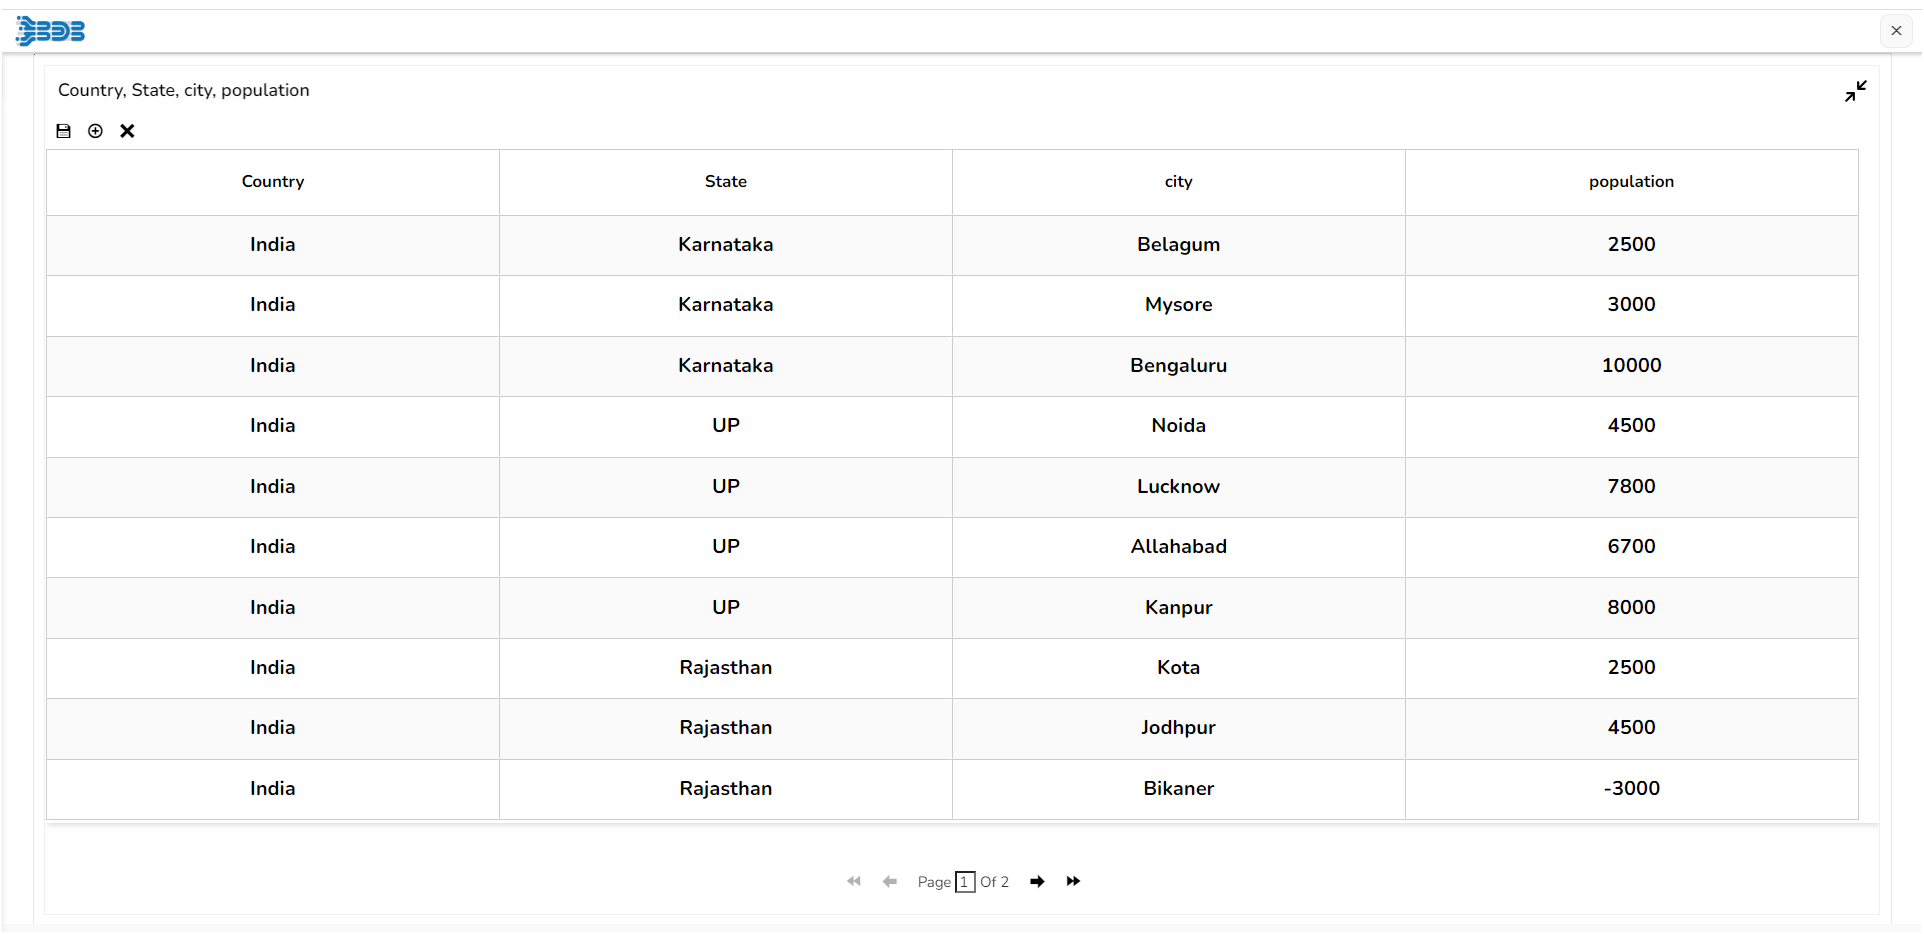
Default Data Sheet Chart Image

Properties of the Data Sheet component:
Background
The user can change the background color of the chart, can get the border for the chart and can change the border color, can get the reflection of the chart by enabling the shadow option can also change the color and increase & decrease the transparency of the shadow.
Export Options
The user can enable the ‘Enable Context Menu’ then it is possible to download the reports in different formats if we click on the chart from the preview section. The heading and subheading of that downloaded chart and the name of the downloaded file can be changed from this section.
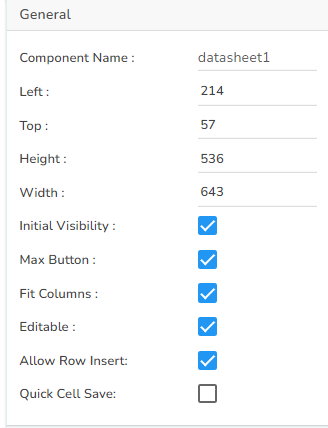
General
The user can change the height, width, top, left.
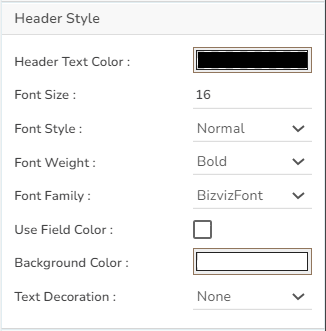
Header Style
The user can change the header text color, font size, font style, and background color.
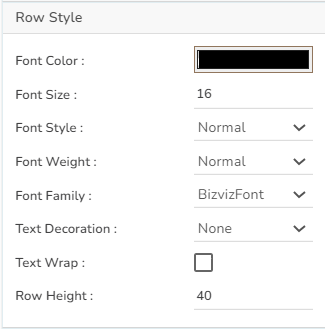
Row Style
The user can change the font size, font color, text decoration, enable the text wrap, and increase the row height.
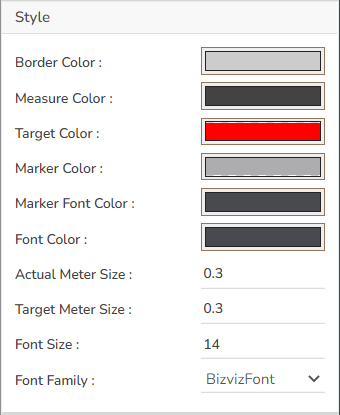
Styles
The user can change the grid colors.
Subtitle
The user can enable the subtitle to display the second title. The user can change the Name, Font color, Font size, Font style for the subtitle.
Title
The user can change Title Name, Font color, Font size, Font style, etc.

Data Sheet variants by changing the Properties:
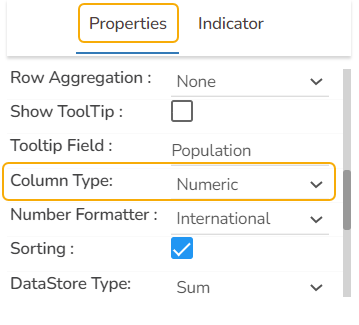
Please Note:
The user needs to select the Column Type as Numeric for the selected Data Grid fields using the Properties tab provided for the Dataset, so they become responsive to the changes that the user set using the Indicator tab.
Refer the Alerts in Grids page provided under Configurations section to understand how to insert Alerts in a Grid component.