# Data Sheet Connection
{% hint style="success" %}
*Check out the given walk-through on how to create a Data Sheet connection under the Designer module and associate it to a charting component.*
{% endhint %}
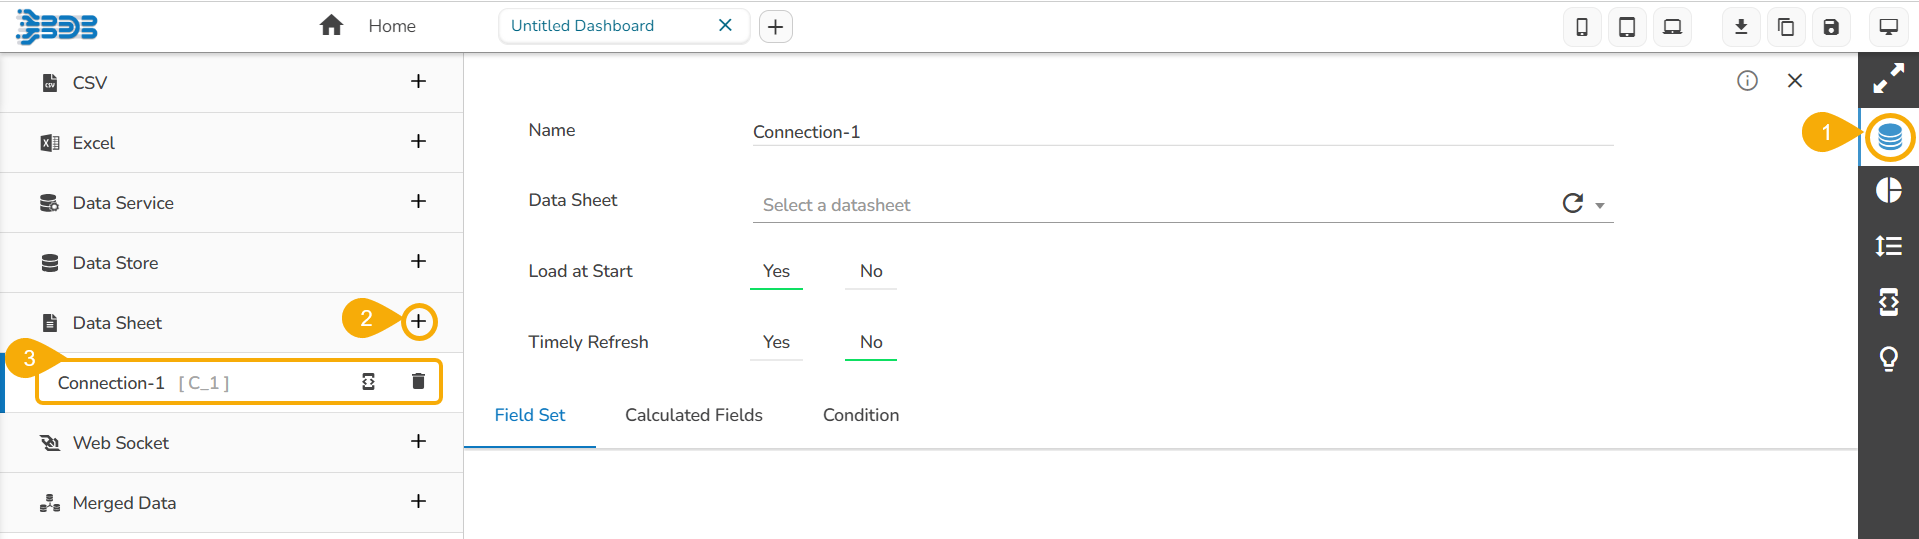
* Click the ***Data Connectors*** icon to display all the available data sources.
* Click the ***Create New Connection*** icon provided next to the ***Data Sheet*** connector.
* A new connection gets created under the Data Sheet connector type.
* The configurable connection-specific fields display on the right side of the page as explained below:
* **Name:** Provide a name for the connection.
* **Data Sheet:** Select a Data Sheet from the drop-down menu.
* **Load at Start:** Enable this option to get up-to-date data / pull the updated data from the data source before loading it into charts.
* **Timely Refresh:** Enable this option to get the refreshed data.
* **Refresh Interval:** Set the time for refresh interval. (This field will appear only when the ***Timely Refreshed*** field has been enabled.)
* The ***Field Set*** tab displays all the fields after establishing the data connection.
---
# Agent Instructions: Querying This Documentation
If you need additional information that is not directly available in this page, you can query the documentation dynamically by asking a question.
Perform an HTTP GET request on the current page URL with the `ask` query parameter:
```
GET https://docs.bdb.ai/governed-dashboards-6/connecting-to-a-data-source/establishing-a-data-connection/data-sheet-connection.md?ask=
```
The question should be specific, self-contained, and written in natural language.
The response will contain a direct answer to the question and relevant excerpts and sources from the documentation.
Use this mechanism when the answer is not explicitly present in the current page, you need clarification or additional context, or you want to retrieve related documentation sections.