> For the complete documentation index, see [llms.txt](https://docs.bdb.ai/governed-dashboards-6/llms.txt). Markdown versions of documentation pages are available by appending `.md` to page URLs; this page is available as [Markdown](https://docs.bdb.ai/governed-dashboards-6/charts-gallery/advanced-charts/word-cloud.md).
# Word Cloud
{% hint style="success" %}
*Check out the walk-through on how to use the Word Cloud chart component in the Designer module.*
{% endhint %}
Word Cloud is a visual representation of text data where the font size of a word depicts the frequency of this word in a set of text data. Even though Word clouds are not a perfect tool for data analysis and business data visualizations, they have their place in infographics. Word clouds can also reveal patterns in your responses that may guide future analysis.
## Best Situations to Use a Word Cloud Chart
* To analyze text data
* To identify trends and patterns that would otherwise be unclear or difficult to see in a tabular format
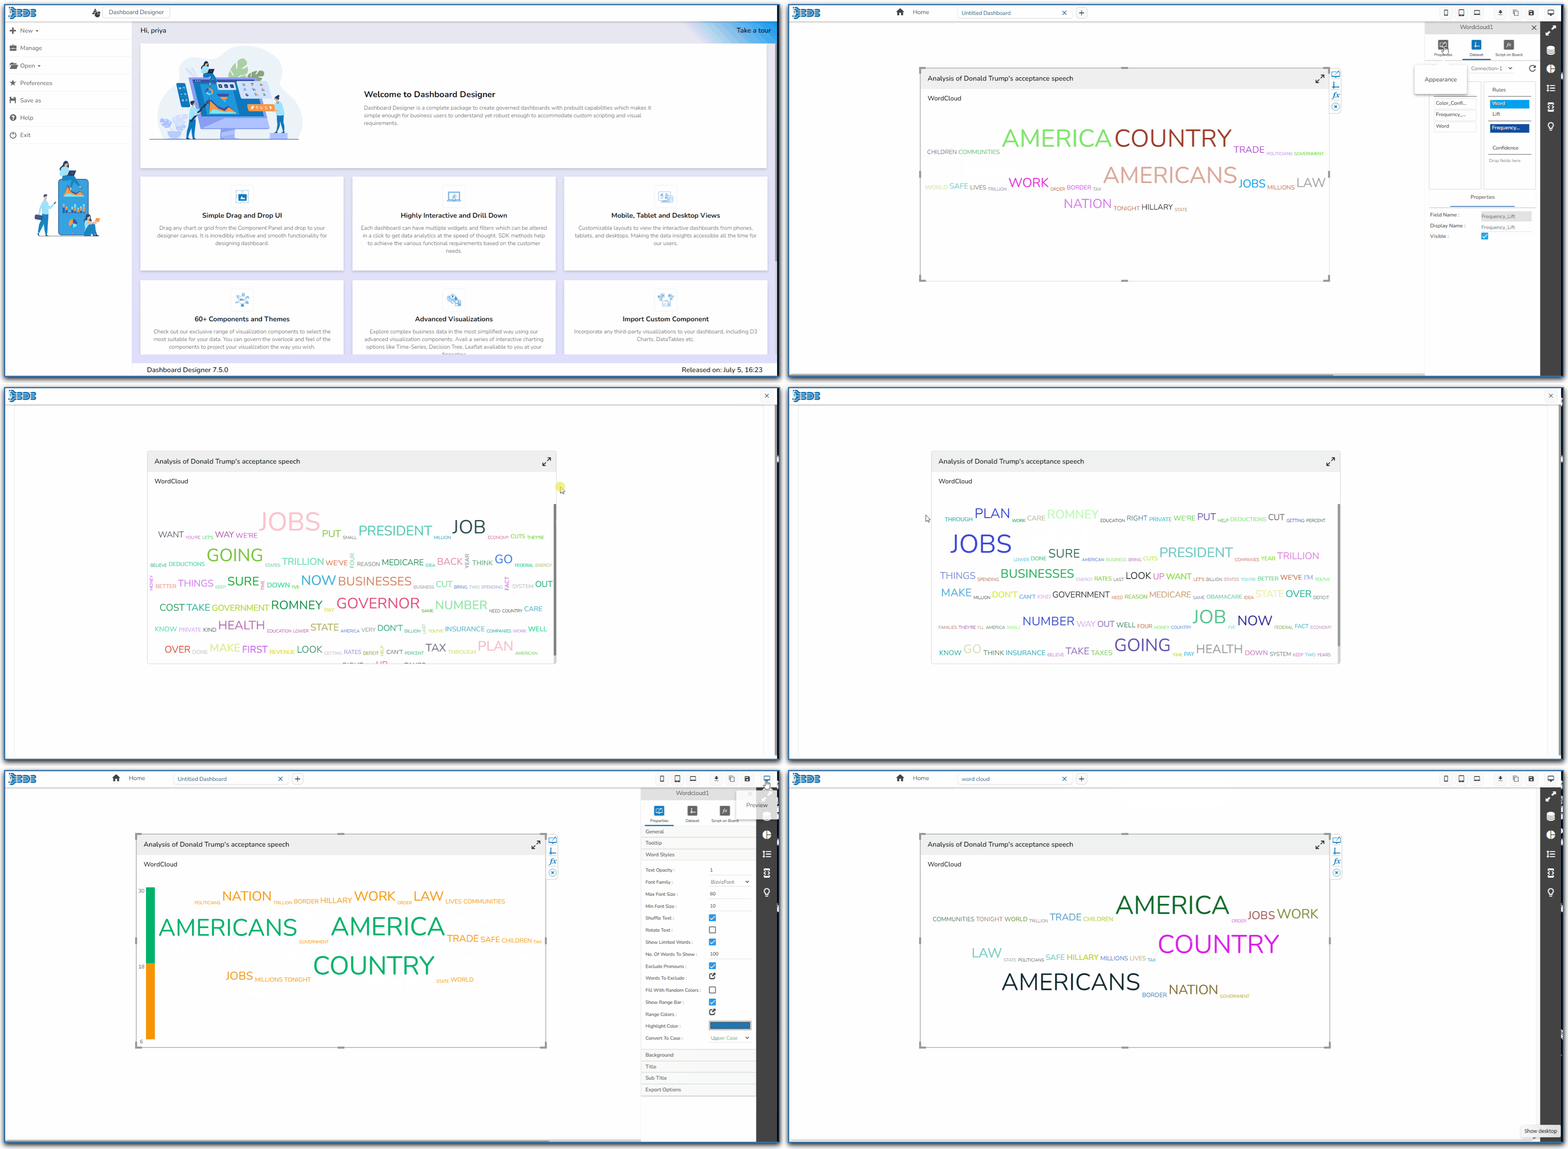
## **Default Chart Image**
## **Properties of the Word Cloud Chart**
### **General**
* **Component Name**: The unique identifier for the Wordcloud chart.
* **Left**: The position of the chart from the left edge of the containing element.
* **Top**: The position of the chart from the top edge of the containing element.
* **Height**: The vertical dimension of the chart.
* **Width**: The horizontal dimension of the chart.
* **Initial Visibility**: Whether the chart is visible when initially rendered.
* **Max Button**: Indicates if a button is available to maximize the chart.
* **Range Bar Width**: Specify the width of the range bar.

### **Tooltip**
* **Show Tool Tip**: Enable or disable the display of tooltips on the chart.
* Click the ***Show Tool Tip*** icon to access the ***Tool Tip Configuration*** window.
* Select the ***Default*** option.
* Click the ***Save*** option to display Tool Tip in the default display.

* **Tooltip Font Size**: Set the font size of the displayed text within the tooltip.
* **Precision**: Set the number of decimal places shown in the tooltip values. 
### Word Styles
* **Text Opacity**: Adjust the transparency level of the text in the word cloud.
* **Font Family**: Choose the font style for the words displayed in the word cloud.
* **Layout Shape**: Define the shape or layout structure of the word cloud (e.g., circular, rectangular).
* **Max Font Size**: Set the maximum font size for the largest word in the word cloud.
* **Min Font Size**: Set the minimum font size for the smallest word in the word cloud.
* **Fill With Random Colors**: Enable or disable the option to fill words with random colors.
* **Highlight Color**: Select a color to highlight specific words within the word cloud.
* **Highlight Font Size**: Set the font size for the highlighted words in the word cloud.
* **Random Colors**: Enable to use a random color palette for the words. Click the ***Random Colors*** icon.
* **Range Colors**: Define ranges of colors for the words by providing a limit in the word cloud. Click the **Range Colors** icon.

Applying Random Colors
* The ***Word Random Colors*** window opens.
* You may select from the displayed colors.
* Use the ***Add Colors*** option to specify and save your colors.
* Click the ***Save*** option to save your color selection.

Applying Multiple Range Colors
* **Range Colors**: Define ranges of colors for the words by providing a limit in the word cloud.
* Click the ***Range Colors*** icon.
* The ***Range Colors*** window opens.
* Use the ***Add a Range*** option to insert a new color range.
* Click the ***Save*** icon to save the ranges created by you.

* Enabling Dynamic Range:
* Enable the Dynamic Range option to access a dynamic range of colors from Min to Max.
* Click the ***Save*** option.

### Background
* **Gradient Rotation**: The angle at which the gradient background is applied to the chart.
* **Opacity**: The transparency level of the chart's background.
* **Gradient**: The type and direction of the gradient fill used in the background.
* Click the ***Gradient*** icon.
* The ***Background gradient colors*** window opens.
* Click the ***Add Color*** option.
* Click the ***Save*** option.

* **Border**: The style or type of border surrounding the chart.
* **Border Color**: The color of the border surrounding the chart.
* **Border Radius**: The curvature of the chart's corners.
* **Shadow**: Enable the shadow effect on the chart by marking the given checkbox.
* **Shadow Color**: The color of the shadow effect.
* **Shadow Transparency**: Set the transparency level of the shadow effect.
### **Title**
* **Title Box Color**: Choose the background color for the title box.
* **Show Title Box**: Enable or disable the display of the title box on the chart.
* **Show Title**: Enable or disable the display of the title text.
* **Title Bar Height**: Set the height of the title bar.
* **Description**: Add a description text below the title.
* **Font Color**: Select the color of the title text.
* **Font Size**: Specify the size of the title text.
* **Font Style**: Choose a font style from the available choices (e.g., italic or normal).
* **Font Weight**: Set the weight (boldness) of the font. The supported options are Normal, Bold, 300, 600, and 900.
* **Font Family**: Choose the font family for the title text from the given choices.
* **Align**: Align the title text (e.g., left, center, right).
* **Text Decoration**: Apply text decorations (e.g., underline) to the title text.
* **Show Dataset Description**: Enable or disable the dataset description in the title. 
{% hint style="info" %}
*Please Note: By enabling the **Show Dataset Description** option the Title will get added from the mapped dataset.*
{% endhint %}
### Sub Title
* **Show Sub Title**: Enable or disable the display of the sub-title text.
* **Description**: Add a description text below the sub-title.
* **Font Color**: Select the color of the sub-title text.
* **Font Size**: Specify the size of the sub-title text.
* **Font Style**: Choose the font style for the Sub-title (e.g., italic or normal).
* **Font Weight**: Set the weight (boldness) of the font. The supported options are Normal, Bold, 300, 600, and 900.
* **Font Family**: Choose the font family for the sub-title text from the given choices.
* **Align**: Align the sub-title text (e.g., left, center, right).
* **Text Decoration**: Apply text decorations (e.g., underline) to the sub-title text. 
### **Export Options**
* **Enable Context Menu**: Activate a right-click context menu for quick access to export options in the preview mode of the chart.
* **Export Excel**: Save the chart data in an Excel file format (.xlsx).
* **Export CSV**: Export the chart data to a CSV file format (.csv).
* **Export JPEG**: Export the chart as a JPEG image (.jpg).
* **Export PNG**: Export the chart as a PNG image (.png).
* **Export PPT**: Export the chart to a PowerPoint presentation (.pptx).
* **Export PDF**: Export the chart as a PDF document (.pdf).
* **Show Print**: Include an option to print the chart directly.
* **Export Heading**: Add a custom heading to the exported file.
* **Export Sub Heading**: Add a custom subheading to the exported file.
* **Export File Name**: Specify the file name for the exported file/dashboard.
* **Global Export Type**: Define the default export format using the drop-down (e.g., Screenshot, Tabular).

## **Word Cloud chart by changing the Properties**
## Sample Data
Download the given sample data and map it as mentioned below to plot your ***Word Cloud*** chart:
Select the ***Word*** column as ***Rules***, ***Color\_Confidence*** column as ***Confidence***, and ***Frequency\_Lift*** column as ***Lift***.
{% file src="/files/Vior36TWM9eeRU3dLqGz" %}