> For the complete documentation index, see [llms.txt](https://docs.bdb.ai/governed-dashboards-6/llms.txt). Markdown versions of documentation pages are available by appending `.md` to page URLs; this page is available as [Markdown](https://docs.bdb.ai/governed-dashboards-6/charts-gallery/advanced-charts/trellis.md).
# Trellis
The Trellis chart is a network of small charts. It is a repetition of a chart across a grid. Generally, a minimum of two dimensions are used, one for the grid variable and another for the x-axis within each small chart. Users can analyze the metrics within each chart without a query (a selection) and compare with the rest of the group at the same time via a trellis chart. A chart will be shared on the same Y-axis, so it becomes easier for users to identify irregular behavior among the variables by accurately comparing the metrics across the grid.
## **Default Chart Image**
## Best Situations to Use a Trellis Chart
* Analyze text data
* Identify trends and patterns that would otherwise be unclear or difficult to see in a tabular format.
## **Properties of the Trellis Chart**
### **General**
* **Component Name:** The identifier for the chart component within the application.
* **Left:** Specifies the horizontal position of the chart on the display area.
* **Top:** Defines the vertical position of the chart within the layout.
* **Height:** Determines the vertical size of the chart.
* **Width:** Sets the horizontal size of the chart.
* **Initial Visibility:** Controls whether the chart is visible when first rendered.
* **Max Button:** An option to enable or disable the maximize button to expand the chart view.
* **Base Type:** Defines the fundamental configuration or type of the chart. The available options for Base type are Plain, Rectangle, Gradient 1, Gradient 2, and Gradient 3.
* **Row Height:** Specifies the height for each row within the chart structure.
* **Parent Aggregation:** Establishes the main aggregation procedure applied to the chart's data.
* **Aggregation Type:** Sets the method of data aggregation to be applied, such as sum or average.
* **Drawing Mode:** Indicates the mode or style used for rendering the chart.
* **First Column Width:** Determines the width of the first column, setting the layout for subsequent columns.

### **Merge Series**
The **Merge Series** properties allow users to configure and customize the merging of data series in the chart. The following fields are available for configuration:
* **Enable Merge Series:** Toggle this option to activate or deactivate the merging of series within the chart. When enabled, multiple data series are combined into a single visualization.
* **Chart Type:** Select the type of chart to be used when series are merged. This determines how the combined data will be presented visually within the chart.
* **Field Title:** Specify a title for the merged data field. This title is displayed in the chart to identify the collective data representation.
* **Column Width:** Adjust the width of the column that represents the merged series in the chart, allowing for customization of the visual layout.
* **Column Type:** Choose the type of column used in the chart, which affects how the merged series is structured and displayed within the chart view.

### Background
To customize the appearance of the Knowledge chart, users can configure the following background properties:
* **Gradient Rotation**: Adjust the angle of the gradient fill to create smooth transitions between colors.
* **Opacity**: Set the transparency level of the background, allowing for varying degrees of visibility.
* **Gradient**: Choose and customize a gradient fill, which includes selecting multiple colors and blending them seamlessly.
* Click the ***Gradient*** icon to access the ***Background gradient colors*** window for selecting background gradient colors.

* The ***Background gradient Colors*** dialog window opens.
* Click the ***Add Color*** option to insert more colors.
* Click the ***Save*** option to save the selected background colors. 
* **Border**: Define the thickness and style of the border surrounding the chart.
* **Border Color**: Select a specific color for the chart border to make it stand out or blend in with the background.
* **Border Radius**: Round the corners of the chart border to achieve a softer and more modern look.
* **Shadow**: Add a shadow effect to the chart to create depth and emphasize its placement.
* **Shadow Color**: Customize the color of the shadow to complement the overall design of the chart.
* **Shadow Transparency**: Control how transparent the shadow is, affecting the subtlety of the shadow effect.

### Title
The Title properties provide various customization options for enhancing the presentation of the title box within your project. These include:
* **Title Box Color**: Set the background color of the title box for visual distinction.
* **Show Title Box**: Toggle the visibility of the title box, allowing it to be hidden or displayed as needed.
* **Show Title**: Control the visibility of the title text within the title box.
* **Title Bar Height**: Adjust the height of the title bar, enabling better visual balance and space management.
* **Description**: Allow for adding descriptive text that complements the main title, offering additional context.
* **Font Color**: Set the color for the title text, ensuring clarity and readability.
* **Font Size**: Specify the size of the title text, aiding in achieving visual hierarchy.
* **Font Style**: Enable the selection of the title's font style, such as italic or normal, to convey emphasis.
* **Font Weight**: Define the thickness of the title text, ranging from light to bold, for added visual impact.
* **Font Family**: Set the typeface of the title text to maintain consistency with other elements.
* **Align**: Align the title text within the title box, with options like left, center, or right for optimal layout.
* **Text Decoration**: Appliy additional stylings, such as underlines to the title text for emphasis.
* **Show Dataset Description**: Enable or disable the dataset description in the title.

{% hint style="info" %}
*Please Note: By enabling the **Show Dataset Description** option the Title will get added from the mapped dataset.*
{% endhint %}
### Subtitle
* **Show Subtitle**: Enable or disable the display of the subtitle in the chart.
* **Description**: Add descriptive text or additional information below the subtitle.
* **Font Color**: Select the color for the subtitle text.
* **Font Size**: Specify the size of the subtitle text.
* **Font Style**: Choose a font style for the subtitle, such as italic or normal.
* **Font Weight**: Set the weight (boldness) of the subtitle font. Options include Normal, Bold, 300, 600, and 900.
* **Font Family**: Choose the font family for the subtitle text from the available options.
* **Align**: Align the subtitle text to the left, center, or right.
* **Text Decoration**: Apply decorations like underlining to the subtitle text.

### Formatter
* **Unit**: Define the unit of measurement for the values displayed in the chart.
* **Precision**: Set the number of decimal places to display for numerical values.
* **Currency**: Format the numbers as a currency with the appropriate symbol.
* **Position**: Determine the position of the formatted value (e.g., before or after the number).
* **Number Formatter**: Apply a specific notation or style to the numbers (e.g., Indian, International).

### Export Options
* **Enable Context Menu**: Activate a right-click context menu for quick access to export options in the preview mode of the chart.
* **Export Excel**: Save the chart data in an Excel file format (.xlsx).
* **Export CSV**: Export the chart data to a CSV file format (.csv).
* **Export JPEG**: Export the chart as a JPEG image (.jpg).
* **Export PNG**: Export the chart as a PNG image (.png).
* **Export PPT**: Export the chart to a PowerPoint presentation (.pptx).
* **Export PDF**: Export the chart as a PDF document (.pdf).
* **Show Print**: Include an option to print the chart directly.
* **Export Heading**: Add a custom heading to the exported file.
* **Export Sub Heading**: Add a custom subheading to the exported file.
* **Export File Name**: Specify the file name for the exported file/dashboard.
* **Global Export Type**: Define the default export format using the drop-down (e.g., Screenshot, Tabular).

### Styles
The **Styles** properties allow users to customize various aspects of the chart's appearance:
* **Horizontal Grid Lines:** Enable or disable horizontal grid lines in the chart.
* **Horizontal Line Color:** Select the color for horizontal lines.
* **Vertical Line Color:** Choose the color for vertical lines.
* **Header BG Color:** Set the background color for the header of the chart.
* **Font Color:** Adjust the color of the text displayed in the chart.
* **Font Size:** Change the size of the text for clarity and emphasis.
* **Font Style:** Select font styles such as normal, italic, or oblique.
* **Font Weight:** Define the thickness of the text, e.g., normal, bold.
* **Font Family:** Choose the typeface for the chart text.
* **Text Align:** Align text to the left, right, center, or justify it.
* **Text Decoration:** Add text decorations like underline or overline. 
## **Dataset Properties Tab**
.png?alt=media\&token=512ed10e-a1b8-45f7-8cb5-d73ff63d1d68)
##
## **Trellis chart variants by changing the Properties**
#### **Trellis Chart with Plain Base and Drawing Horizontal mode**
#### **Trellis Chart with Rectangle Base and Drawing Horizontal mode**
#### **Trellis Chart with Gradient1 Base and Drawing Horizontal mode**
#### **Trellis Chart with Gradient2 Base and Drawing Horizontal mode**
#### **Trellis Chart with Gradient3 Base and Drawing Horizontal mode**
#### **After Changing the Merge Properties**
**Trellis with Line chart**
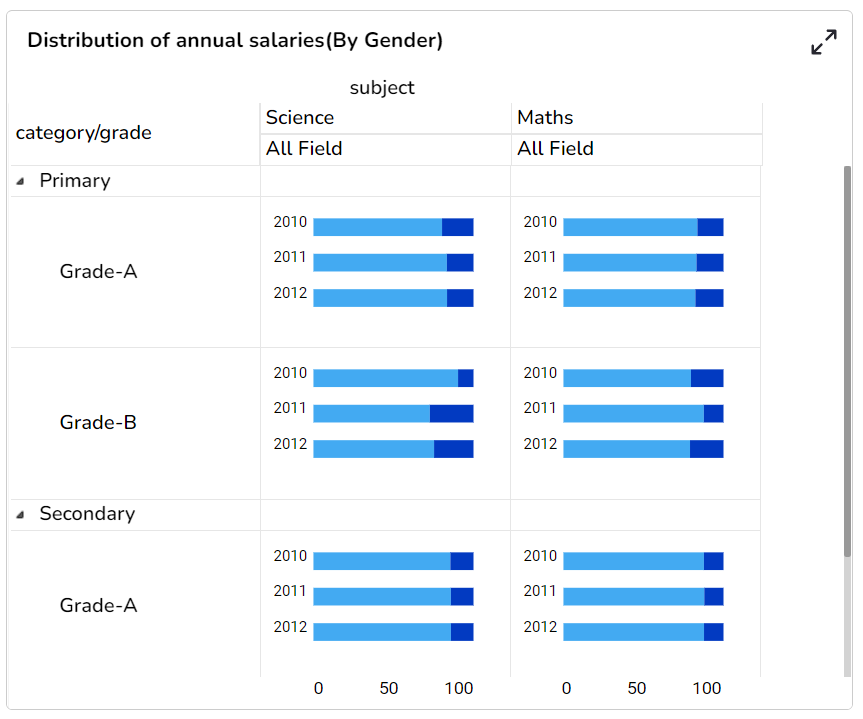
#### **Trellis with Bar chart & Stacked column**
#### **Trellis with Bar chart & Clustered column**
#### **Trellis with Bar chart & Overlaid column**
#### **Trellis with Bar chart & 100% column**
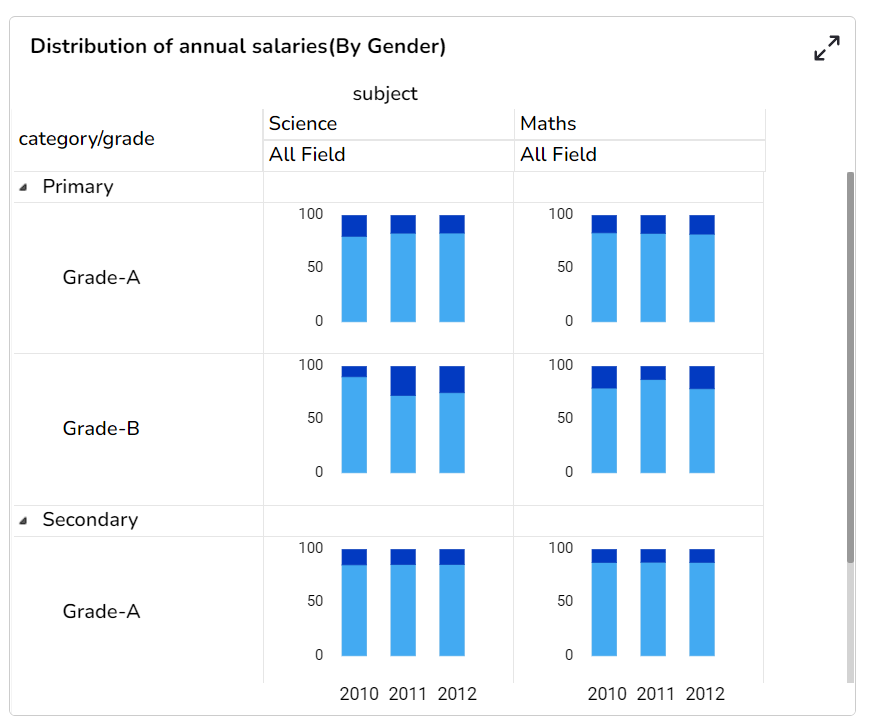
#### **Trellis with Column chart & Stacked column**
#### **Trellis with Column chart & Clustered column**
#### **Trellis with Column chart \&Overlaid column**
#### **Trellis with Column chart & 100% column**
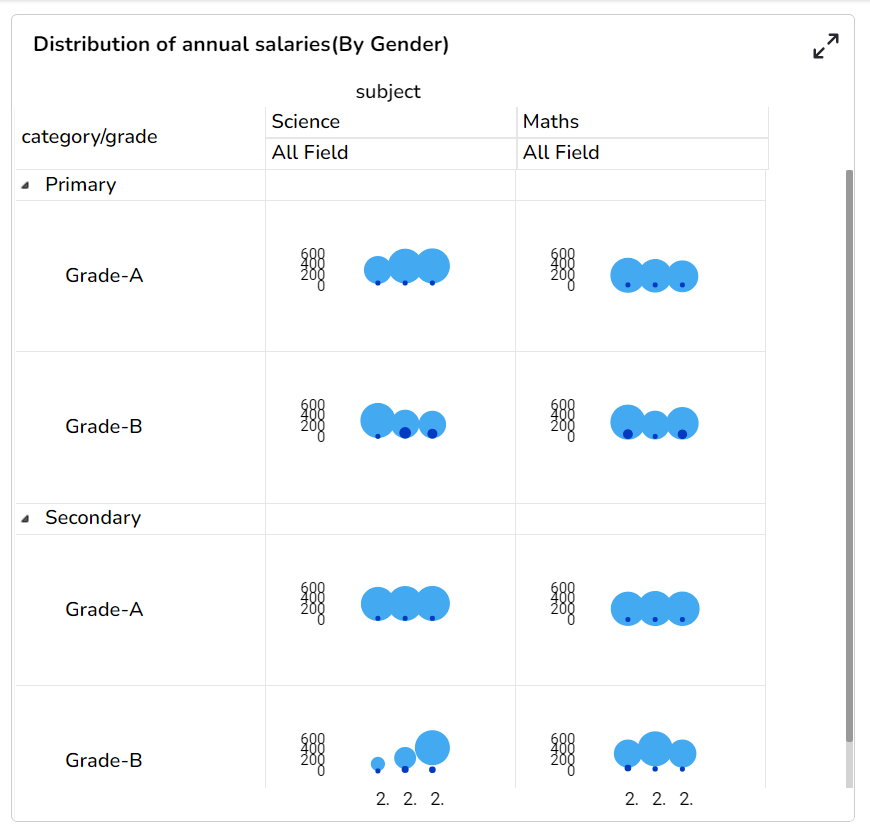
#### **Trellis with Shape chart**
## **Sample Data**
Download the given sample data and map it as mentioned below to plot your ***Trellis*** chart:
Use the ***Year*** column as ***Row,*** ***Subject*** column as ***Column***, ***t1*** and ***t3*** columns as ***Series***, and ***category*** column as ***Category*** to plot the chart as given below:
{% file src="/files/VRlumAOnBu8maallPZoB" %}