Decomposition
The decomposition tree provides a powerful tool for visualizing data across various dimensions. It allows a detailed data analysis by drilling down into the hierarchical structure. It splits core metrics and identifies key factors that affect these metrics. With the help of artificial intelligence (AI), the decomposition tree can even identify the next data dimension to explore based on predefined criteria.
Best Situations to Use a Decomposition Chart
When the user has a time series data set with a clear trend and seasonality patterns, a decomposition tree chart can help break down the time series into its components and make it easier to analyze.
To identify underlying trends and seasonality in your business data.
E.g., a Decomposition chart can help a retailer to accurately forecast sales for a particular product and adjust inventory and marketing strategies accordingly.
Steps to Configure Decomposition Chart
Drag and drop the decomposition chart from the component library. The chart looks as given in the below image on the Designer canvas page:
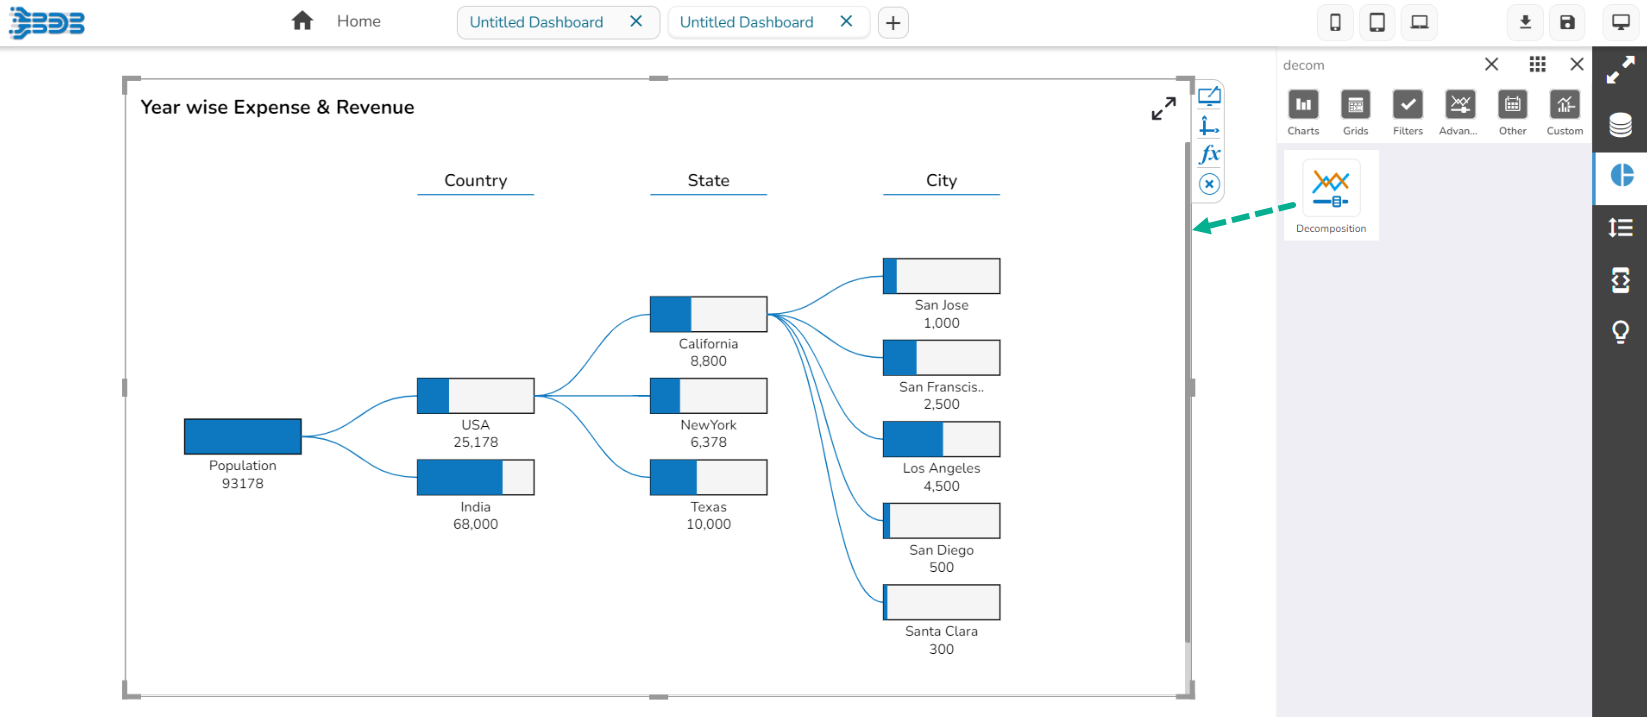
Associate a valid dataset. The sample Dataset used to generate a model chart is given below:
Consider the Series field as Population and visualize population data in a hierarchical order according to categories such as Country, State, and City.
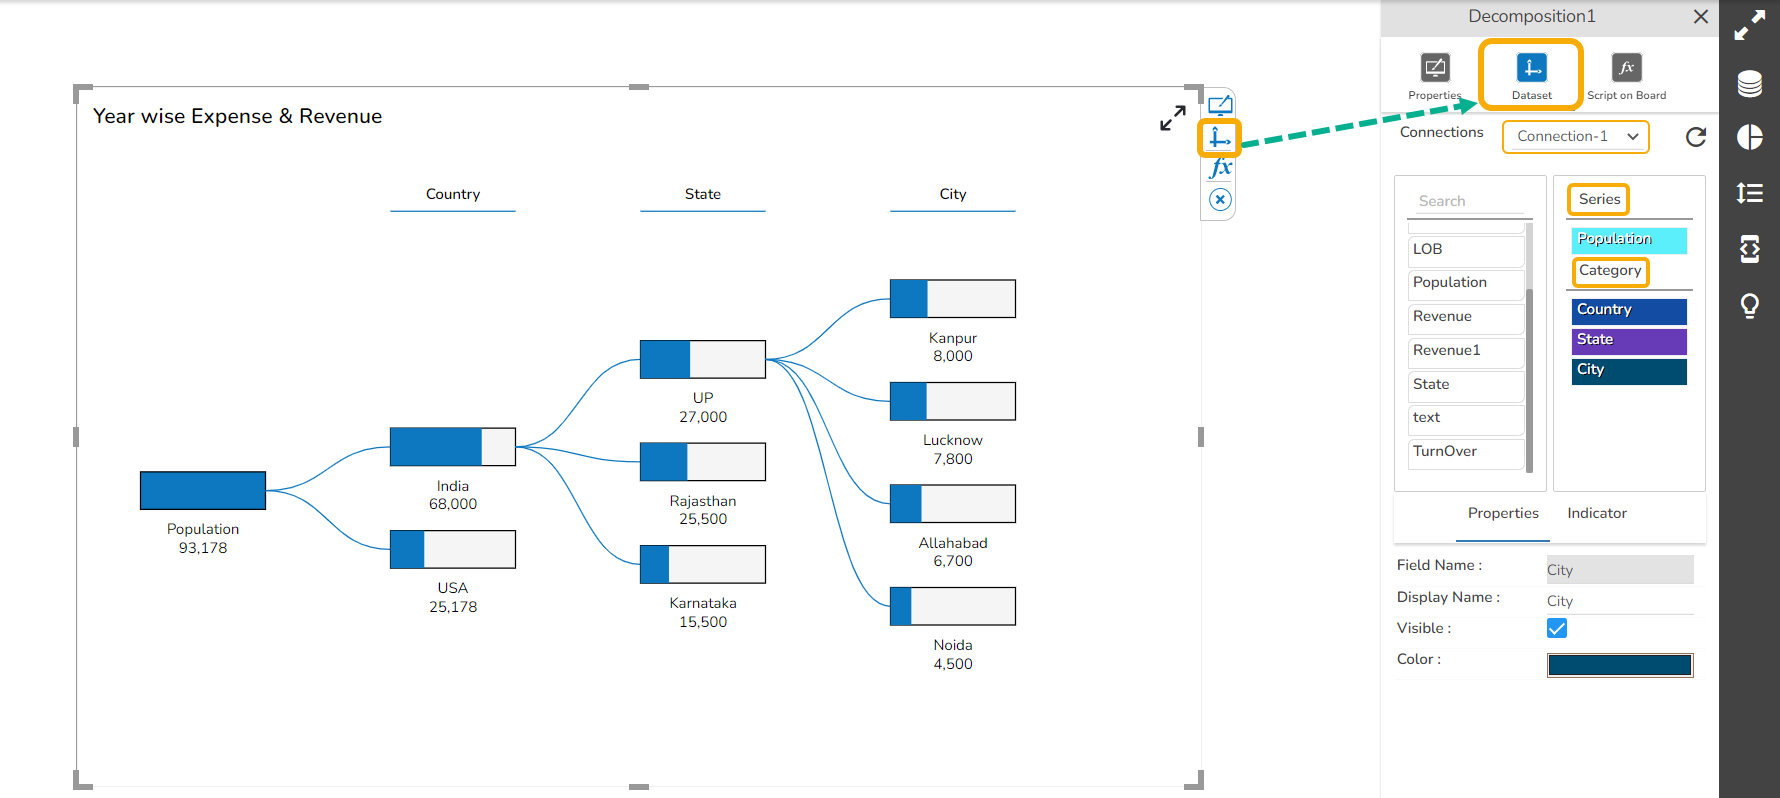
The total population per country, state, and city is displayed in each node while opening the Preview of the Dashboard.
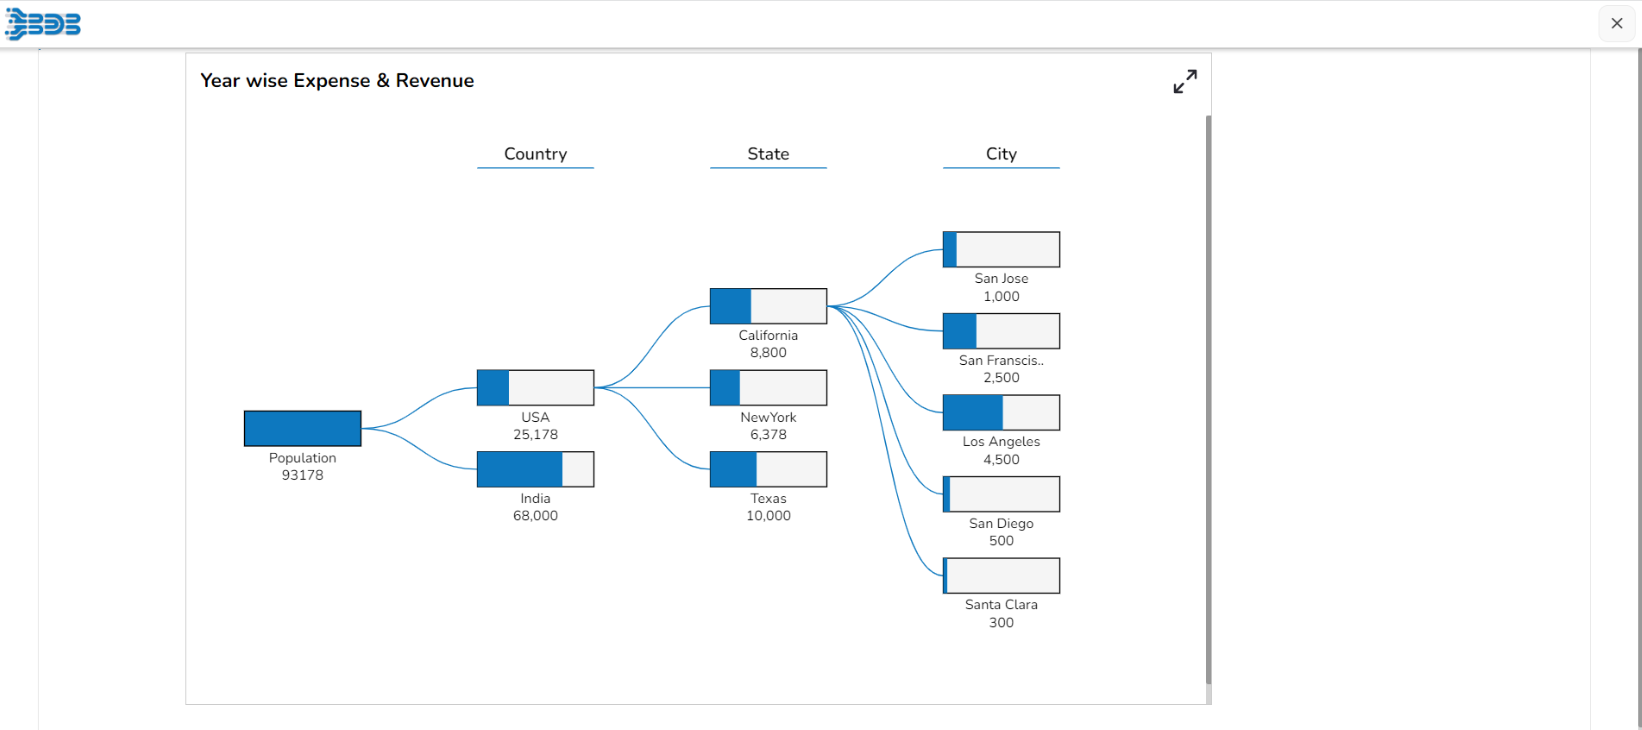
While clicking on one node, other nodes of the particular hierarchy get closed, and all the sub-categories/ children nodes are displayed. E.g., the sub-categories of the USA are displayed in the below-given image:
Appearance Properties
General
Users can change the height, width, top, and left. If the 'Initial Visibility' field is unchecked, the component won’t be visible at the first preview. Users can manage the max button to minimize and maximize the chart.
Component Name: Specify a unique name for the decomposition chart component. The default component name appears based on the component's dragging sequence for a dashboard.
Left & Top: Set the positioning of the chart on the display using these fields.
Height & Width: Adjust the chart dimensions to fit your layout requirements.
Initial Visibility: Determine whether the chart is visible upon the initial preview. If unchecked, it remains hidden.
Max Button: Allows users to minimize or maximize the chart as needed, providing flexibility in viewing.
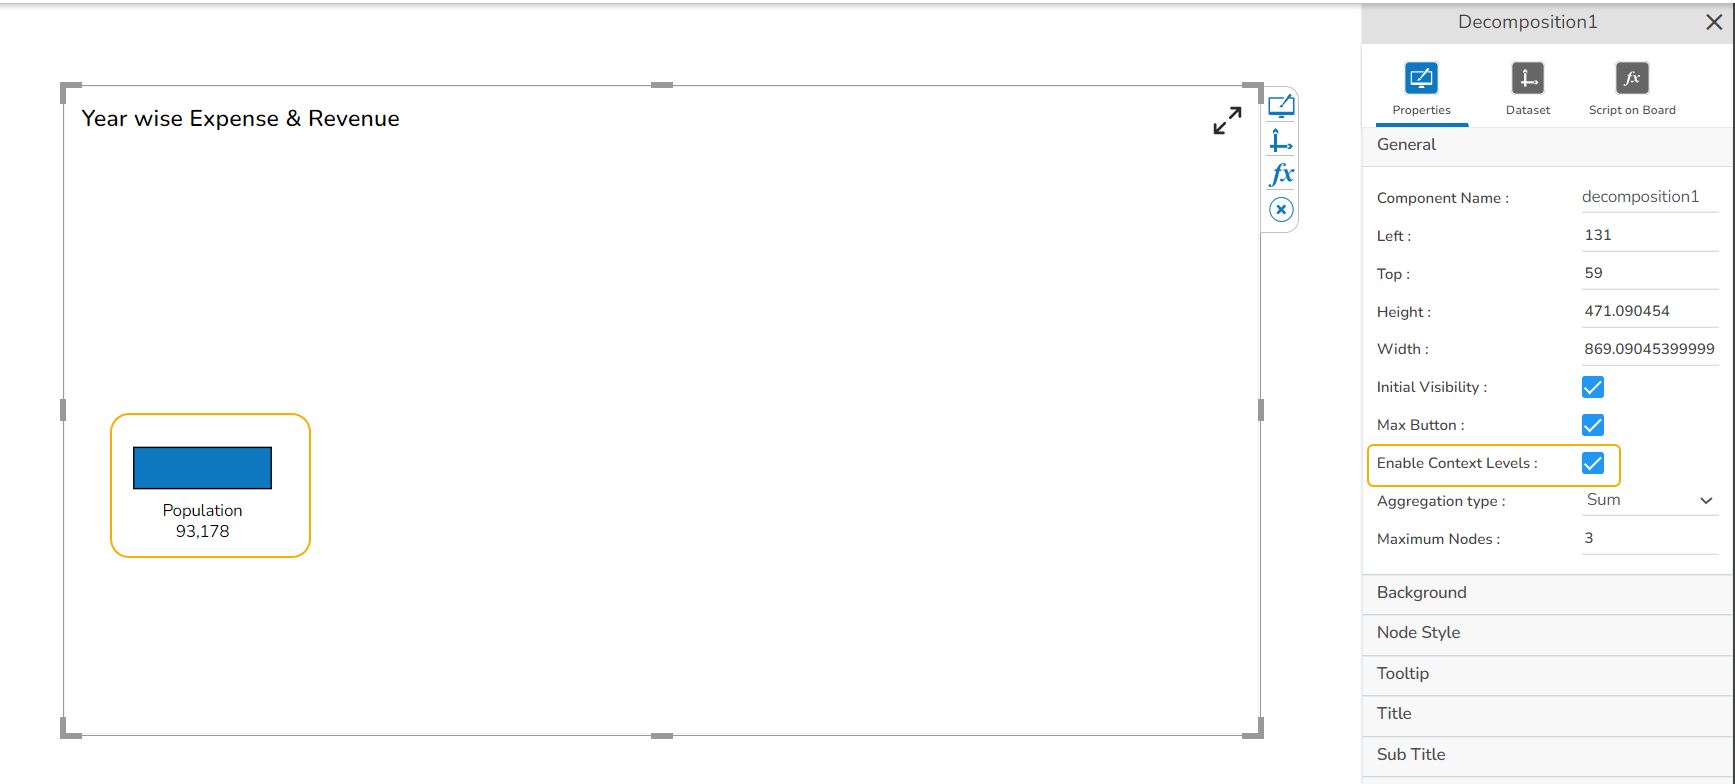
Enable Context Levels: Select this to activate additional hierarchy levels, offering detailed insights by drilling into the data.
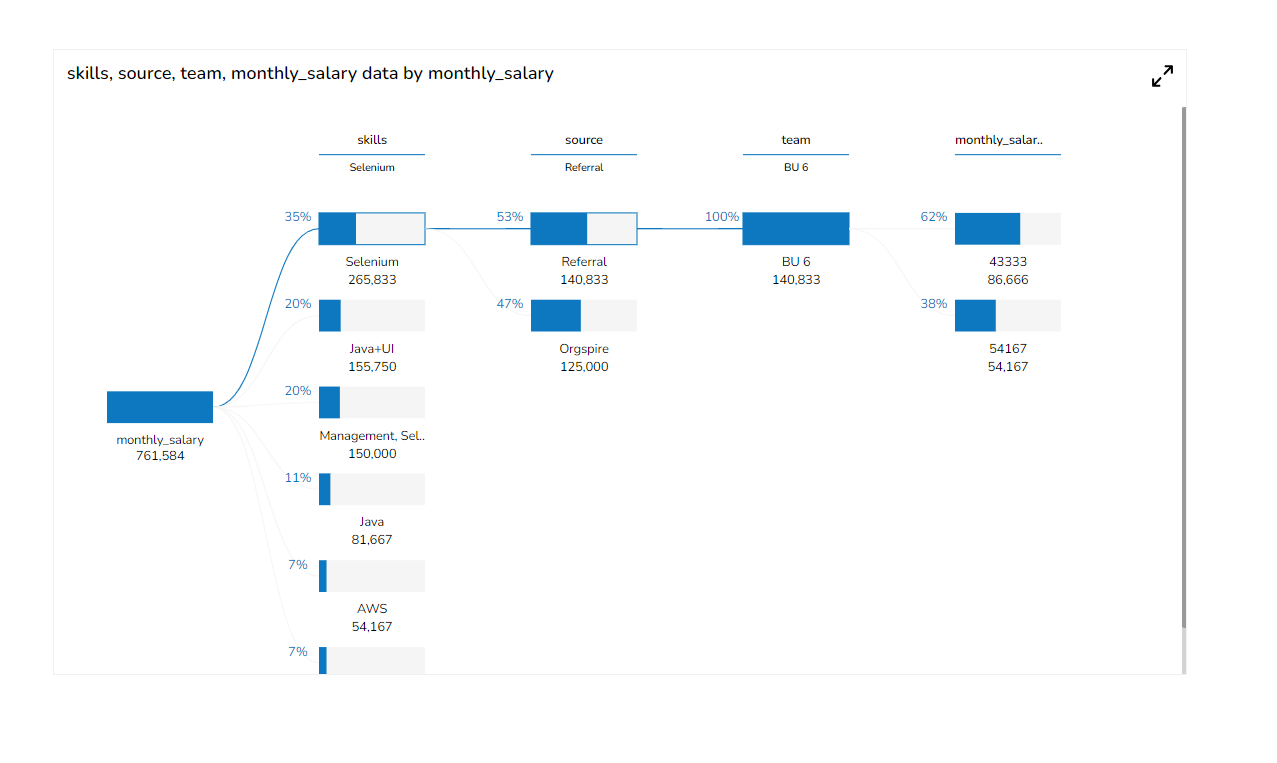
Show Percentage: Toggle this option to display percentage values alongside numerical data in the chart.
Aggregation Type: Choose the method for data aggregation (e.g., sum, average) to affect how data is presented.
Maximum Nodes: Define the limit for the number of nodes displayed, controlling chart complexity.
Animation: Enable animations to enhance visual transitions when interacting with the chart.

Background
When configuring the Decomposition chart, you can customize the appearance using the following background properties:
Gradient Rotation: Adjust the angle of the background gradient to create the desired effect.
Opacity: Control the transparency level of the background, where 0 is fully transparent and 1 is fully opaque.
Gradient: Choose a color gradient for the background to enhance visual aesthetics.
Click the Gradient icon using the Background properties.
The Background gradient colors dialog window opens.
Use the Add Color option.
Click the Save option.

The selected gradient colors will be applied to the chart background.

Border: Define the thickness of the border surrounding the chart.
Border Color: Select the color of the chart's border to match your theme.
Border Radius: Set the curvature of the chart's corners for a smoother look. A higher value results in more rounded corners, providing a softer appearance, while a lower value keeps the edges more angular.
Shadow: Enable or adjust the shadow effect to give depth to the chart.
Shadow Color: Specify the color of the shadow to complement the chart's design.
Shadow Transparency: Control the visibility of the shadow, where 0 means completely invisible and 1 means fully visible.

Node Style
Provide Node Style for styling the nodes and their default values.
Node Height: This option defines the vertical size of the nodes, allowing you to control how tall each node appears.
Node Color: This option determines the node's background color, affecting how nodes are visually distinguished.
Fill Color: This option adjusts the internal color filling the node, offering a layer of customization for node appearance.
Stroke Color: This option sets the color of the node's border, providing contrast and definition to the node's edge.
Label Font Color: This option specifies the color used for text on the node, enhancing readability by contrasting with the background.
Label Font Size: This option alters the size of the text label on the node, affecting text prominence and readability.
Label Font Style: This option allows font style selection options (e.g., italic, normal) from a menu to style the text appearance.
Label Font Weight: Provides options to adjust the thickness of the text used for labels, enhancing emphasis.
Label Font Family: Offers a selection of font families, enabling consistency with design guidelines.
Label Value Font Color: Sets the color of the values displayed on the node, ensuring clarity of numerical data.
Label Value Font Size: This determines the size of the values' font which impacts how numerical data is perceived.
Label Value Font Style: This lets you select font style options (e.g., italic, normal) for value text, giving flexibility in presentation.
Label Value Font Weight: It controls the boldness of value text, accentuating important data points.
Label Value Font Family: This option enables font family selection for node values, maintaining uniformity with other text elements.

The following image displays a customized Decomposition chart.

Tooltip
The Tooltip properties allow you to customize the informational pop-ups in the Decomposition chart. Here are some key properties you can adjust:
Show Tooltip: Toggle this option to display or hide the tooltip.
Background Color: Set the tooltip background color for better visibility and aesthetic alignment.
Opacity: Adjust the transparency level of the tooltip background.
Border Color: Define the color of the tooltip border for better distinction.
Tooltip Font Size: Specify the font size for the text inside the tooltip for readability.
Box Width: Control the width of the tooltip box to accommodate the content.
Precision: Set the number of decimal places for numerical data displayed in the tooltip.
Highlighter: Add emphasis to specific data points in the tooltip using the highlighter feature.

The Tooltip appears for the chart as shown below:

Title
Title Box Color: Choose the background color for the title box.
Show Title Box: Enable or disable the display of the title box on the chart.
Show Title: Enable or disable the display of the title text.
Title Bar Height: Specify the height of the title bar area.
Description: Add a description text below the title.
Font Color: Select the color of the title text.
Font Size: Specify the size of the title text.
Font Style: Choose a font style (e.g., italic or normal).
Font Weight: Set the weight (boldness) of the font. The supported options are Normal, Bold, 300, 600, and 900.
Font Family: Choose the font family for the title text from the given choices.
Align: Align the title text (e.g., left, center, right).
Text Decoration: Apply text decorations (e.g., underline) to the title text.
Show Dataset Description: Enable or disable the dataset description in the title.

Please Note: By enabling the Show Dataset Description option the Title will get added from the mapped dataset.
Subtitle
Show Subtitle: Enable or disable the display of the subtitle in the chart.
Description: Add descriptive text or additional information below the subtitle.
Font Color: Select the color for the subtitle text.
Font Size: Specify the size of the subtitle text.
Font Style: Choose a font style for the subtitle, such as italic or normal.
Font Weight: Set the weight (boldness) of the subtitle font. Options include Normal, Bold, 300, 600, and 900.
Font Family: Choose the font family for the subtitle text from the available options.
Align: Align the subtitle text to the left, center, or right.
Text Decoration: Apply decorations like underlining to the subtitle text.

Formatter
Use the Formatter property fields to format the default Decomposition.
Formatter Properties
The Formatter properties allow customization of the chart's appearance through various field options:
Unit: Specify the measurement unit (e.g., percentage, currency) for the data values.
Precision: Define the number of decimal places to display, ensuring values are presented with the desired level of detail.
Currency: Designate a currency format for monetary values, allowing for consistent representation in financial data.
Position: Set the placement of labels or annotations on the chart for optimal readability and presentation.
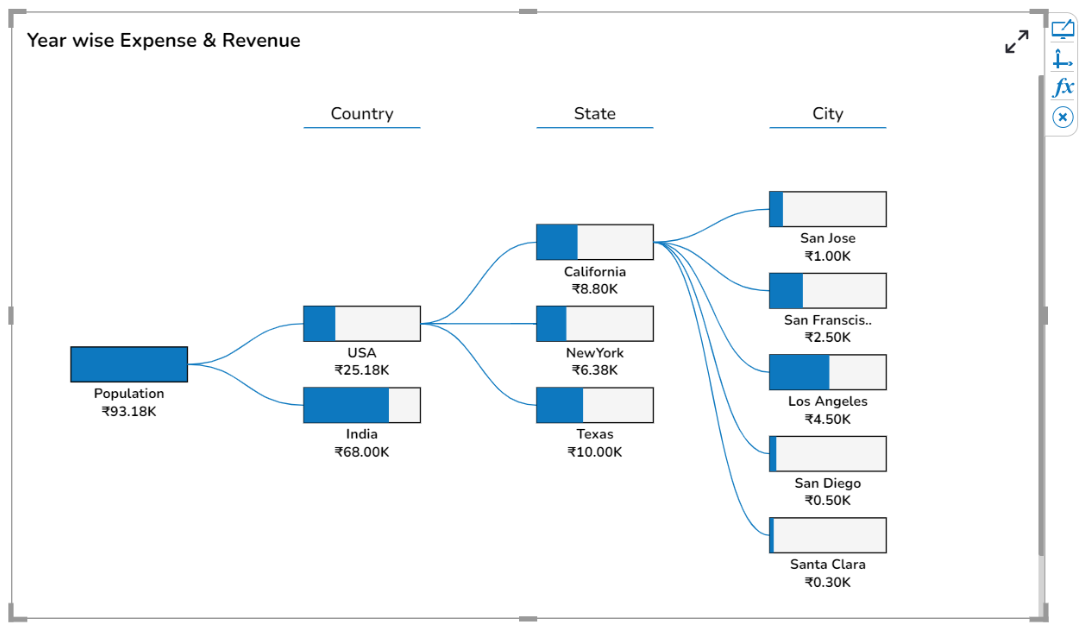
Number Formatter: Apply specific number formatting rules selecting from Indian or International.

The default chart gets formatted as shown below:
Applying Some Key General Properties
Enable Context Levels
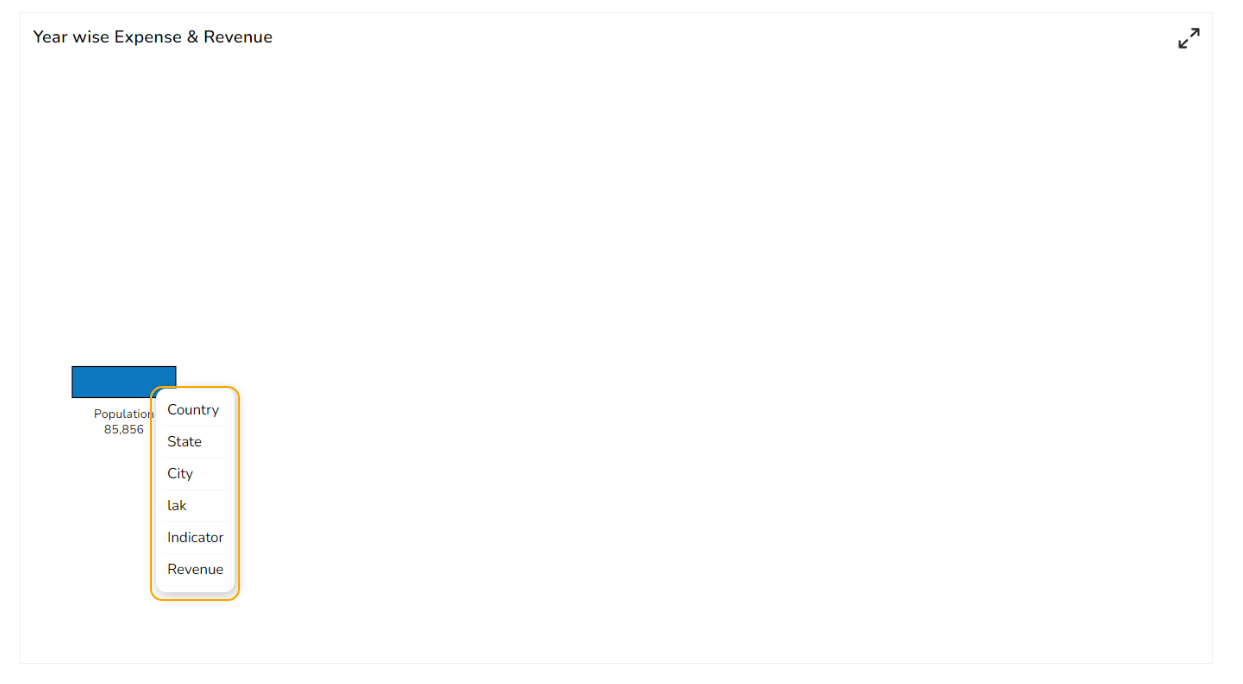
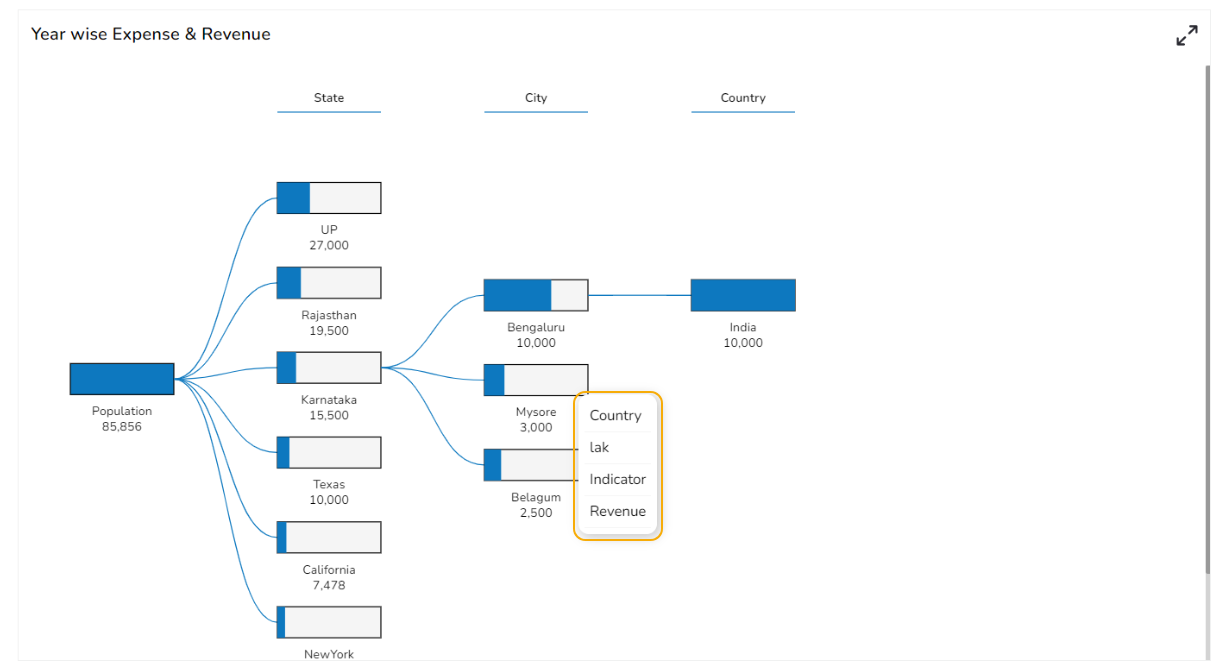
Select the Enable Context Levels field using a checkmark in the checkbox. Users can select the next hierarchy levels as required.
Use a right-click on the node to select the next level.
Use a checkmark for the Enable Show percentage field. Users can identify the Node percentage.
Aggregation Type
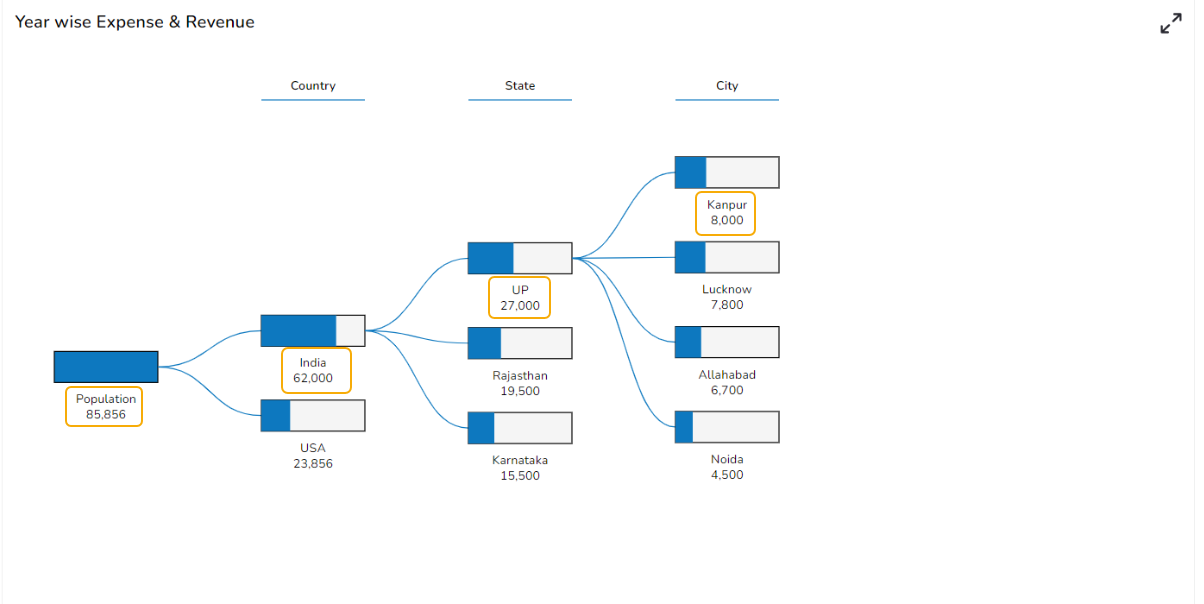
The Aggregation type property displays the value of the node based on the selected aggregation.
When the selected aggregation type is sum.
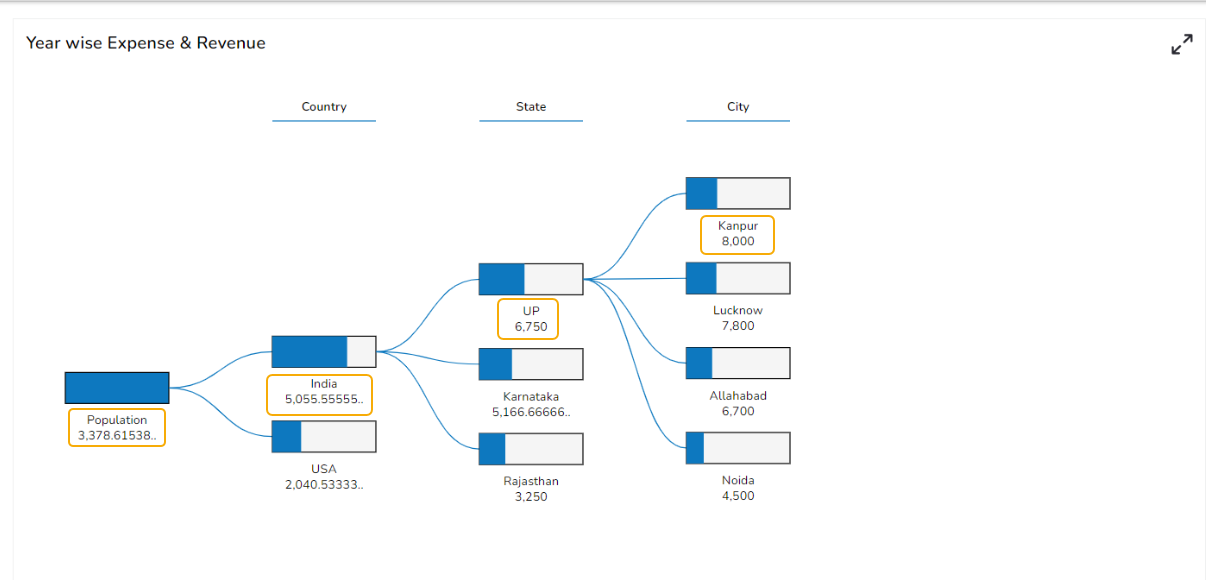
When the selected aggregation type is Mean.
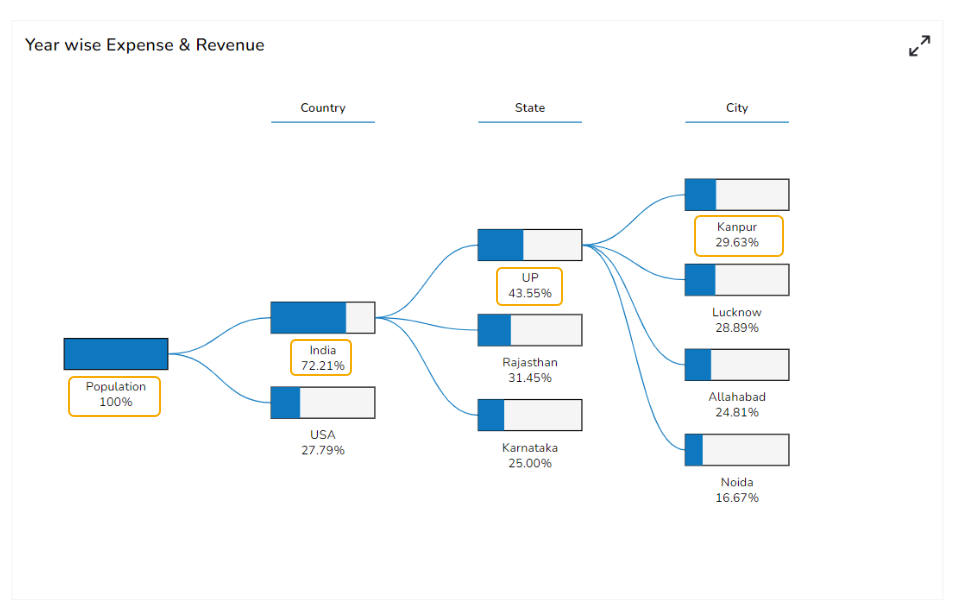
When the selected aggregation type is Percentage.
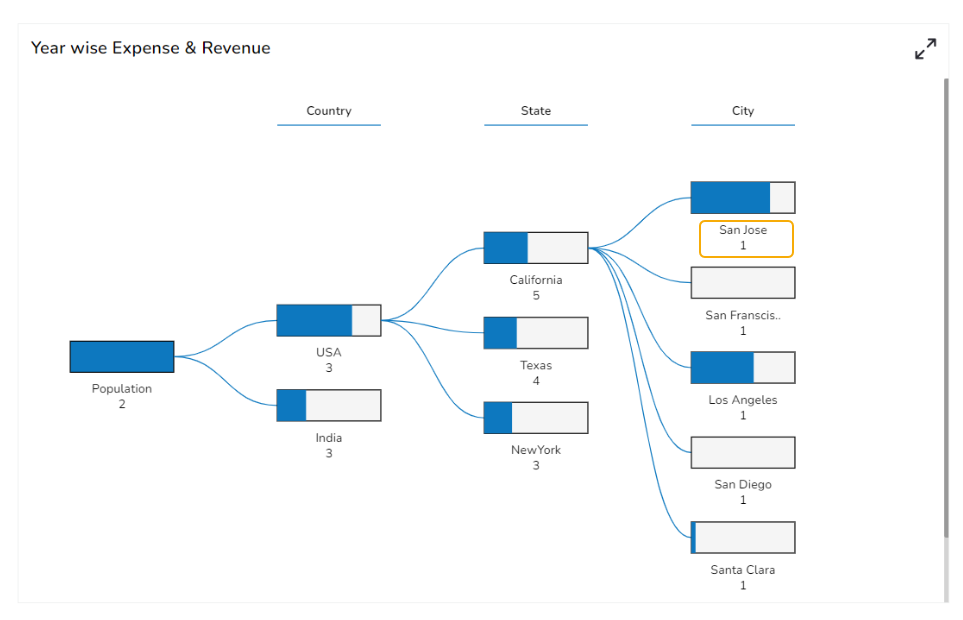
When the selected aggregation type is Count.
Maximum Nodes
Another property called Maximum Nodes has been provided to control the number of nodes in each hierarchy.
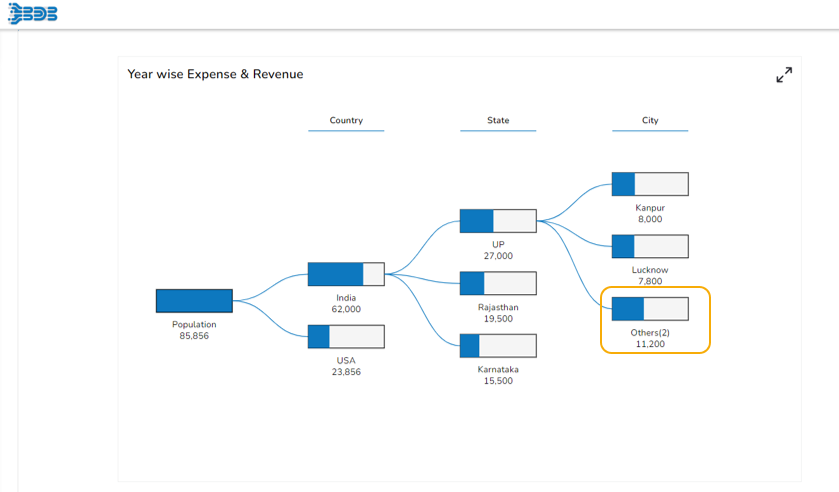
The set value for the Maximum Node field is 10 so if a particular node contains more than 10 children nodes, only 9 children nodes with comparatively more values get displayed as visible nodes, and the remaining children nodes with less value are shown as others.
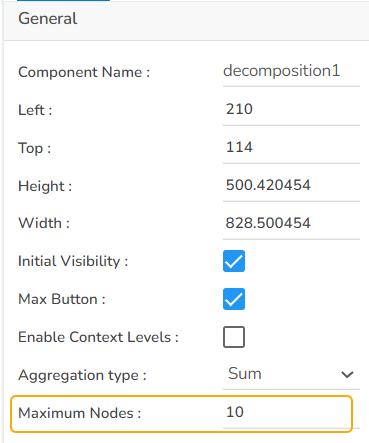
E.g., In the given Decomposition chart the Maximum Nodes are set as 3
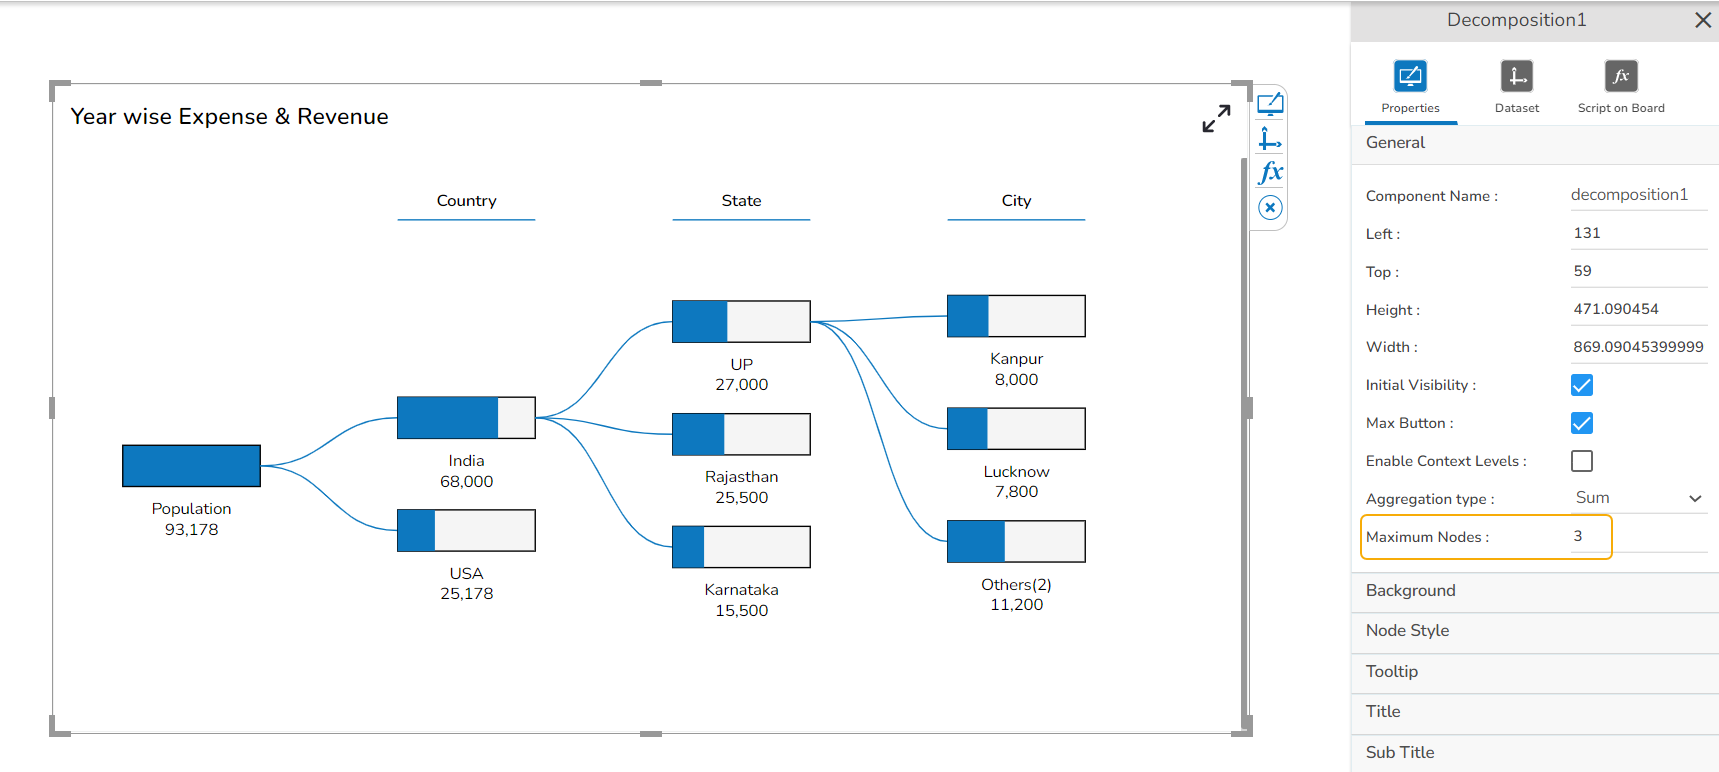
The number of Maximum Nodes gets limited to 3 and the nodes with fewer values get clubbed as Others as displayed in the image:
Adding Conditional Colors
Users can provide conditional colors using the Indicators tab from the Dataset mapping panel for a charting component.
Open the Dataset panel.
Select a dragged category field.
Navigate to the Indicator tab for the same.
Click the Add new condition icon using the Conditions option.
The Conditional Color dialog window opens.
Select a color for the field.
Click the Create option.

The newly created condition will be added under the Conditions option.

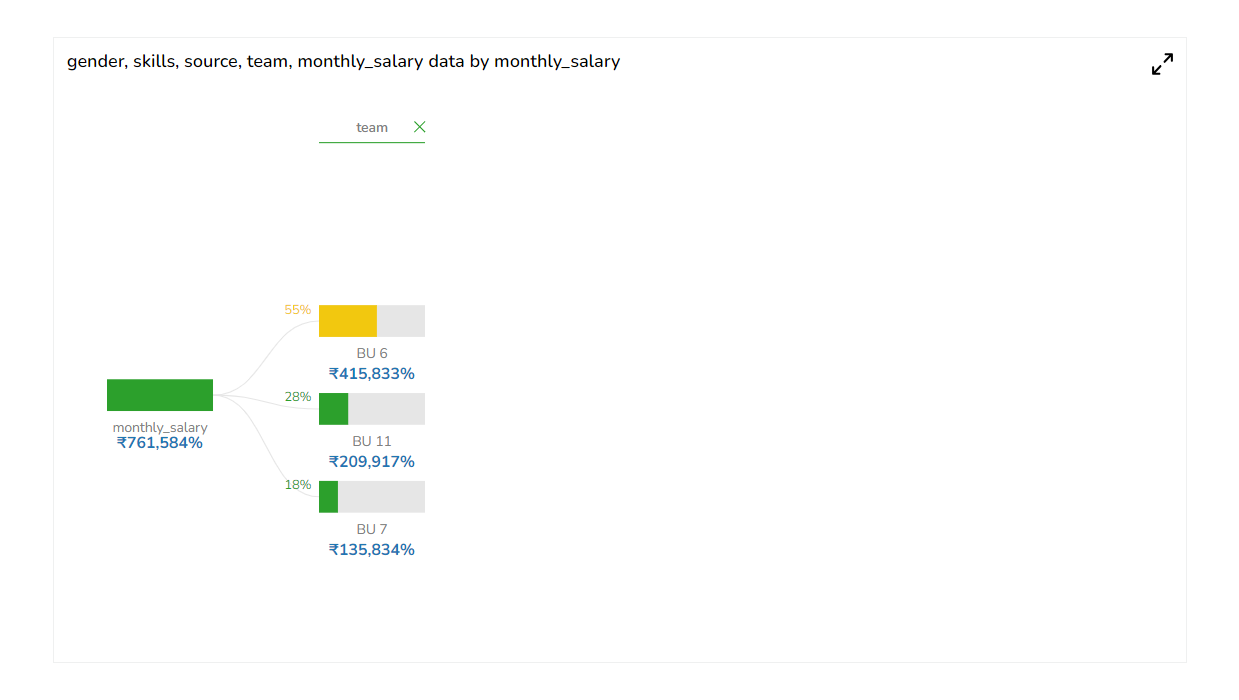
Closing Hierarchy
Provide an option to close a particular hierarchy from the header when the Context Level is enabled.
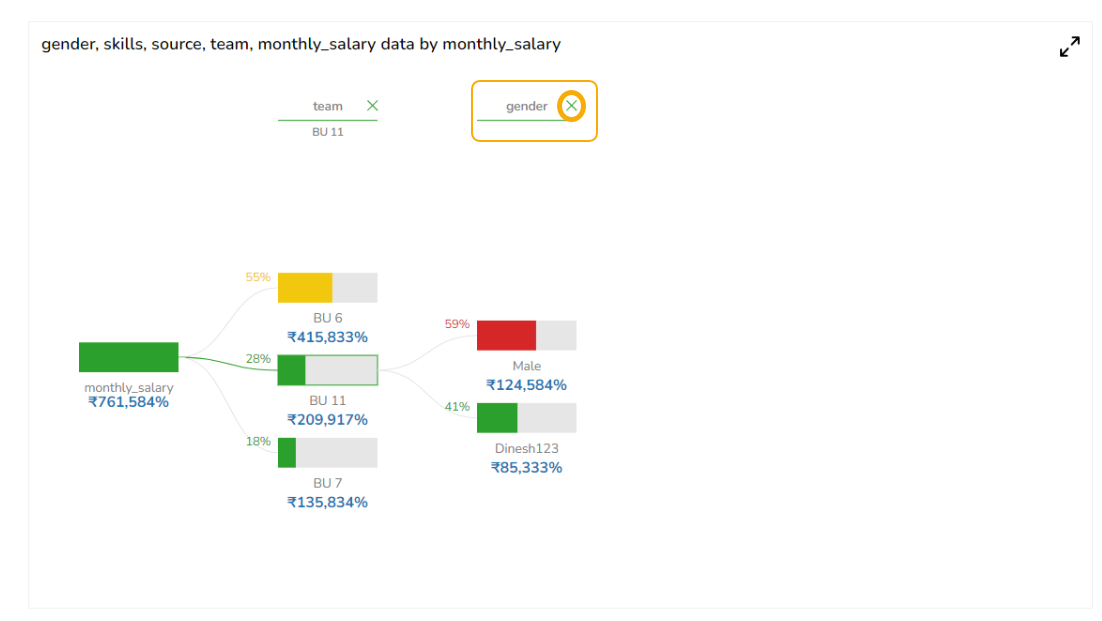
The selected hierarchy gets closed.
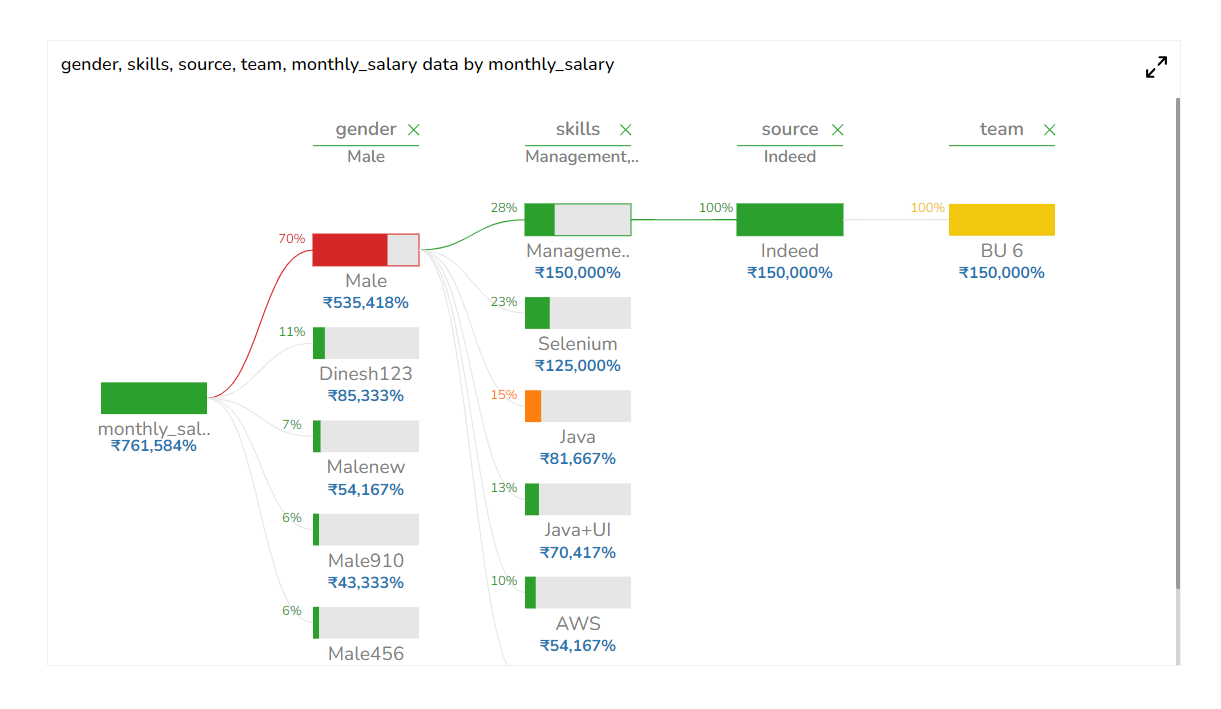
The Decomposition chart can highlight the selected node of each hierarchy and display the selected node name below the hierarchy text.
The user gets a loader while expanding the nodes for a category.
Check out the illustration of how a loader appears in the preview of a Decomposition chart.
Sample Data
Download the given sample data and map it as mentioned below to plot your Decomposition chart.
Select the Population column as Series, and the other columns as Category.
Last updated