MongoDB Reader Lite (PyMongo Reader)
A MongoDB reader component is designed to read and access data stored in a MongoDB database. Mongo readers typically authenticate with MongoDB using a username and password or other authentication mechanisms supported by MongoDB.
This page covers the configuration steps for the Mongo DB Reader.All component configurations are classified broadly into the following sections:
Meta Information
MongoDB Reader reads data from the specified database’s Collection. It also has an option to filter the data using Mongo Query Language(MQL), Which will run the MQL directly on the MongoDB Server, and push the data to the out event.
Check out the below-given walk through about the MongoDB Reader Lite.
Accessing the Component Properties
Drag & drop the Mongo Reader component to the Workflow Editor.
Click on the dragged reader component.
The component properties tabs open below.
Basic Information
It is the default tab to open for the Mongodb Reader Lite while configuring the component.
Select an Invocation Type from the drop-down menu to confirm the running mode of the reader component. Select Real-Time or Batch from the drop-down menu.
Deployment Type: It displays the deployment type for the component (This field comes pre-selected).
Container Image Version: It displays the image version for the docker container (This field comes pre-selected).
Failover Event: Select a failover Event from the drop-down menu.
Batch Size (min 10): Provide the maximum number of records to be processed in one execution cycle (Min limit for this field is 10).
Please Note: The Grace Period Field appears when the Batch is selected as the Invocation Type option in the Basic Information tab. You can now give a grace period for components to go down gracefully after that time by configuring this field.

Grace Period Field
The Grace Period field appears when the Batch option is selected as the Invocation Type. You can now give a grace period for components to go down gracefully after that time by configuring the given field in the Basic Information of the concerned component.

Meta Information
Open the Meta Information tab and fill in all the connection-specific details of MongoDB Reader Lite. The Meta Information tab opens with the below given fields:

Please Note: The Meta Information fields may vary based on the selected Connection Type option.
Configuring the over all Meta Information tab fields
Please Note: The fields marked as (*) are mandatory fields.
Connection Type: Select either of the options out of Standard, SRV, and Connection String as connection types.
Port number (*): Provide the Port number (It appears only with the Standard connection type).
Host IP Address (*): The IP address of the host.
Username (*): Provide a username.
Password (*): Provide a valid password to access the MongoDB.
Database Name (*): Provide the name of the database where you wish to write data.
Collection Name (*): Provide the name of the collection.
Fetch size: Specifies the number of documents to return in each batch of the response from the MongoDB collection. For ex: If 1000 is given in the fetch size field. Then it will read the 1000 data at one execution and it will process it further.
Additional Parameters: Provide details of the additional parameters.
Enable SSL: Check this box to enable SSL for this components. MongoDB connection credentials will be different if this option is enabled.
The user needs to upload the following files on the certificate upload page:
Certificate file (.pem format)]
Key file (.key format)
Certificate Folder: This option will appear when the Enable SSL field is checked-in. The user has to select the certificate folder from drop down which contains the files which has been uploaded to the admin settings for connecting MongoDB with SSL. Please refer the below given images for the reference.
Connection String (*): Provide a connection string (It appears only with the Connection String connection type).
Query: Provide a relevant query service. We can write the Mongo queries in the following manner:
Variations in the Meta Information tab fields


Meta Information Tab with enabled the "Enable SSL" field:

Saving the Reader Component
After configuring the required configuration fields, click the Save Component in Storage icon provided in the reader configuration panel to save the component.

A confirmation message appears to notify the component properties are saved.
Updating and Activating Pipeline
Click on the Update Pipeline icon to update the pipeline.
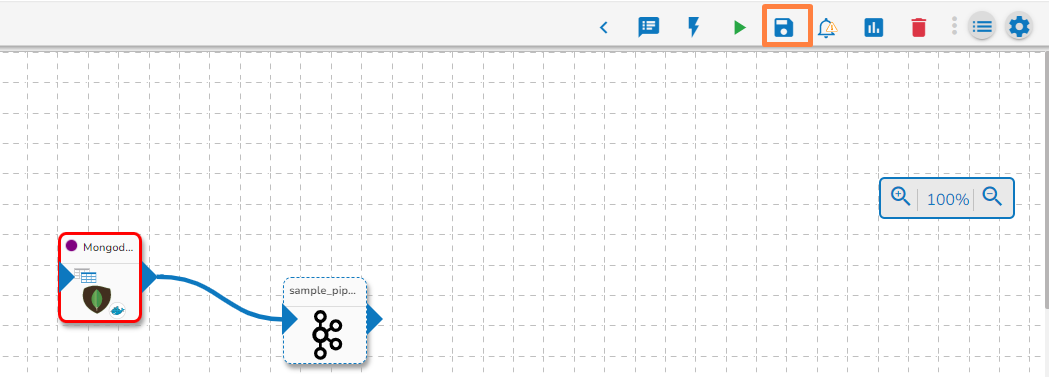
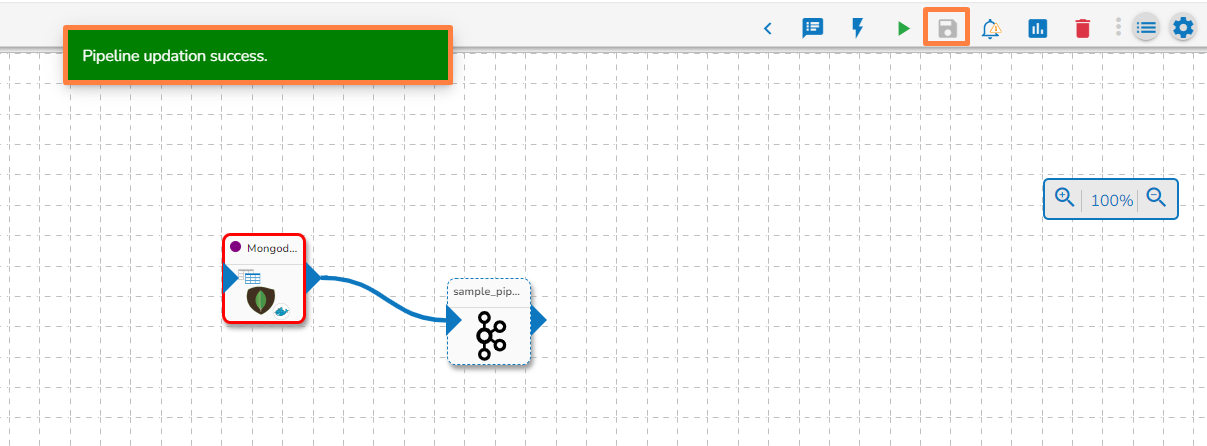
A confirmation message appears to inform the user.
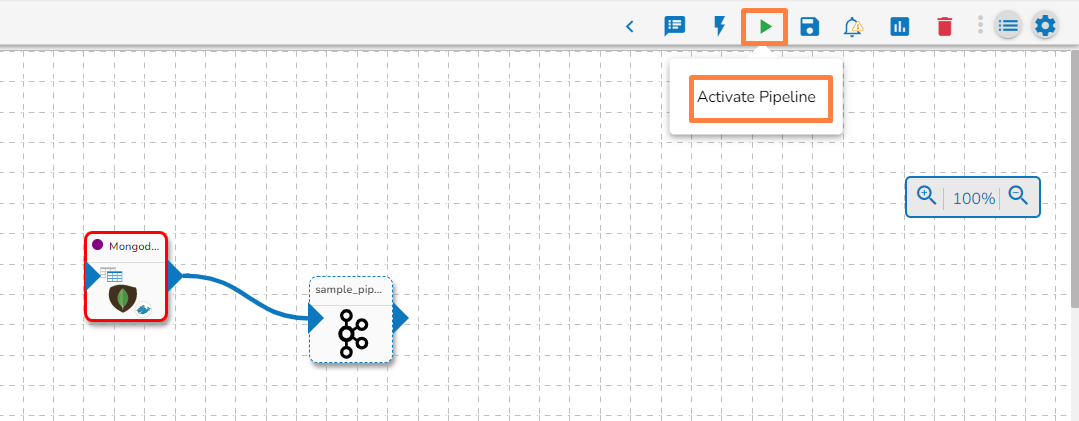
Click on the Activate Pipeline icon.
The Confirm dialog box appears to ask the user permission.
Click the YES option.

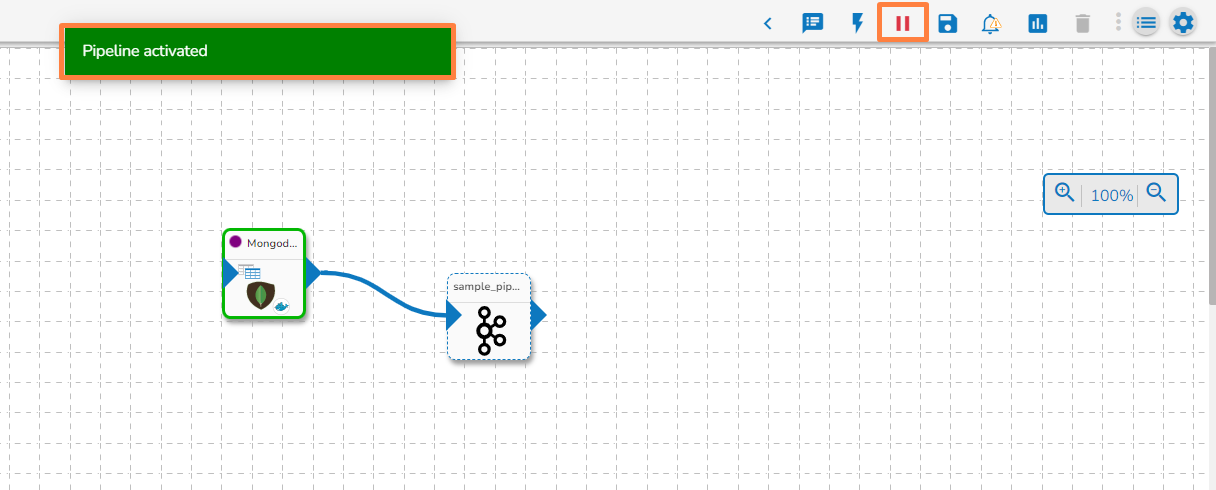
A confirmation message appears to inform that the pipeline has been activated.
Accessing the Log Panel
Click on the Toggle Log Panel icon.
The Log Panel opens displaying the Logs and Advance Logs tabs.

Please Note:
The Pod logs for the components appears in the Advanced Logs tab.
The overall component logs will be displayed in the Logs tab.
Tabs for a Configured Component
A configured component will display some more tabs such as the Configuration, Logs, and Pod Logs tabs (as displayed below for the Mongodb Reader Lite component).

Configuration Tab

Logs Tab

Pod Logs Tab

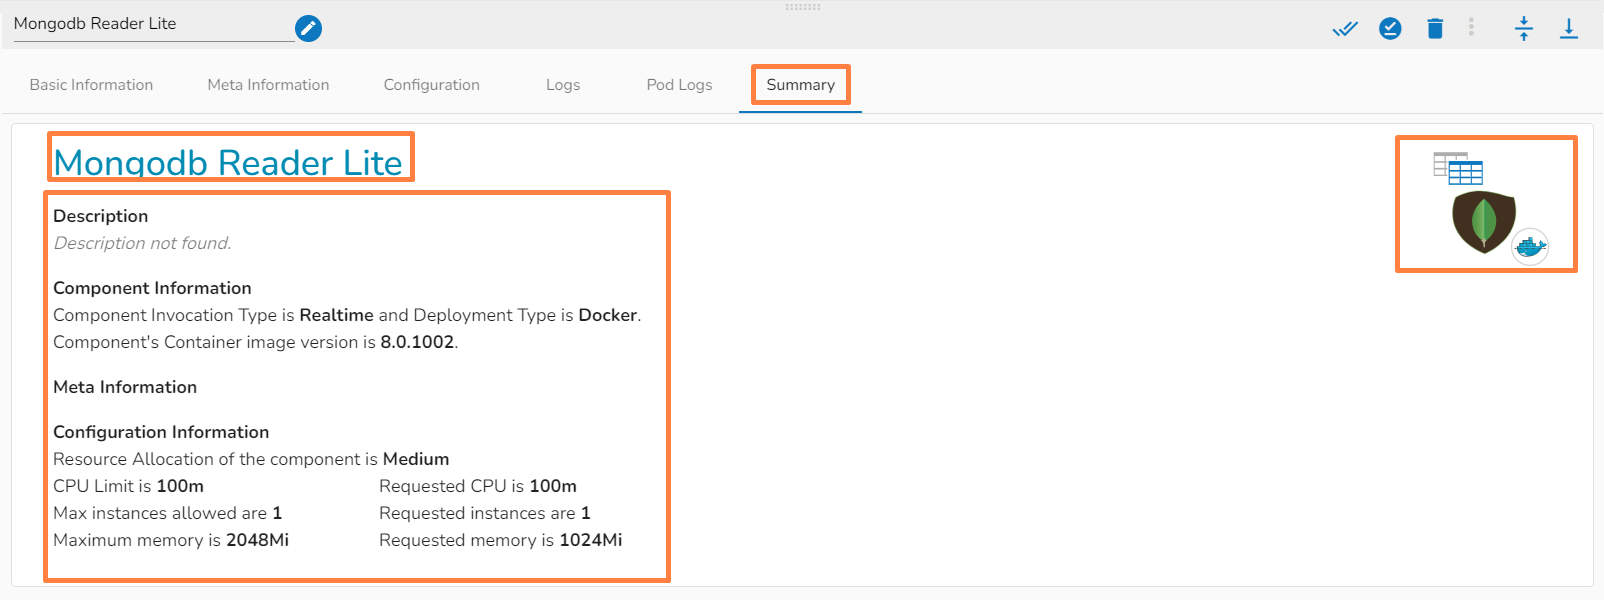
Summary Tab
This tab will show all the description about the component.
