
Model Explainer
The user can explore the Data Science Lab models using the Explainer dashboard with multiple charts that aim to explain the model specifications.
Please Note:
Only Sklearn models will be supported in the latest version.
Training dataset type for Data Science Lab models should be: NumPy Array, Pandas Dataframe or Python List.
Navigate to the Notebook tab.
Open an existing Notebook or Create new Notebook.
Write a code to create a model.
Run the code.

Insert a new code cell below.
Click the Save Model option for this newly added cell.

A pre-defined code gets generated in the code cell to save the model.
Save the Data Science Model by defining modelName, modelType, specifying the X, y and estimator_type.
Run the Cell after defining the required information.

Open the Models tab option.
Click the Ellipsis icon provided for a model.
Click the Model Explainer option.

The Model Explainer page opens explaining the selected Data Science Lab model. The selected model in this case is of Regression type, so the Model Explainer displays Regression Explainer.
This page displays the various tabs to explain the model.
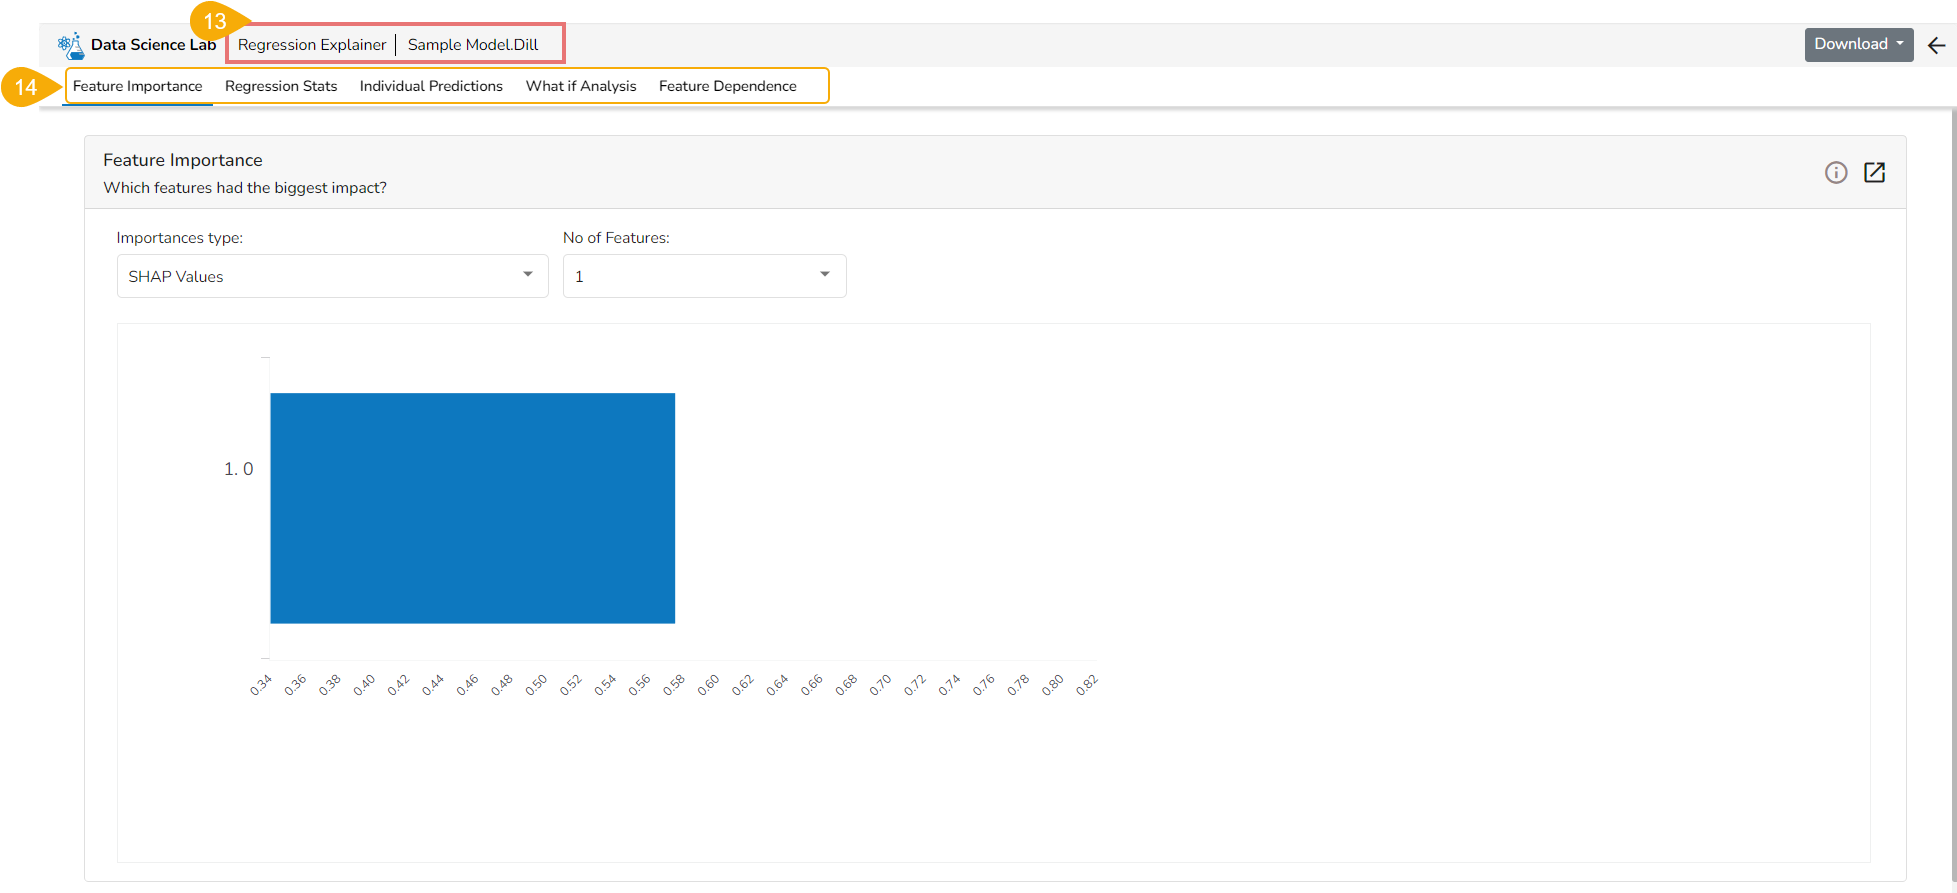
The Feature Importance tab opens by default.
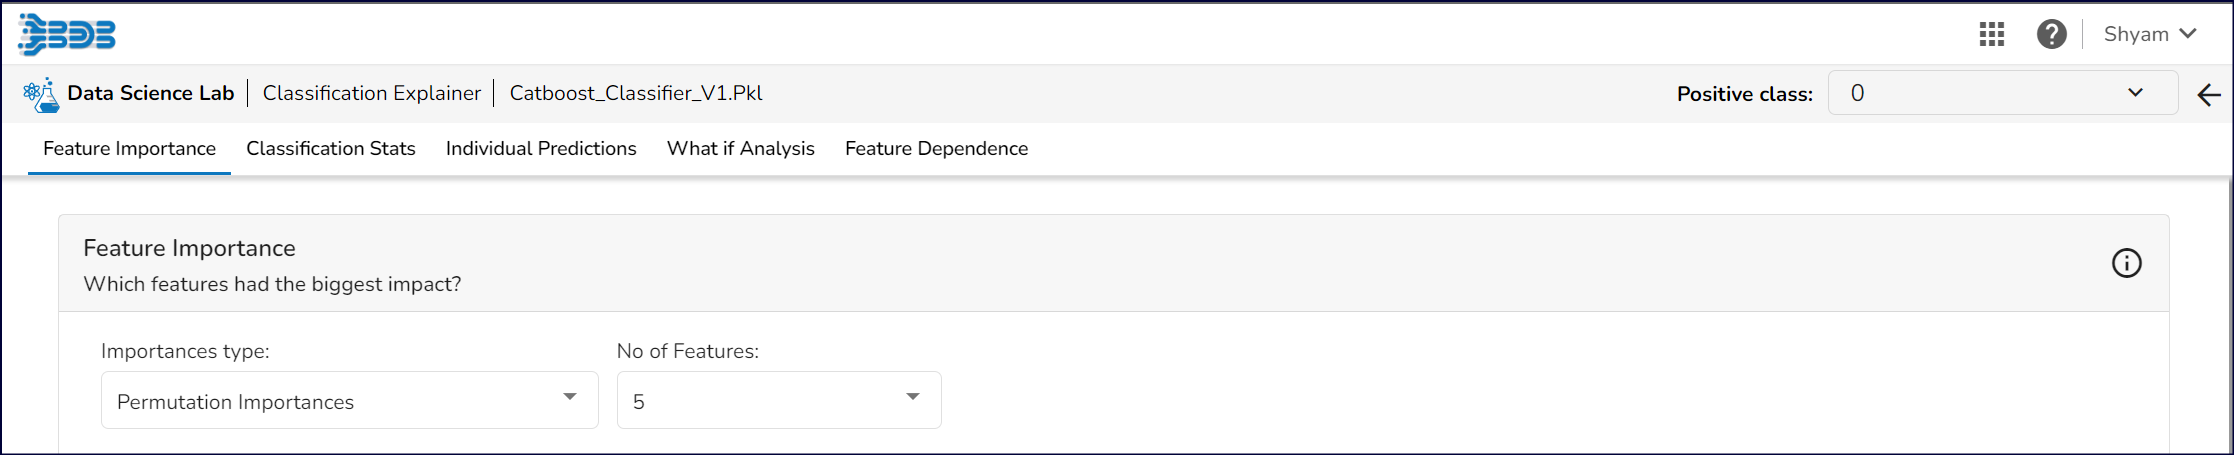
Classification Explainer
Feature Importance
This table shows the contribution each feature has had on the prediction for a specific observation. The contributions (starting from the population average) add up to the final prediction. This allows you to explain exactly how each prediction has been built up from all the individual ingredients in the model.
Individual Predictions
Select Index: The user can select a record directly by choosing it from the dropdown or hit the Random Index option to randomly select a record that fits the constraints. For example, the user can select a record where the observed target value is negative but the predicted probability of the target being positive is very high. This allows the user to sample only false positives or only false negatives.
Prediction: It displays the predicted probability for each target label.
Contributions Plot: This plot shows the contribution that each feature has provided to the prediction for a specific observation. The contributions (starting from the population average) add up to the final prediction. This helps to explain exactly how each prediction has been built up from all the individual ingredients in the model.
Partial Dependence Plot: The PDP plot shows how the model prediction would change if you change one particular feature. the plot shows you a sample of observations and how these observations would change with this feature (gridlines). The average effect is shown in grey. The effect of changing the feature for a single record is shown in blue. The user can adjust how many observations to sample for the average, how many gridlines to show, and how many points along the x-axis to calculate model predictions for (grid points).
Individual Predictions
This table shows the contribution each feature has had on the prediction for a specific observation. The contributions (starting from the population average) add up to the final prediction. This allows you to explain exactly how each prediction has been built up from all the individual ingredients in the model.
Feature Dependence
Shap Summary: The Shap Summary summarizes the Shap values per feature. The user can either select an aggregate display that shows the mean absolute Shap value per feature or get a more detailed look at the spread of Shap values per feature and how they co-relate the feature value (red is high).
Shap Dependence: This plot displays the relation between feature values and Shap values. This allows you to investigate the general relationship between feature value and impact on the prediction. The users can check whether the model uses features in line with their intuitions, or use the plots to learn about the relationships that the model has learned between the input features and the predicted outcome.
Regression Explainer
Model Summary: The user can find a number of regression performance metrics in this table that describes how well the model is able to predict the target column.
Predicted Vs Actual Plots: This plot shows the observed value of the target column and the predicted value of the target column. A perfect model would have all the points on the diagonal (predicted matches observed). The further away points are from the diagonal the worse the model is in predicting the target column.
Residuals & Plot Vs Features
Residuals: The residuals are the difference between the observed target column value and the predicted target column value. in this plot, one can check if the residuals are higher or lower for higher /lower actual /predicted outcomes. So, one can check if the model works better or worse for different target value levels.
Plot vs Features: This plot displays either residuals (difference between observed target value and predicted target value) plotted against the values of different features or the observed or predicted target value. This allows one to inspect whether the model is more inappropriate for a particular range of feature values than others.
Forecasting Explainer
The forecasting model stats get displayed through the Timeseries visualization that presents values generated based on the selected time.
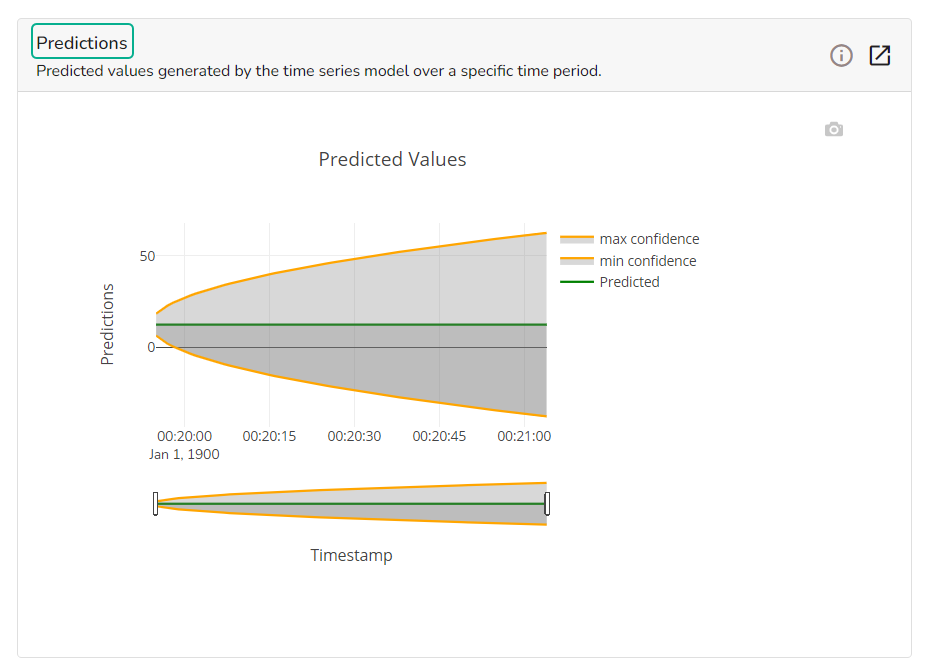
Predictions
This chart will display predicted values generated by the timeseries model over a specific time period.
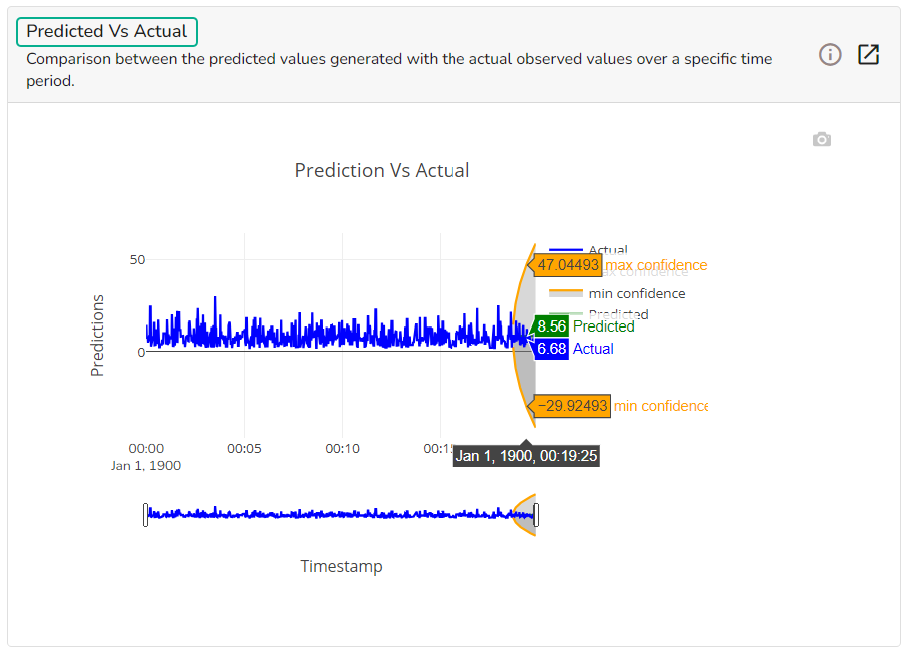
Predicted Vs Actual
This chart displays a comparison of the predicted values with the actual obsereved vlaues over a specific period of time.
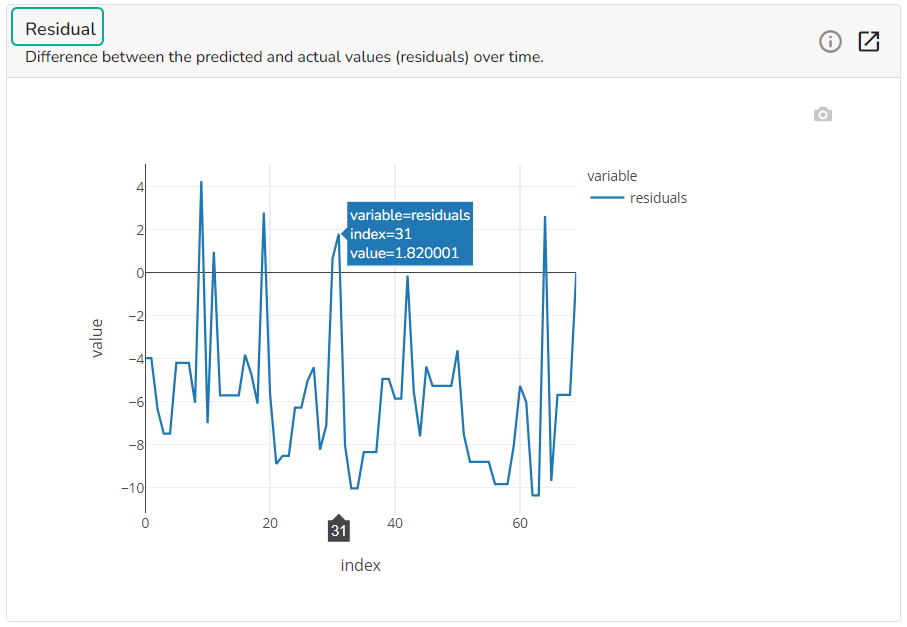
Residual
It depicts difference between the predicted and actual (residuals) values over a period of time.
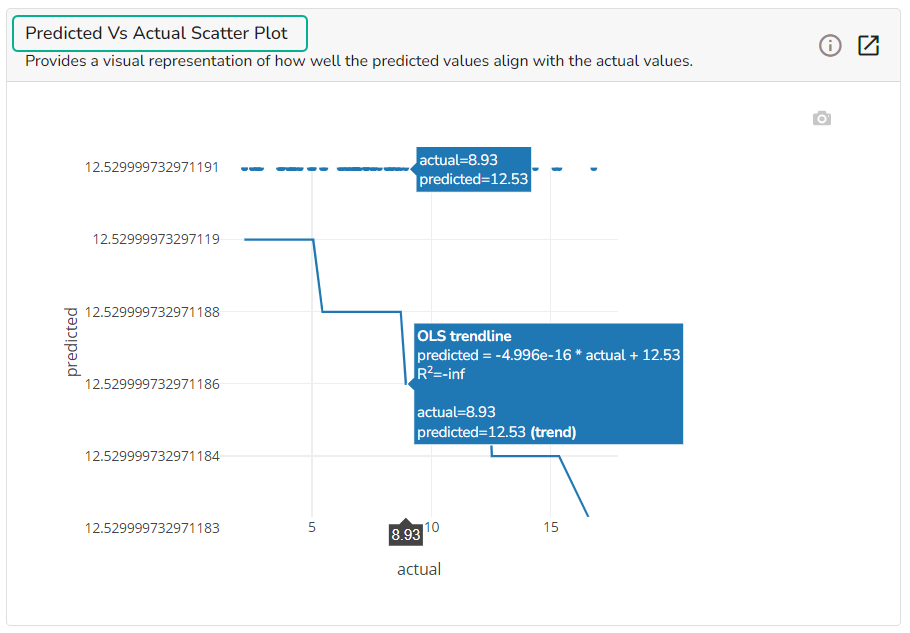
Predicted Vs Actual Scatter Plot
A Scatter Plot chart is displayed depicting how well the predicted values align with the actual values.
Please Note:
The Regression Stats tab only differs from the Classification Stats Tab, All the other Tabs of the model explainer dashboard remain the same as those given for the Classification Model.
Refer the Data Science Lab Quick Start Flow page to get an overview of the Data Science Lab module in nutshell.
Last updated