
Pipeline Monitoring
This Page explains How we can monitor the Pipelines.
The user can monitor a pipeline together with all the components associated with the same by using the Pipeline Monitoring icon. The user gets information about Pipeline components, Status, Types, Last Activated (Date and Time), Last Deactivated (Date and Time), Total Allocated and Consumed CPU%, Total allocated and consumed memory, Number of Records, and Component logs all displayed on the same page.
Go through the below-given video to get a basic idea on the pipeline monitoring functionality.
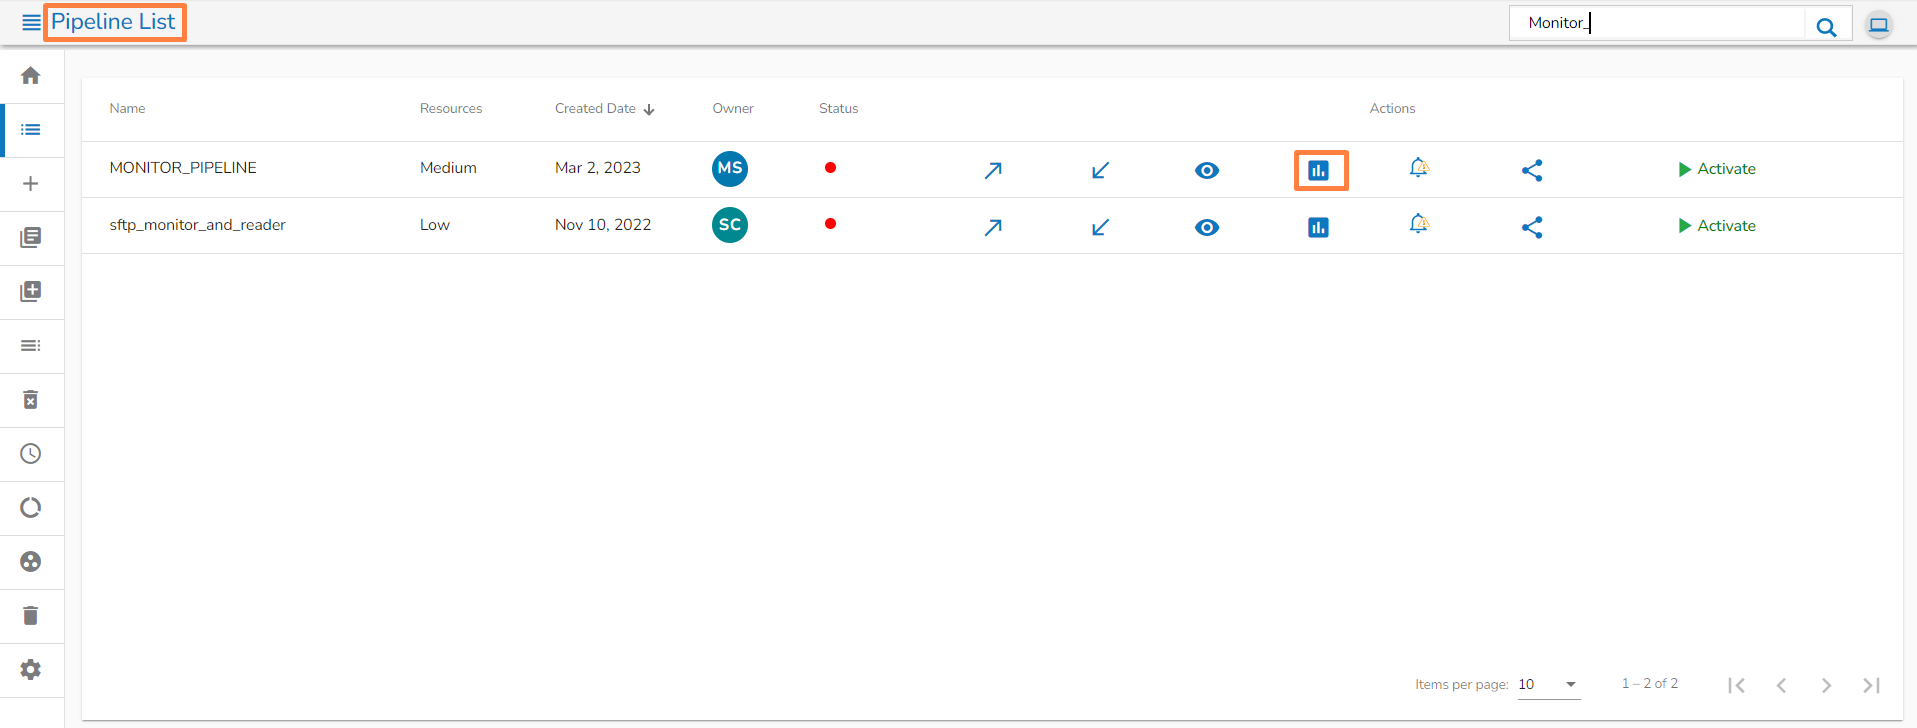
Navigate to the Pipeline List page.
Click the Monitor icon.
Or
Navigate to the Pipeline Workflow Editor page.
Click the Pipeline Monitoring icon on the Header panel.

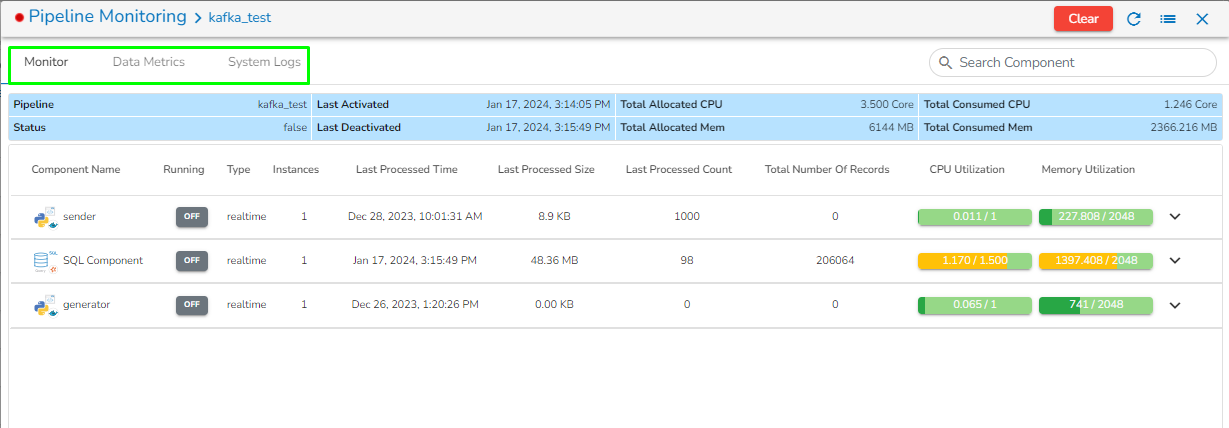
The Pipeline Monitoring page opens displaying the details of the selected pipeline.
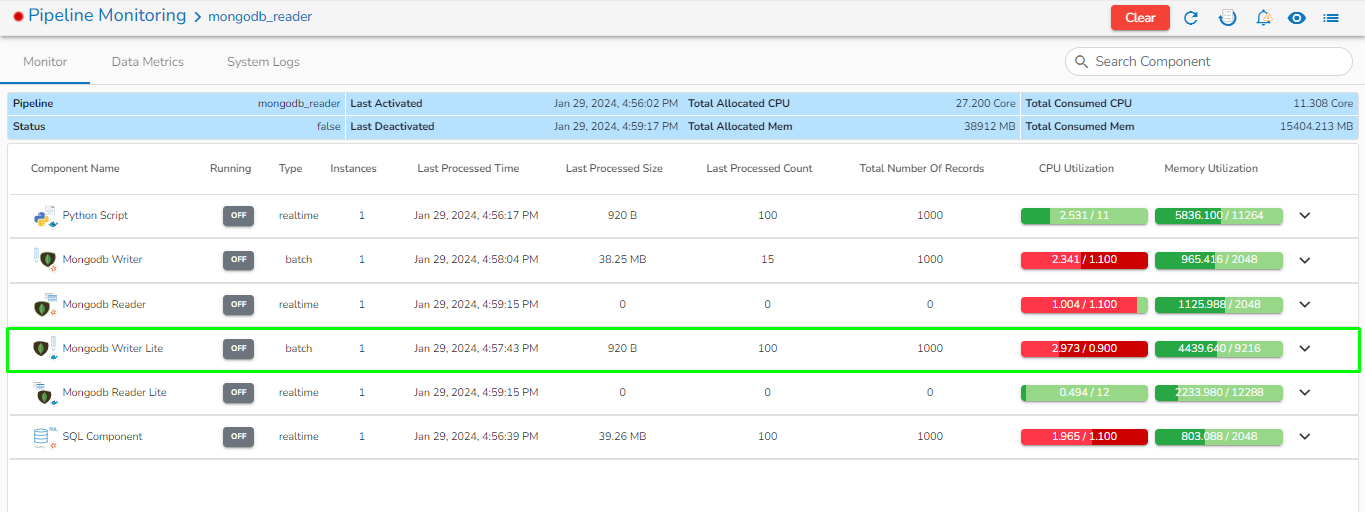
The Pipeline Monitoring page displays the following information for the selected Job:
Pipeline: Name of the pipeline.
Status: Running status of the Job. 'True' indicates the Job is active, while 'False' indicates inactivity.
Last Activated: Date and time when the job was last activated.
Last Deactivated: Date and time when the pipeline was last deactivated.
Total Allocated CPU: Total allocated CPU in cores.
Total Allocated Memory: Total allocated memory in MB.
Total Consumed CPU: Total consumed CPU by the pipeline in cores.
Total Consumed Memory: Total consumed memory by the pipeline in MB.
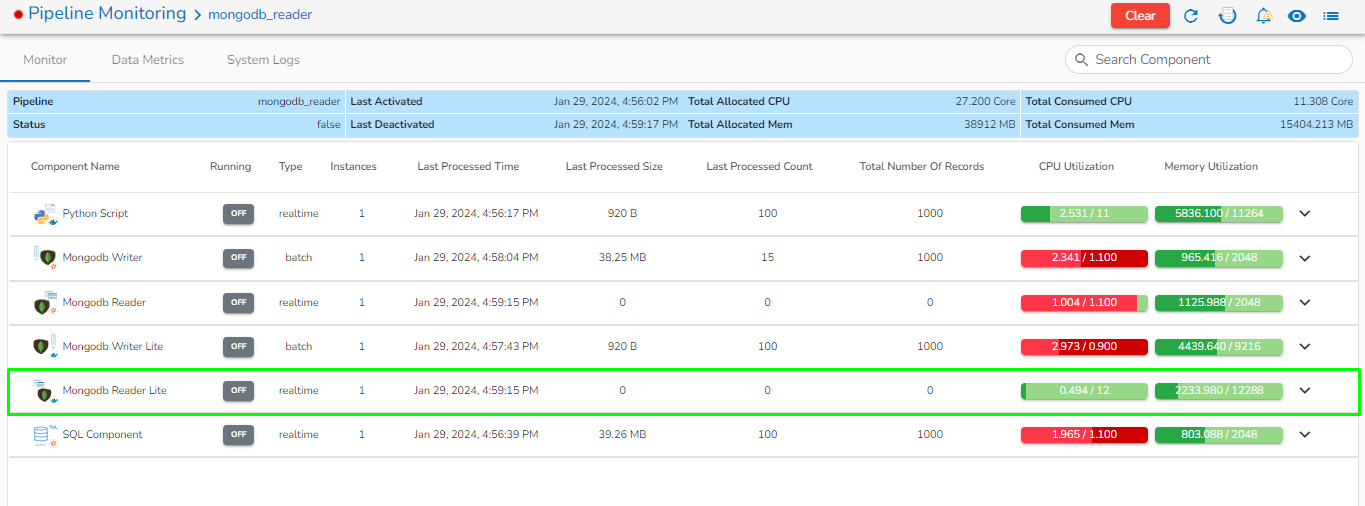
Component Name: Name of the component which is used in pipeline.
Running: The running status of the component, displayed as 'UP' if the component is running, otherwise 'OFF'.
Type: Invocation type of component. It may be either Real Time or Batch.
Instances: Number of instances used in the component.
Last Processed Size: Size of the batch (in MB) that was last processed.
Last Processed Count: Number of Processed records in last batch.
Total Number of Records: Total number of records processed by the component.
Last Processed Time: Last processed time of the instance.
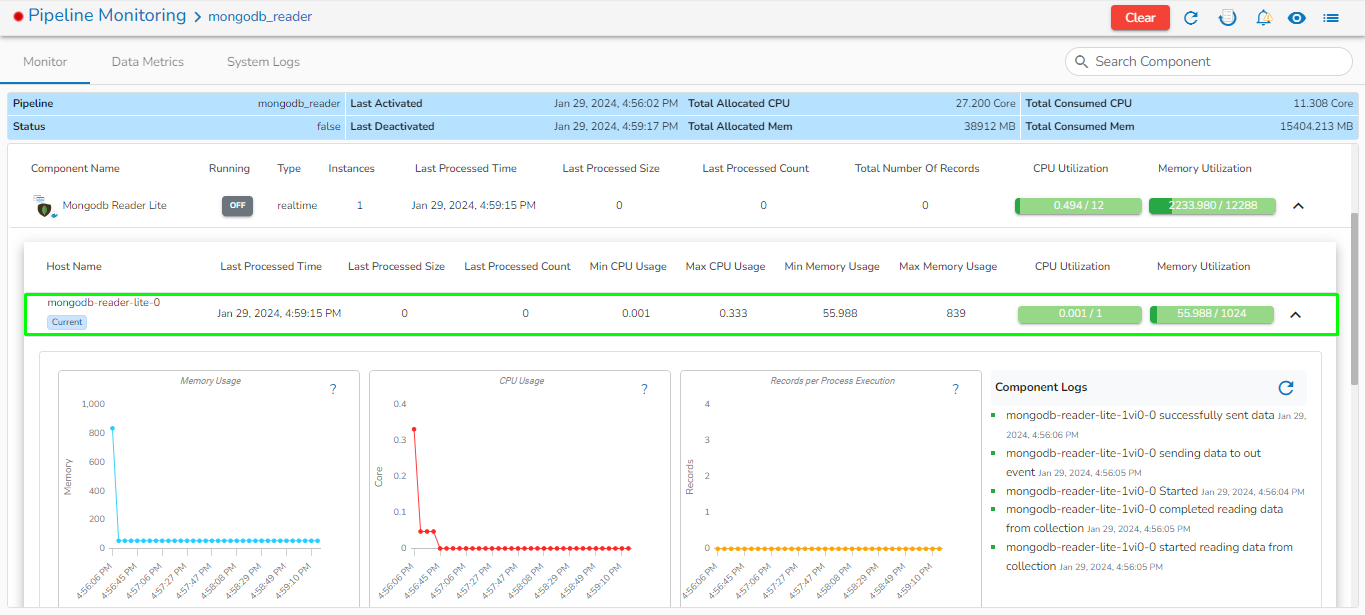
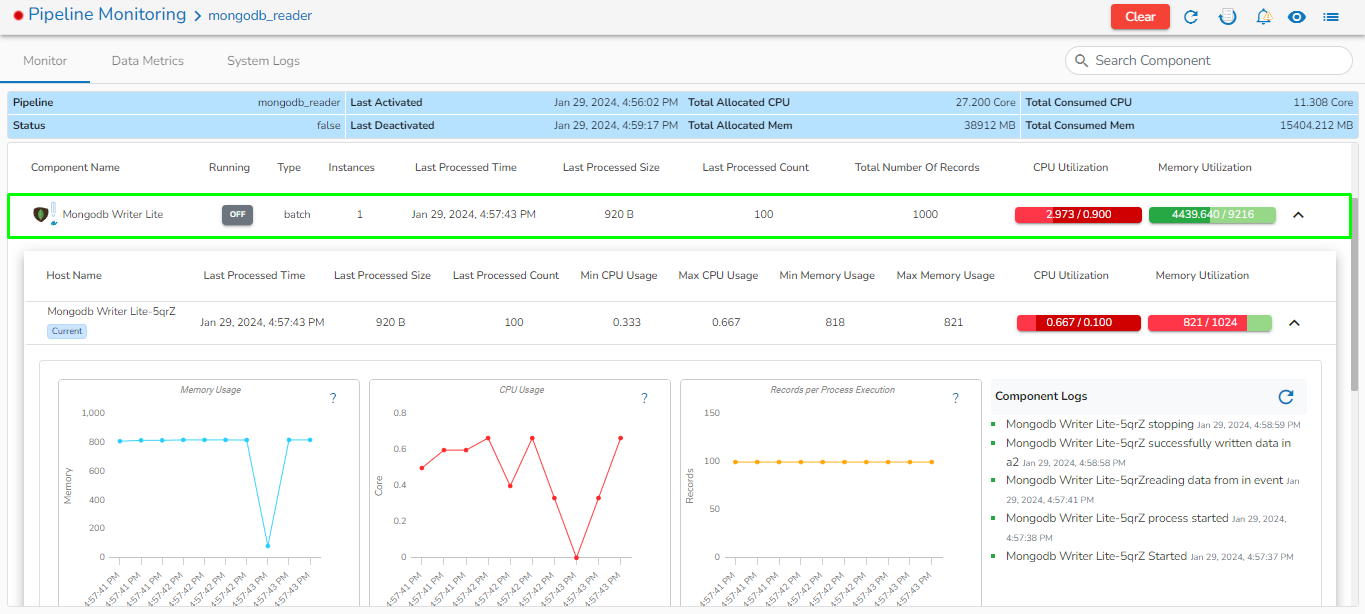
Host Name: Name of the instance of the selected component.
Min CPU Usage: Minimum CPU usage in cores by the instance.
Max CPU Usage: Maximum CPU usage in cores by the instance.
Min Memory Usage: Minimum memory usage in MB by the instance.
Max Memory Usage: Maximum memory usage in MB by the instance.
CPU Utilization: Total CPU utilization in cores by the instance.
Memory Utilization: Total memory utilization in MB by the instance.
There will be three tabs in the monitoring page.
Monitor: In this tab, it will display information such as the resources allocated, minimum/maximum resource consumption, instances provisioned, the number of records processed by each component, and their running status.
Data Metrics: Data Metrics will show the number of consumed records, processed records, failed records, and the corresponding failed percentage over a selected time window
System Logs: In this tab, the user can see the pod logs of every component in the pipeline.
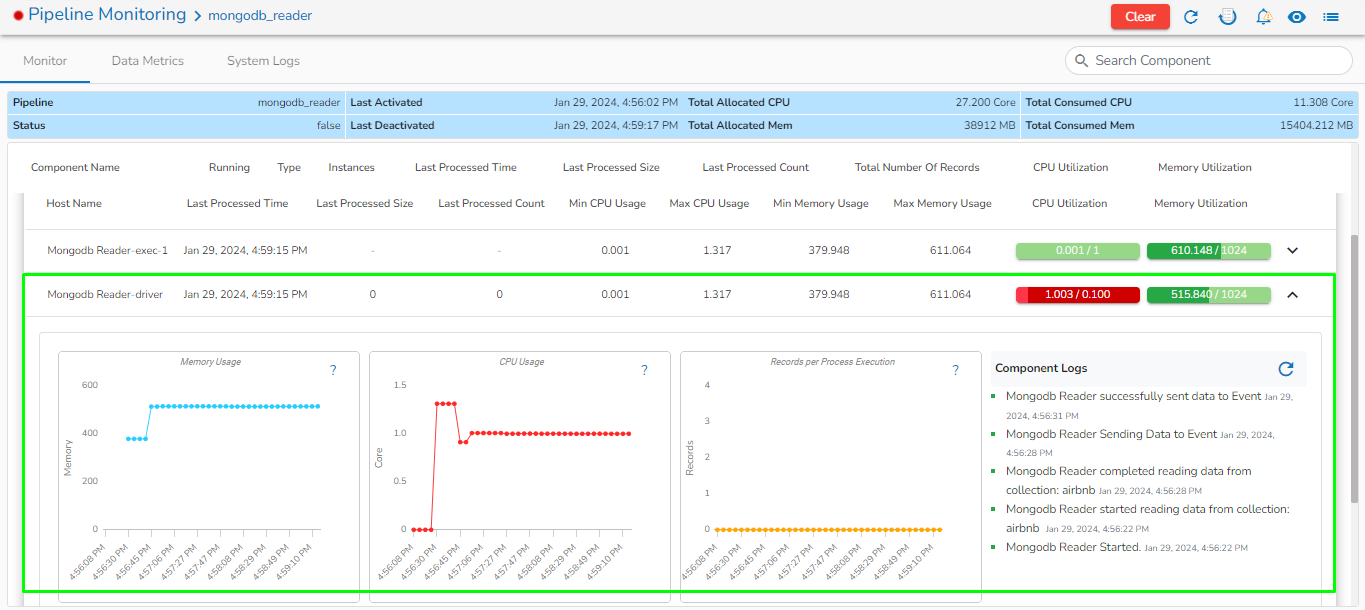
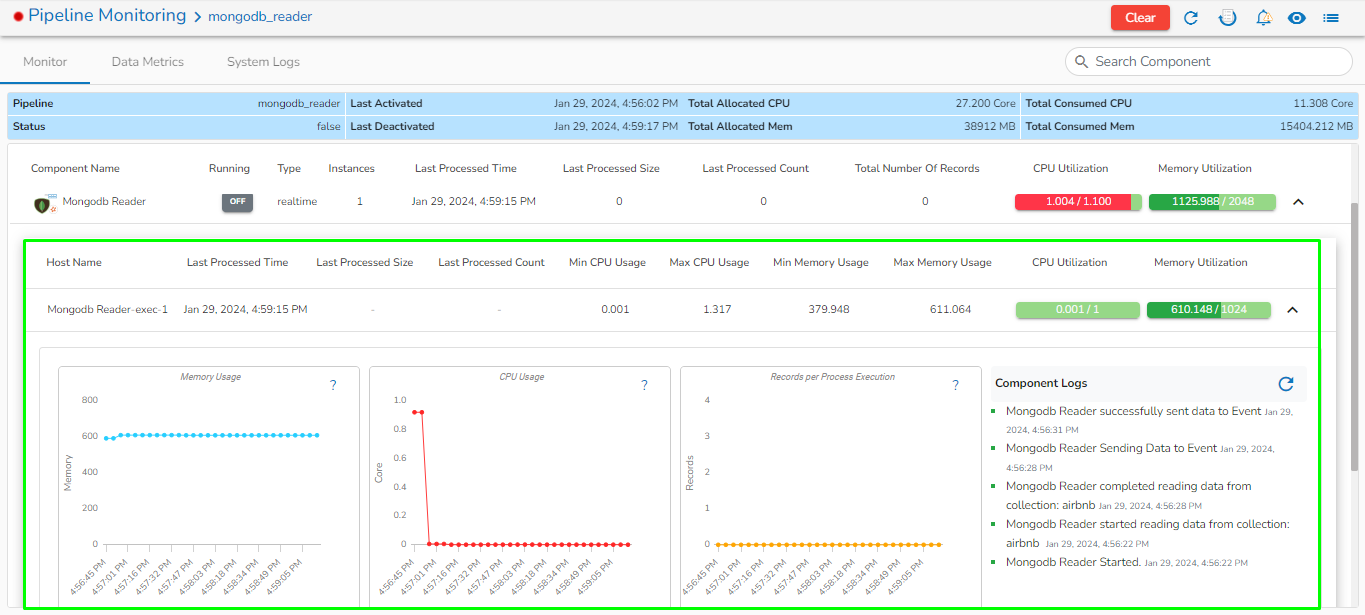
Once the user clicks on any instance, the page will expand to show the graphical representation of CPU usage, Memory usage and Records Per Process Execution over the given interval of time. For reference, please see the images given below:
Please Note: The Records Per Process Execution metric showcases the number of records processed from the previous Kafka Event. If the component is not linked to the Kafka Event, the displayed value will be 0.
Monitor
The Monitor tab opens by default on the monitoring page.
If there are multiple instances for a single component, click on the drop-down icon.
Details for each instance will be displayed.
Monitoring page for Docker component in Real-Time
Monitoring page for Docker component in Batch:
Monitoring page for Spark Component:
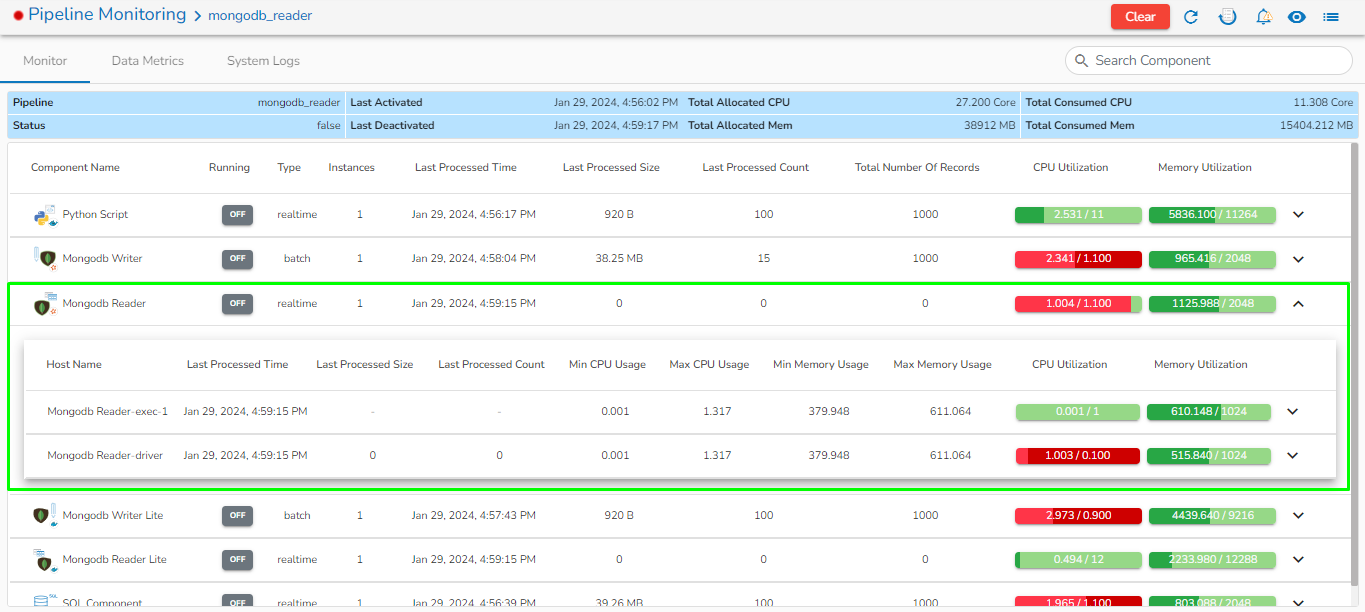
Monitoring page for Spark Component - Driver:
Monitoring page for Spark Component- Executer:
If memory allocated to the component is less than required, then it will be displayed in red color.
Data Metrics
Open the Data Metrics tab from the pipeline monitoring page.
It shows the Produced, Consumed, and Failed records for each component in the pipeline over the given interval of time range in the form of bar charts where each bar contains the data of the given time interval (by default 30 mins).
Color terminology on the data metrics page:
Blue: Indicates the number of records successfully produced to the out event by the component.
Green: Indicates the number of records consumed from the previous connected Kafka event by the component.
Red: Indicates the number of records failed by the component while processing it.
Once hovering over a specific bar in the bar chart on the data metrics page, the following information will be displayed:
Start: Window start time.
End: Window end time.
Processed: Number of processed records.
Produced: Number of records generated after processing.
Consumed: Number of records consumed from the previous event.
Failed: Number of records that failed during processing.
Failed Percentage: Percentage of failed records, calculated as the ratio between Failed and Processed data.

The user can see the data metrics for all the components by enabling the Show all components on the Data Metrics page. Please refer the below given image for the reference.

Filter: The user can apply their custom filter using the Filter tab on the Data Metrics page.
Time Range & Interval:
Enter the Start date & End date for filtering the data.
Custom interval: Enter the time in minutes. Each bar in the bar chart on the data metrics page will contain data for this custom interval.
Click on Apply Time Range to apply the filter.
The user can also filter the data from the last 5 minutes to the last 2 days directly from the filter tab.

Clear: It will clear all the monitoring and data metrics logs for all the components in the pipeline.
Please Note: The Clear option does not display on the monitoring page if the pipeline is active.

Users can visualize the loaded data in the form of charts by clicking on the green color icon.
Please go through the given walk-through for the reference.
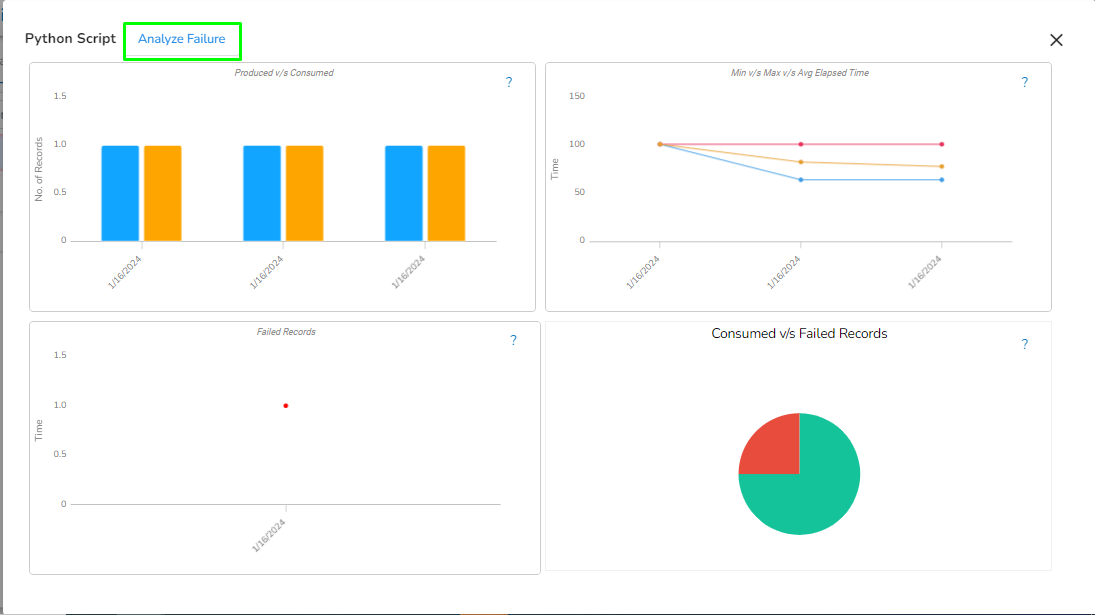
Once the user clicks on the green color icon, the following page will be opened:
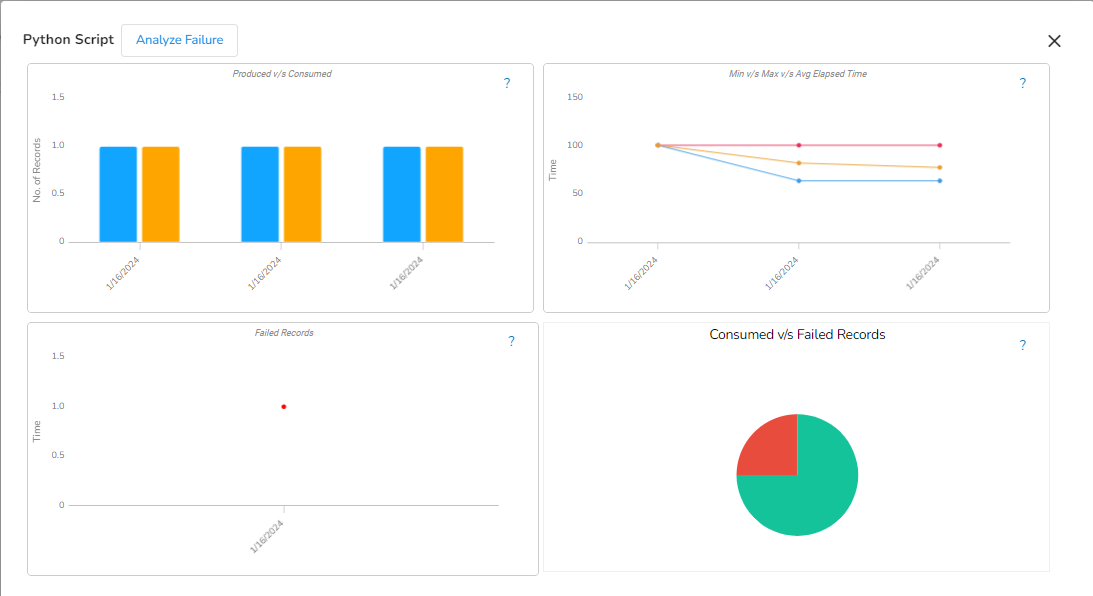
Produced v/s Consumed
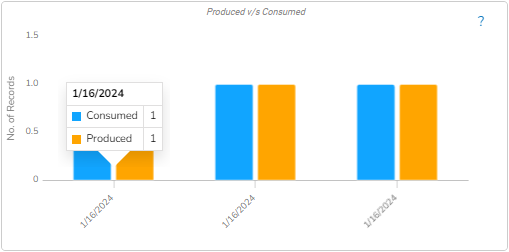
This chart will display the number of records produced to the out event compared to the number of records taken from the previous event over the given time window.
Min v/s Max v/s Avg Elapsed Time
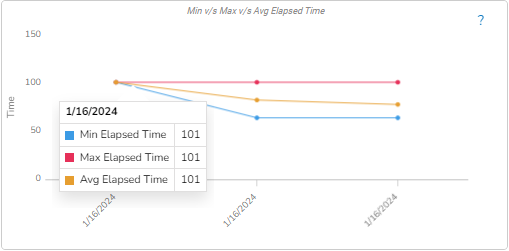
This chart displays the minimum, maximum, and average time taken (in milliseconds) to process a record over the given time window.
Min Elapsed Time: The minimum time taken (in milliseconds) to process a record and send it to the out event.
Max Elapsed Time: The maximum time taken (in milliseconds) to process a record and send it to the out event.
Average Elapsed Time: The average time taken (in milliseconds) to process a record and send it to the out event.
Failed Records
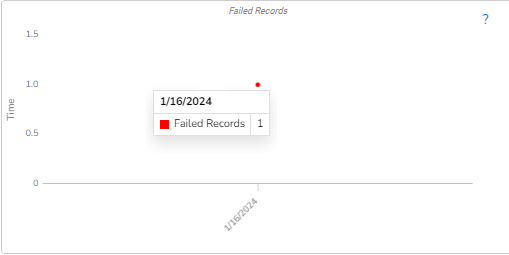
This chart will display the number of failed records during processing over the given time window for the selected component.
Consumed v/s Failed Records
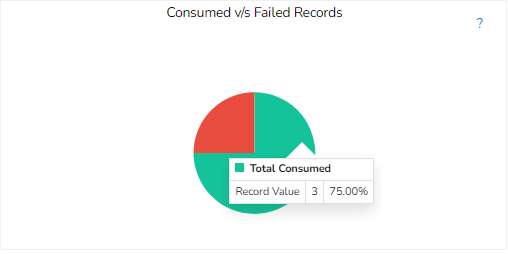
This chart will display the ratio of records failed during processing by the component to the total number of records consumed by the component over the given time window.
The user can also analyze the failure for the selected component from the Data Metrics page by clicking on the Analyze Failure option. Please see the below given image for reference.
Clicking on the Analyze Failure option will redirect the user to the Failure Analysis page.
System Logs
In this tab, the user can see the pod logs of every component in the pipeline. The user can access this tab from the monitoring page.
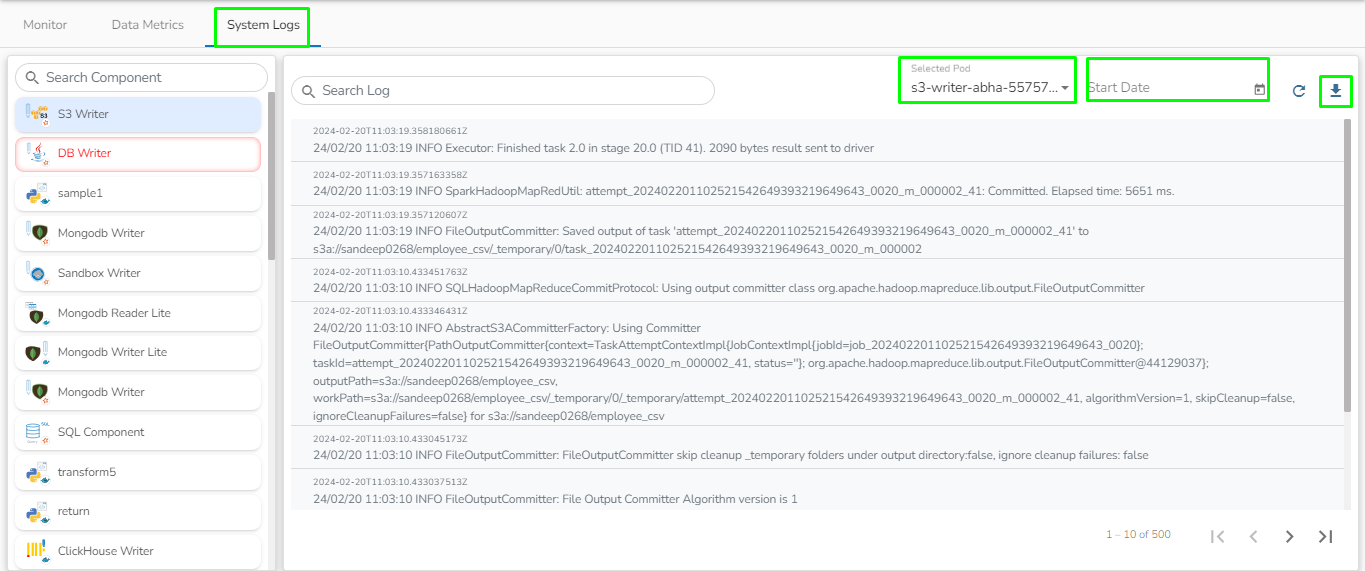
The user can find the following options on the System Logs tab:
Selected Pod: The user can select the Pod for which they want to see the logs.
Date Filter: The user can apply the date filter to see the logs accordingly.
Refresh Logs: The user can refresh the logs for the selected pod.
Download Logs: The user can download the logs for the selected pod.
Please Note: The System Logs on the monitoring page will be displayed only when the pipeline is active.
Last updated