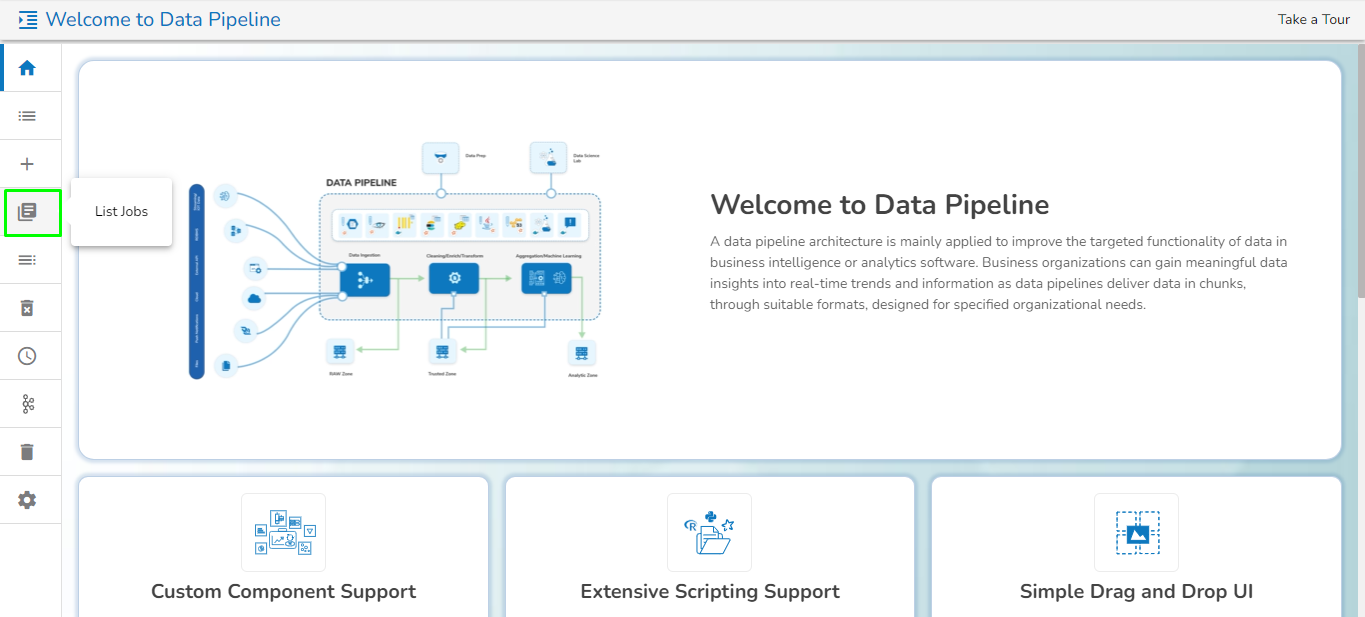
Accessing the List Job option from Pipeline Homepage
Accessing the List Job option from Pipeline Homepage
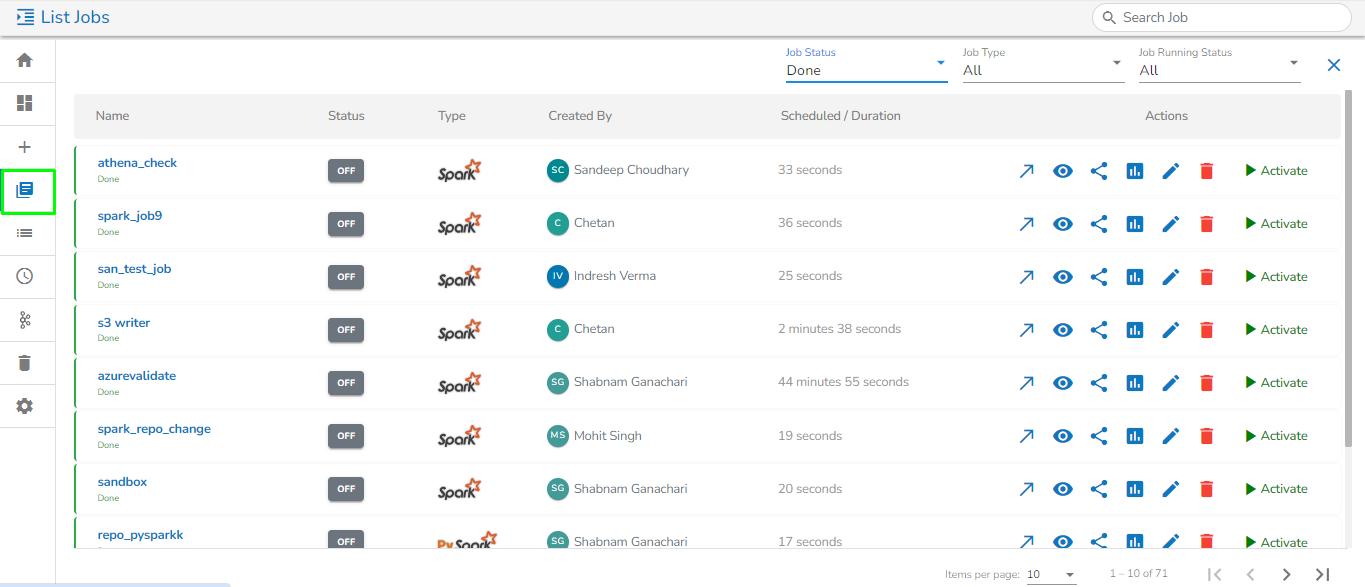
List Job Page
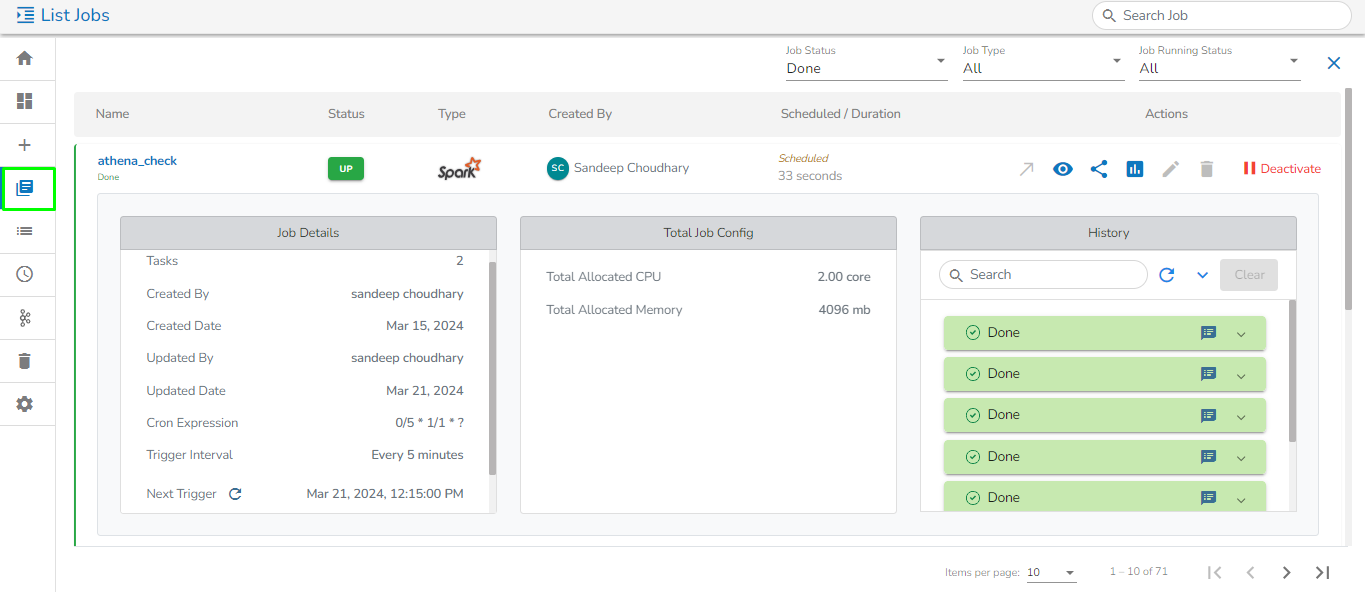
Displaying Job Details, Total Job Config & Job History for Spark Job
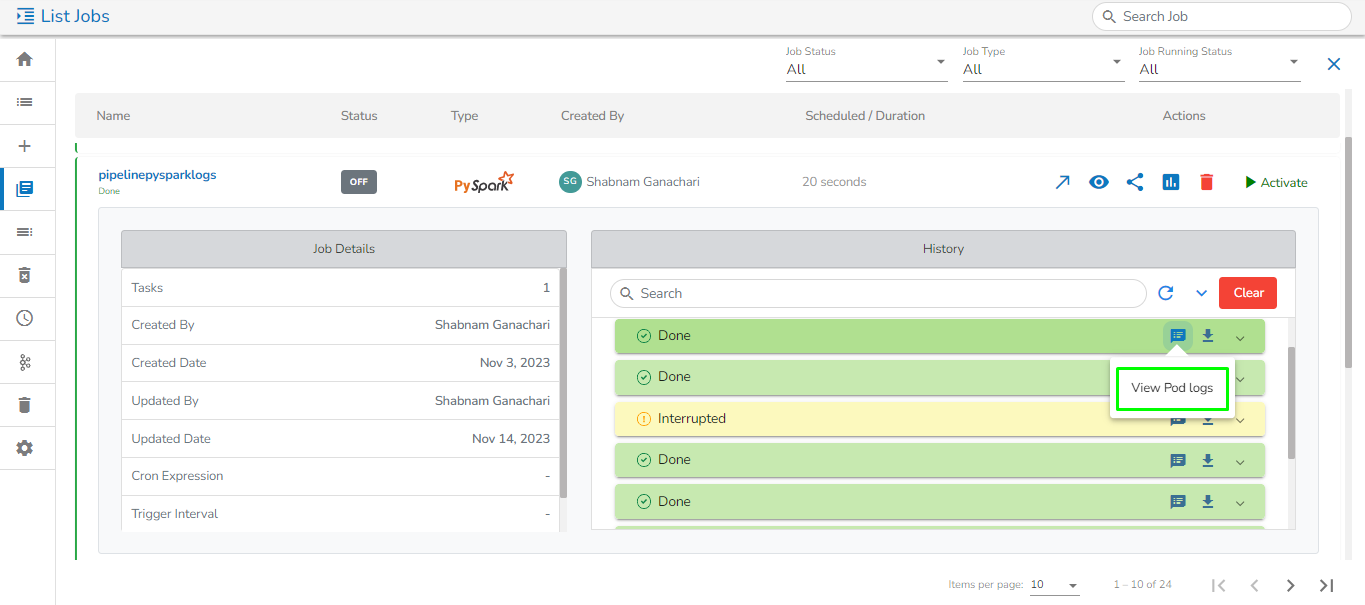
View and Download Pod logs option for PySpark Job from List Jobs page
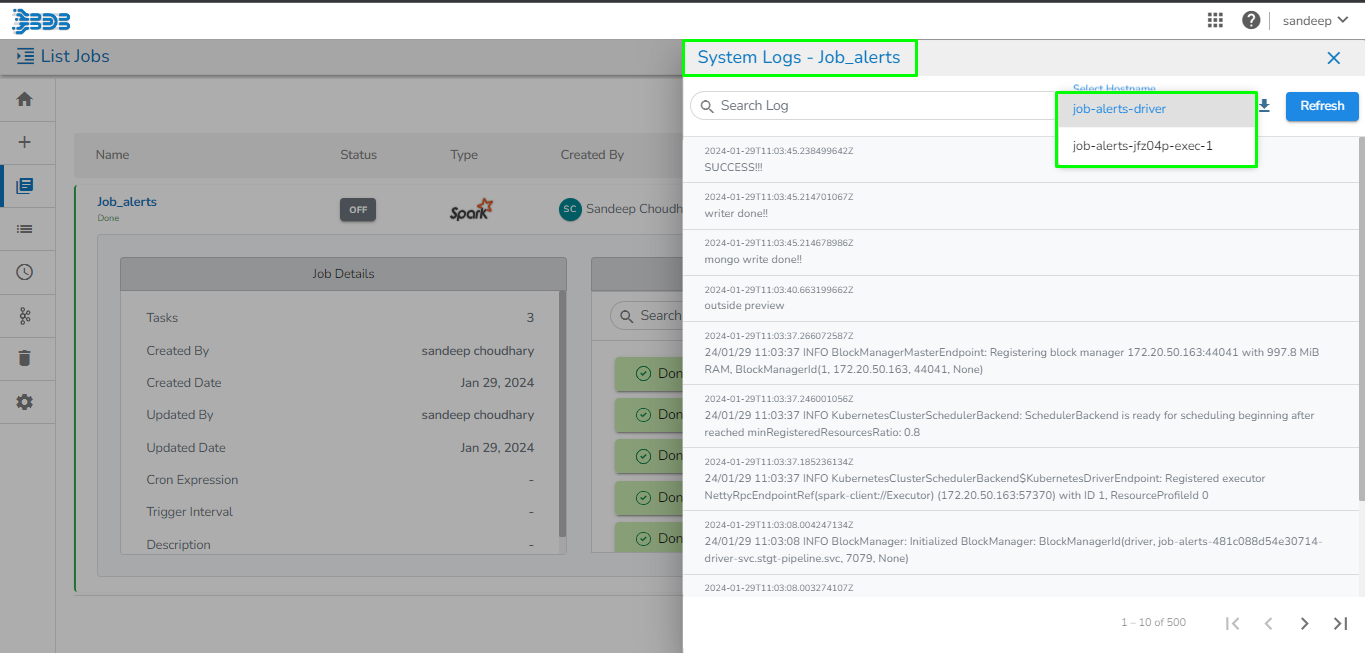
Viewing Pod logs for Spark Job
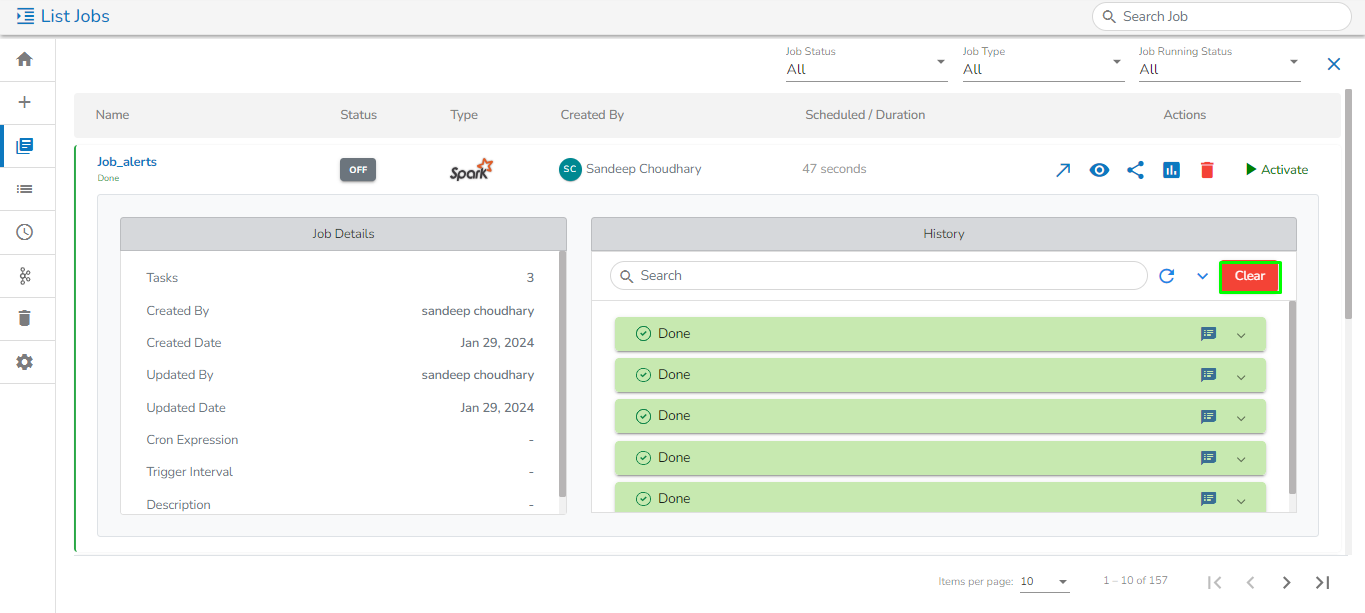
Clear Job History
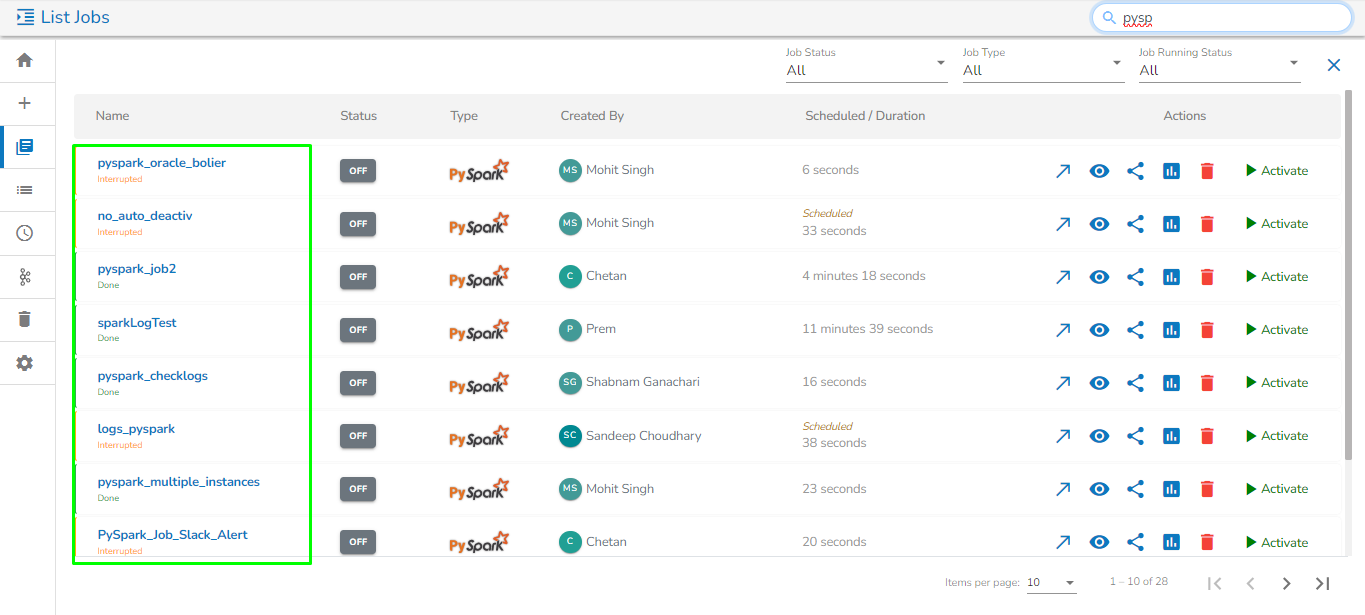
Search tab for Jobs
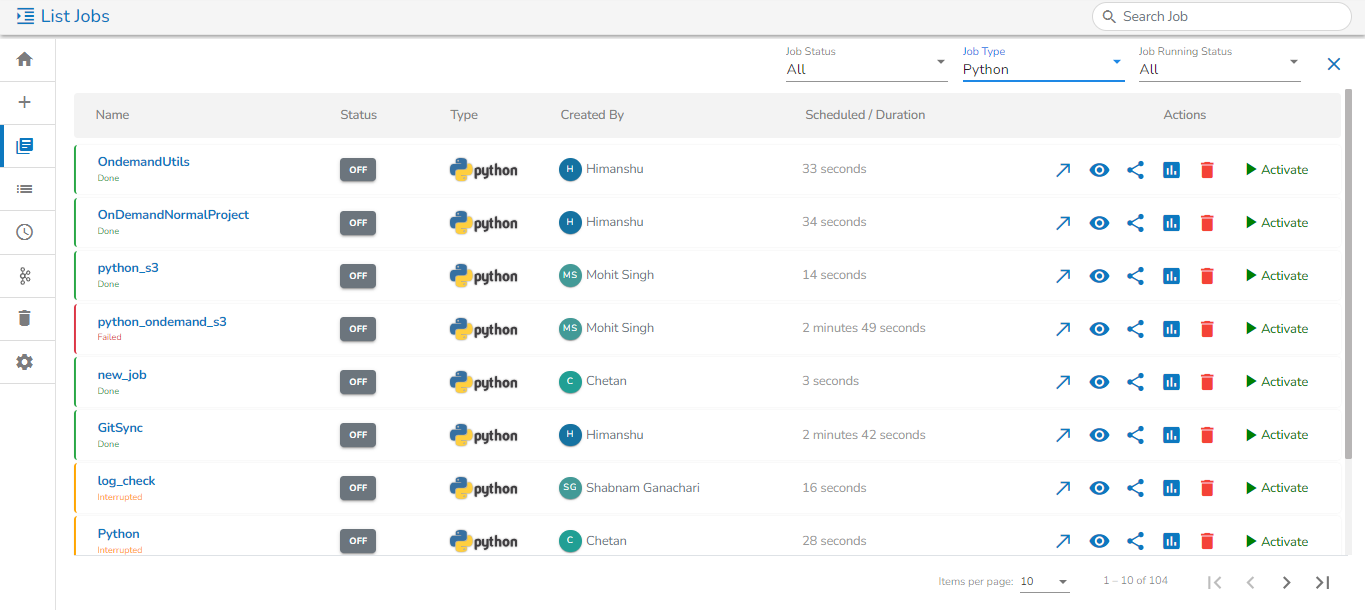
Customizing Job list with the available Filters