> For the complete documentation index, see [llms.txt](https://docs.bdb.ai/self-service-visualization-4/llms.txt). Markdown versions of documentation pages are available by appending `.md` to page URLs; this page is available as [Markdown](https://docs.bdb.ai/self-service-visualization-4/report-final-screen/options-assigned-to-a-view/analyse.md).

# Analyse

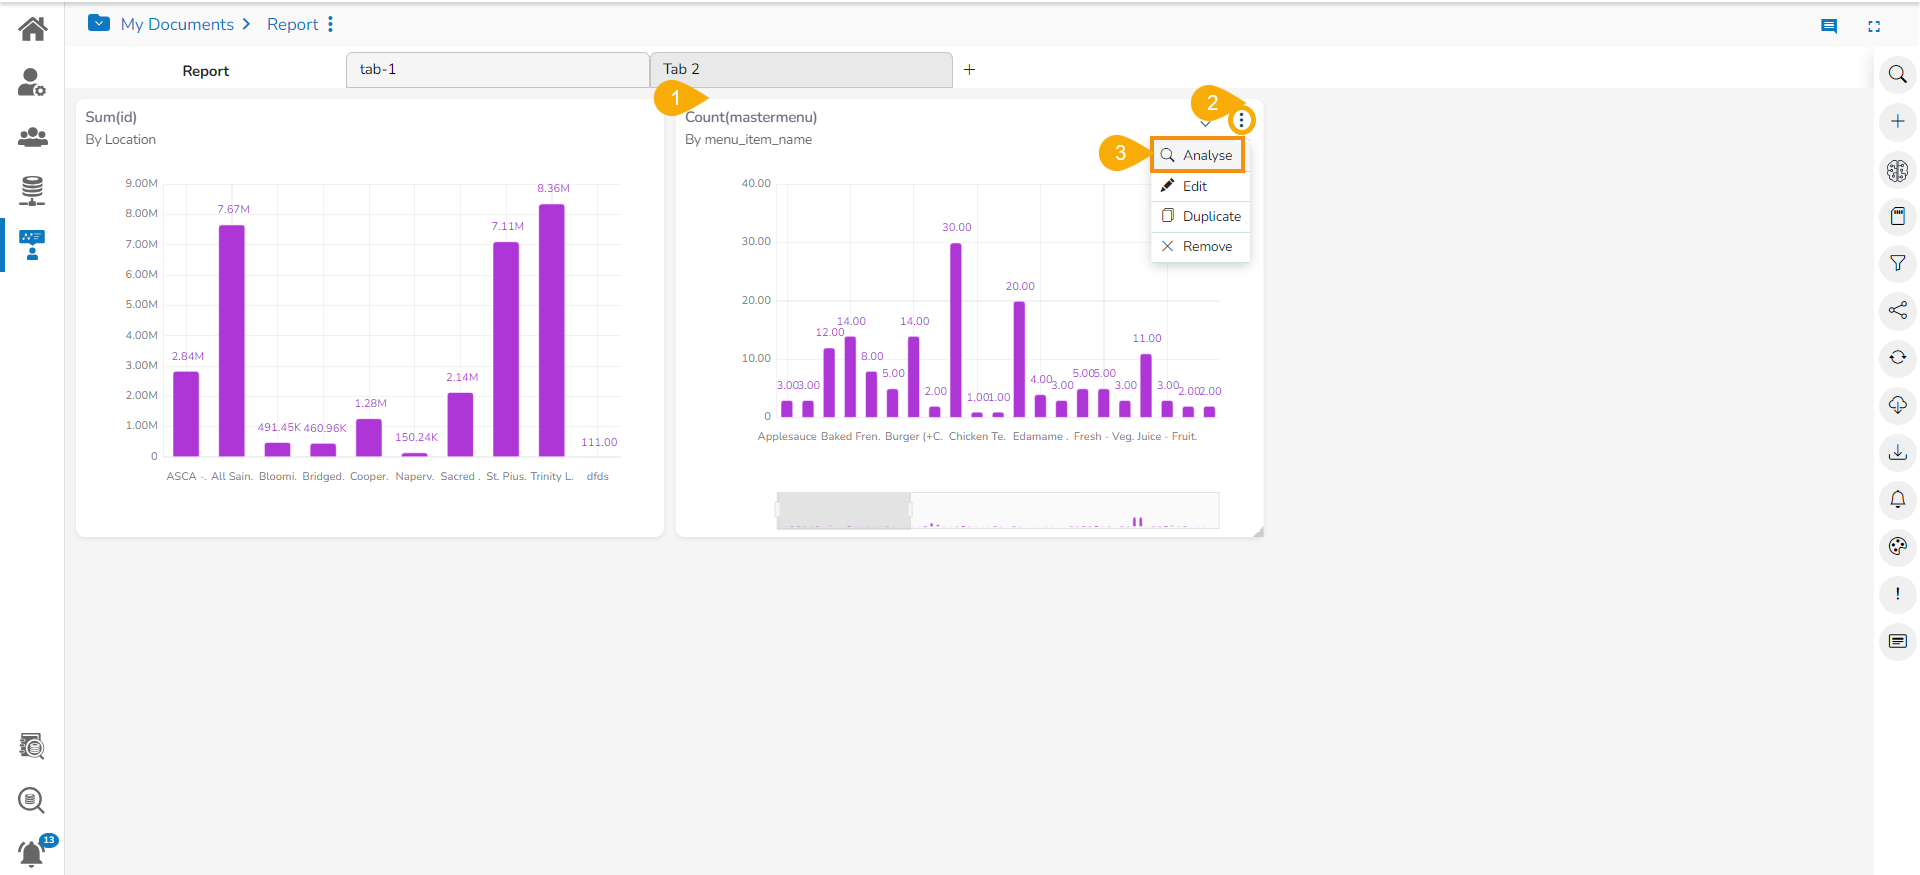
* Select a ***View*** from the Storyboard.
* Click the ***Options*** icon.&#x20;
* Click the ***Analyse*** option from the displayed context menu.

<figure><img src="https://content.gitbook.com/content/vIDgRfkRB1bQpGtEDFfQ/blobs/55ApwAVSOCp07wFX1xJD/image.png" alt=""><figcaption><p><em><strong>Accessing Analytics option for a View</strong></em></p></figcaption></figure>

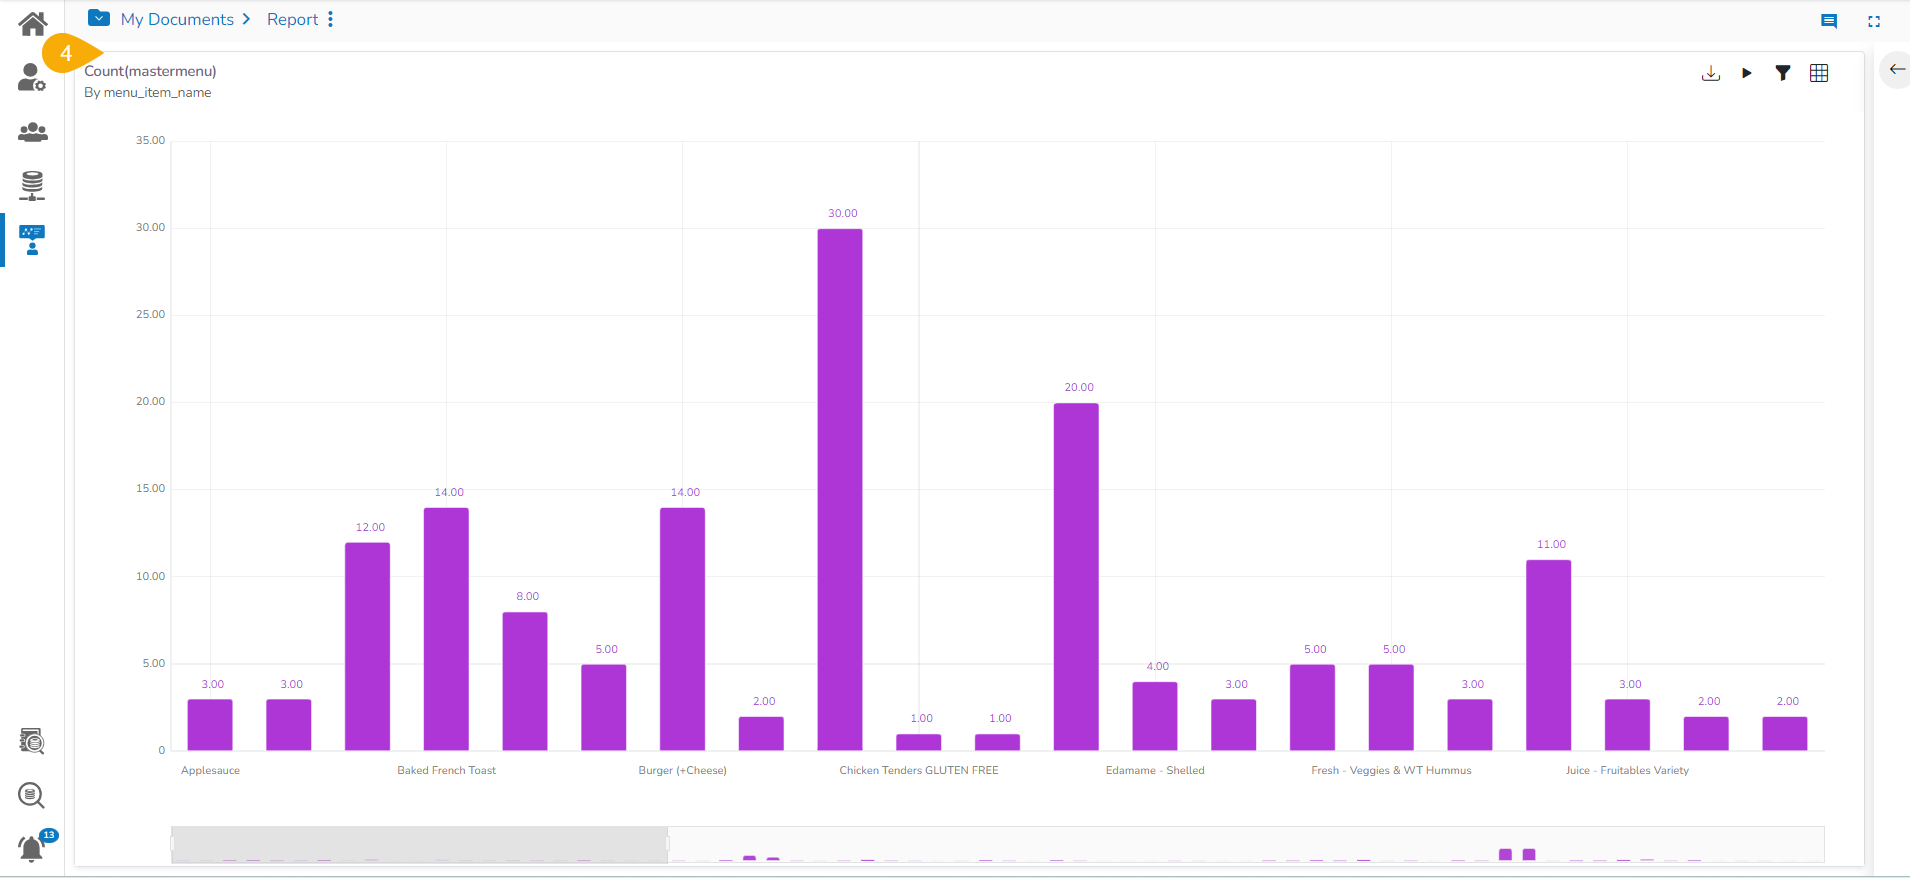
* The selected ***View*** opens in the analysis mode.

<figure><img src="https://content.gitbook.com/content/vIDgRfkRB1bQpGtEDFfQ/blobs/XYp4tw1eLUgj9duqsE0L/image.png" alt=""><figcaption><p><em><strong>The selected View in the Analytics mode</strong></em></p></figcaption></figure>

* The user can select any of the following options to analyze a saved view:

| **Icon**                                                                                                                              | **Name**      | **Action**                                                              |
| ------------------------------------------------------------------------------------------------------------------------------------- | ------------- | ----------------------------------------------------------------------- |
| <img src="https://content.gitbook.com/content/vIDgRfkRB1bQpGtEDFfQ/blobs/OmiwUxBPVfjsmm8t3s7j/image.png" alt="" data-size="original"> | Chart         | Displays data in the chart format.                                      |
| ​![](https://content.gitbook.com/content/vIDgRfkRB1bQpGtEDFfQ/blobs/SeX5MuNY6EfkZgullkwL/image.png)​                                  | Grid          | Displays data in the grid format.                                       |
| ​![](https://content.gitbook.com/content/vIDgRfkRB1bQpGtEDFfQ/blobs/L7HzjDQdkTnKVJCg7Alm/image.png)​                                  | Export        | Exports the Story in CSV/XLSX/PDF format.                               |
| ​​![](https://content.gitbook.com/content/vIDgRfkRB1bQpGtEDFfQ/blobs/zghbtsqUPes8XQBwkhIZ/image.png)                                  | View Filter   | Displays filter panel to apply or edit view-specific filter conditions. |
| ​![](https://content.gitbook.com/content/vIDgRfkRB1bQpGtEDFfQ/blobs/SVFBoFcFyCaLG4s5COLT/image.png)​                                  | Timeline Play | Displays changes in the selected data over a period.                    |
| ​​![](https://content.gitbook.com/content/vIDgRfkRB1bQpGtEDFfQ/blobs/0tVw8Uxlxx4mQ5o6ENMw/image.png)                                  | Back          | Redirects back to the storyboard.                                       |

Displaying the View Data in the Grid View.
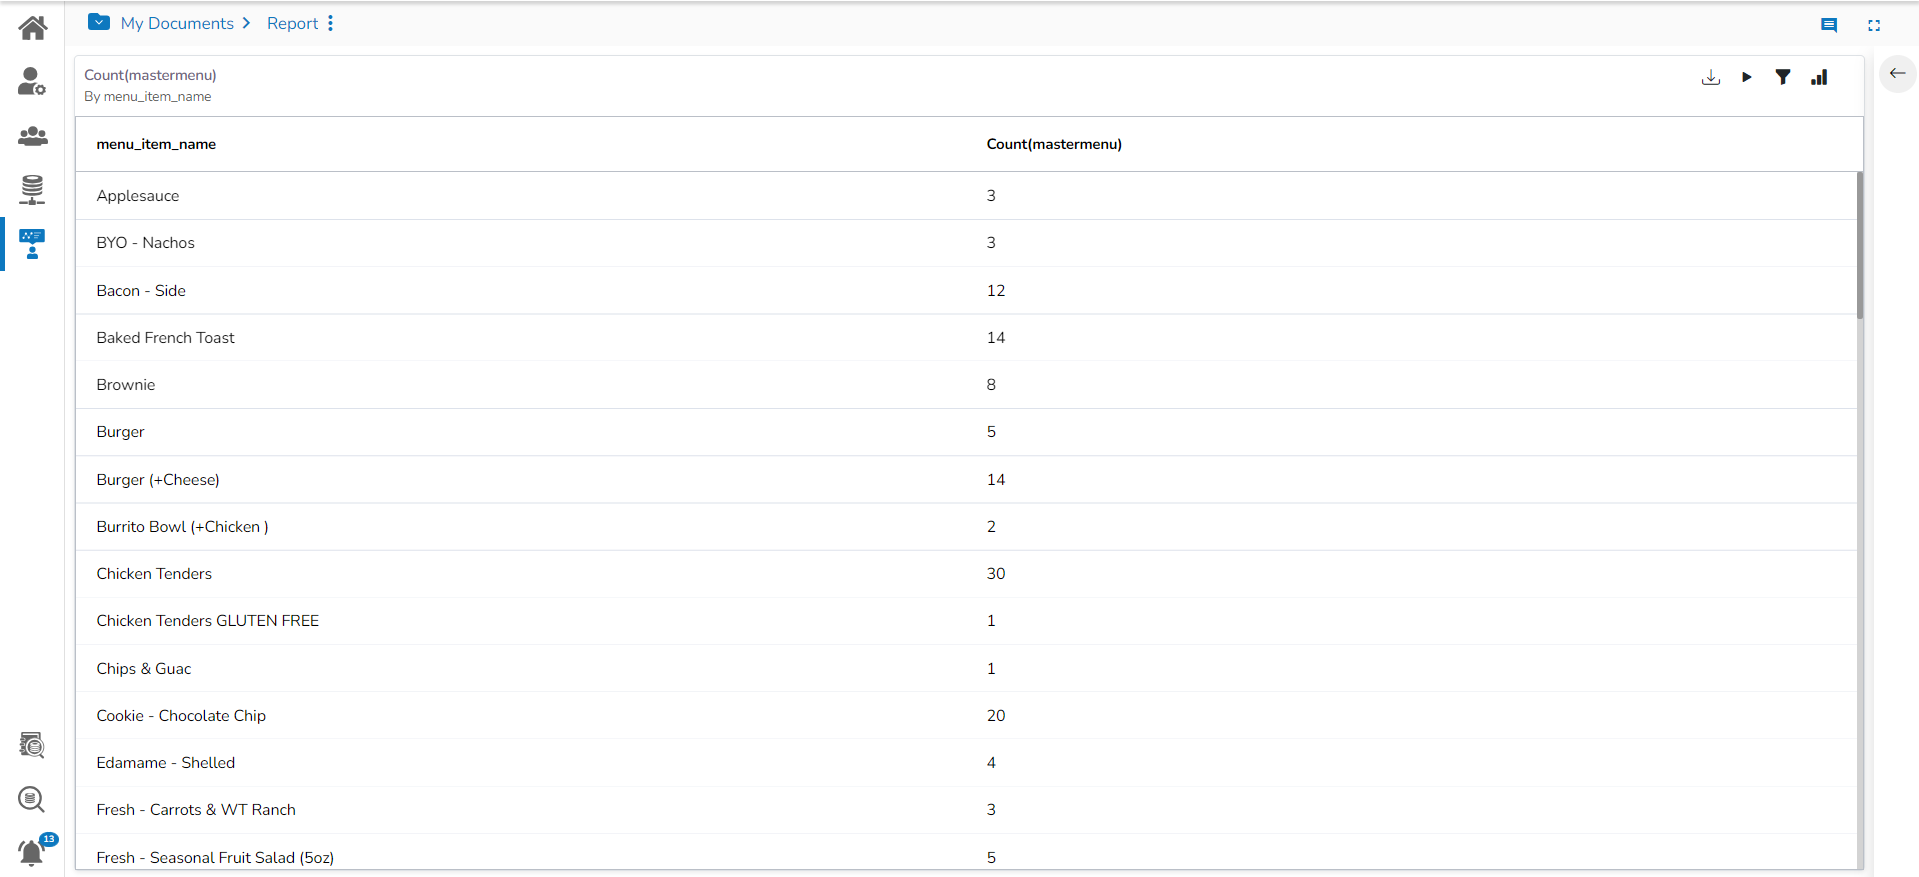
<figure><img src="https://content.gitbook.com/content/vIDgRfkRB1bQpGtEDFfQ/blobs/FyTdbWgetumfKdQMceqv/image.png" alt=""><figcaption></figcaption></figure>

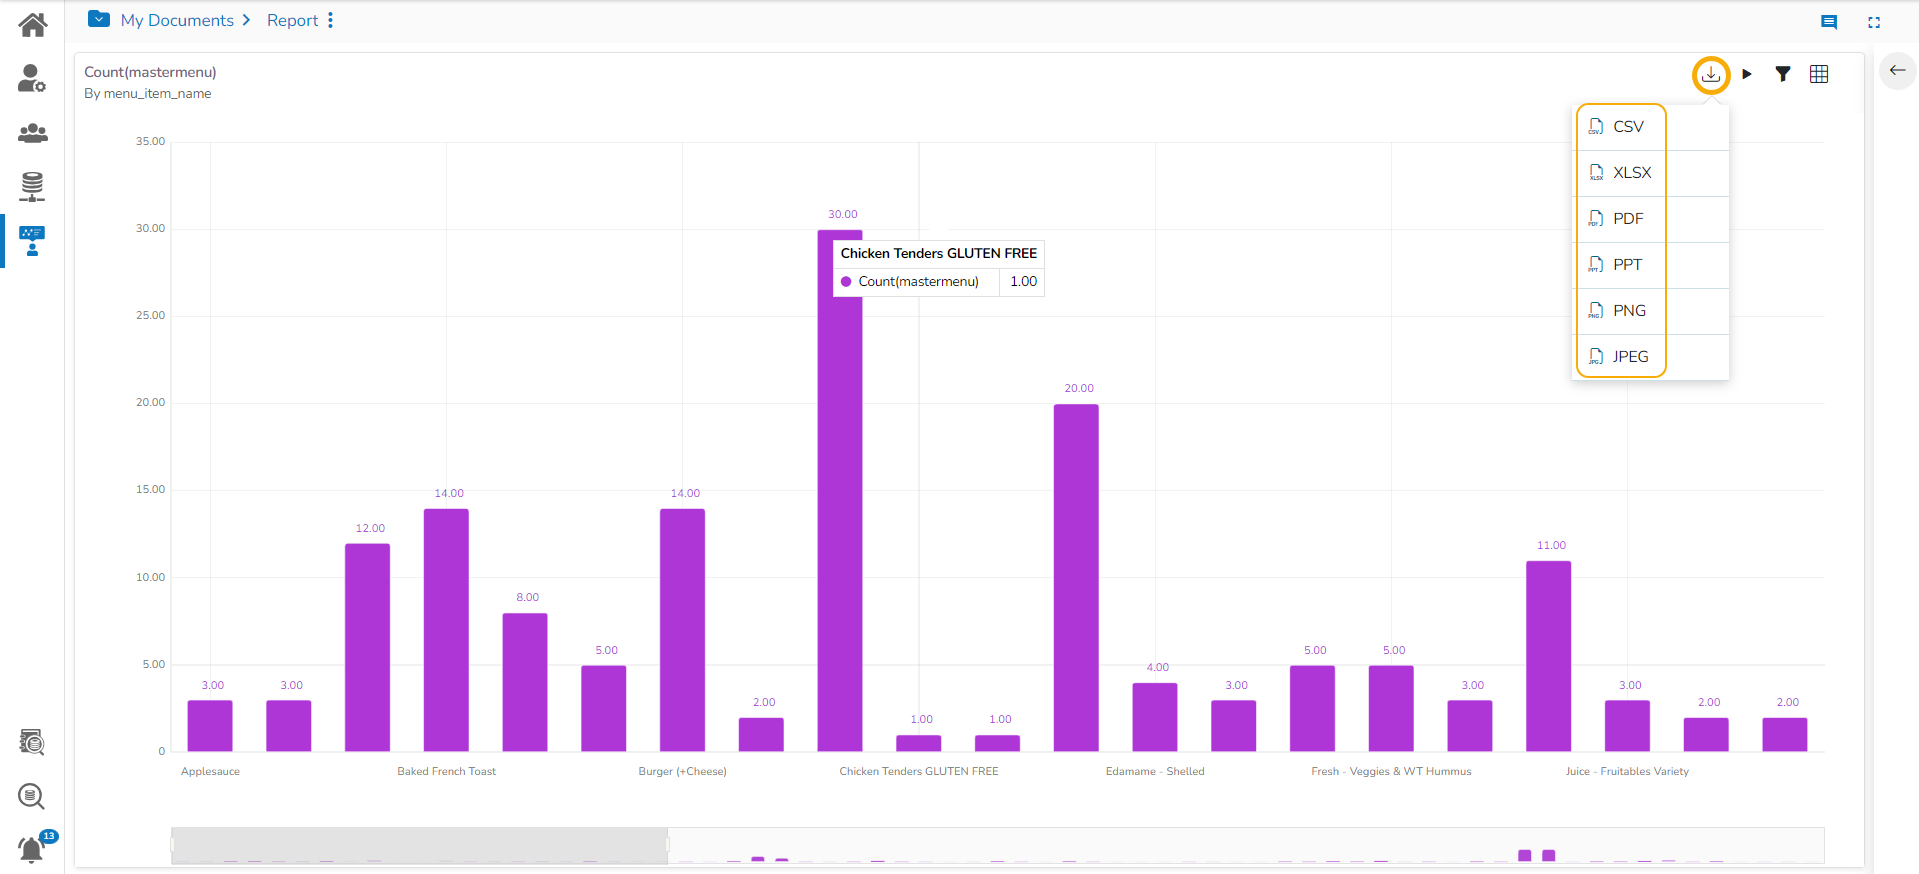
The supported Export option on the Analyze mode for a view are as displayed in the following image:

<figure><img src="https://content.gitbook.com/content/vIDgRfkRB1bQpGtEDFfQ/blobs/t7OSptcYFMDybTUd4J34/image.png" alt=""><figcaption></figcaption></figure>

{% hint style="info" %}
*<mark style="color:green;">Please Note:</mark>*&#x20;

* *The **Export as JEPG Image** and **Export as PNG Image** options are provided in the **Analyze mode** for a view.*
* ***PDF Export in Tabular Format:** The PDF export option for the Data Grid chart now exports the chart data in a tabular format. This enhancement allows users to easily export and share their Data Grid chart data in a PDF file.*
  {% endhint %}