
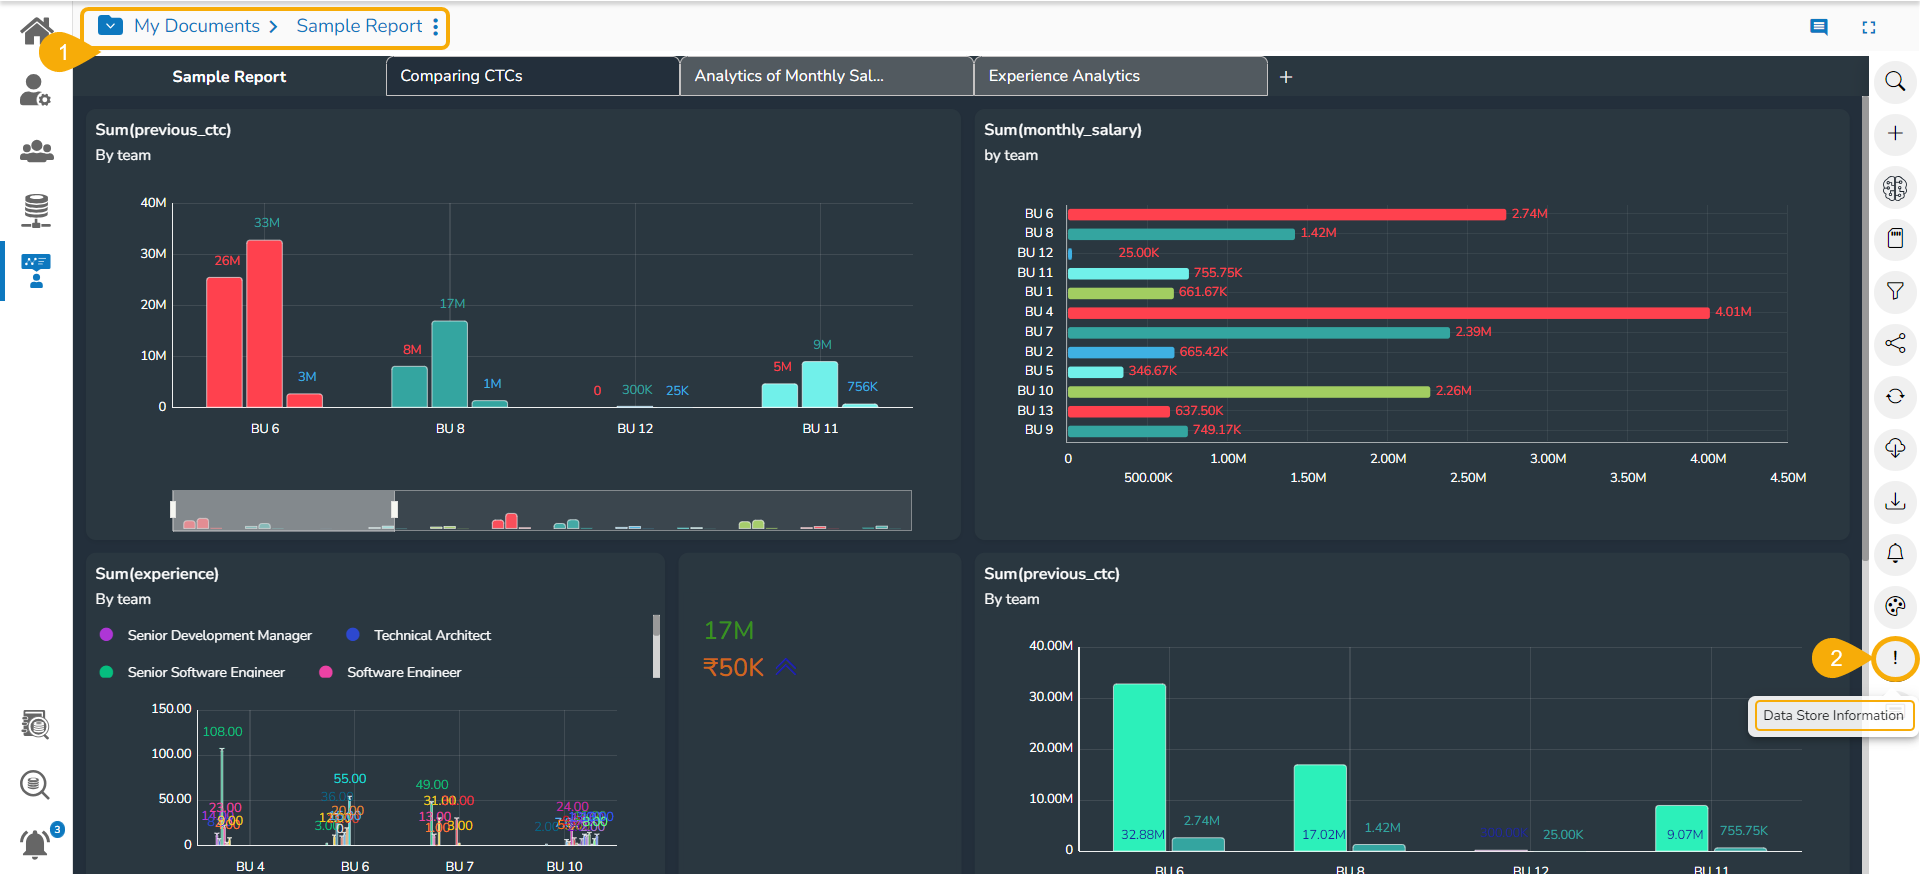
Data Store Information
This page displays the information about the selected Data Stores in context to a report.
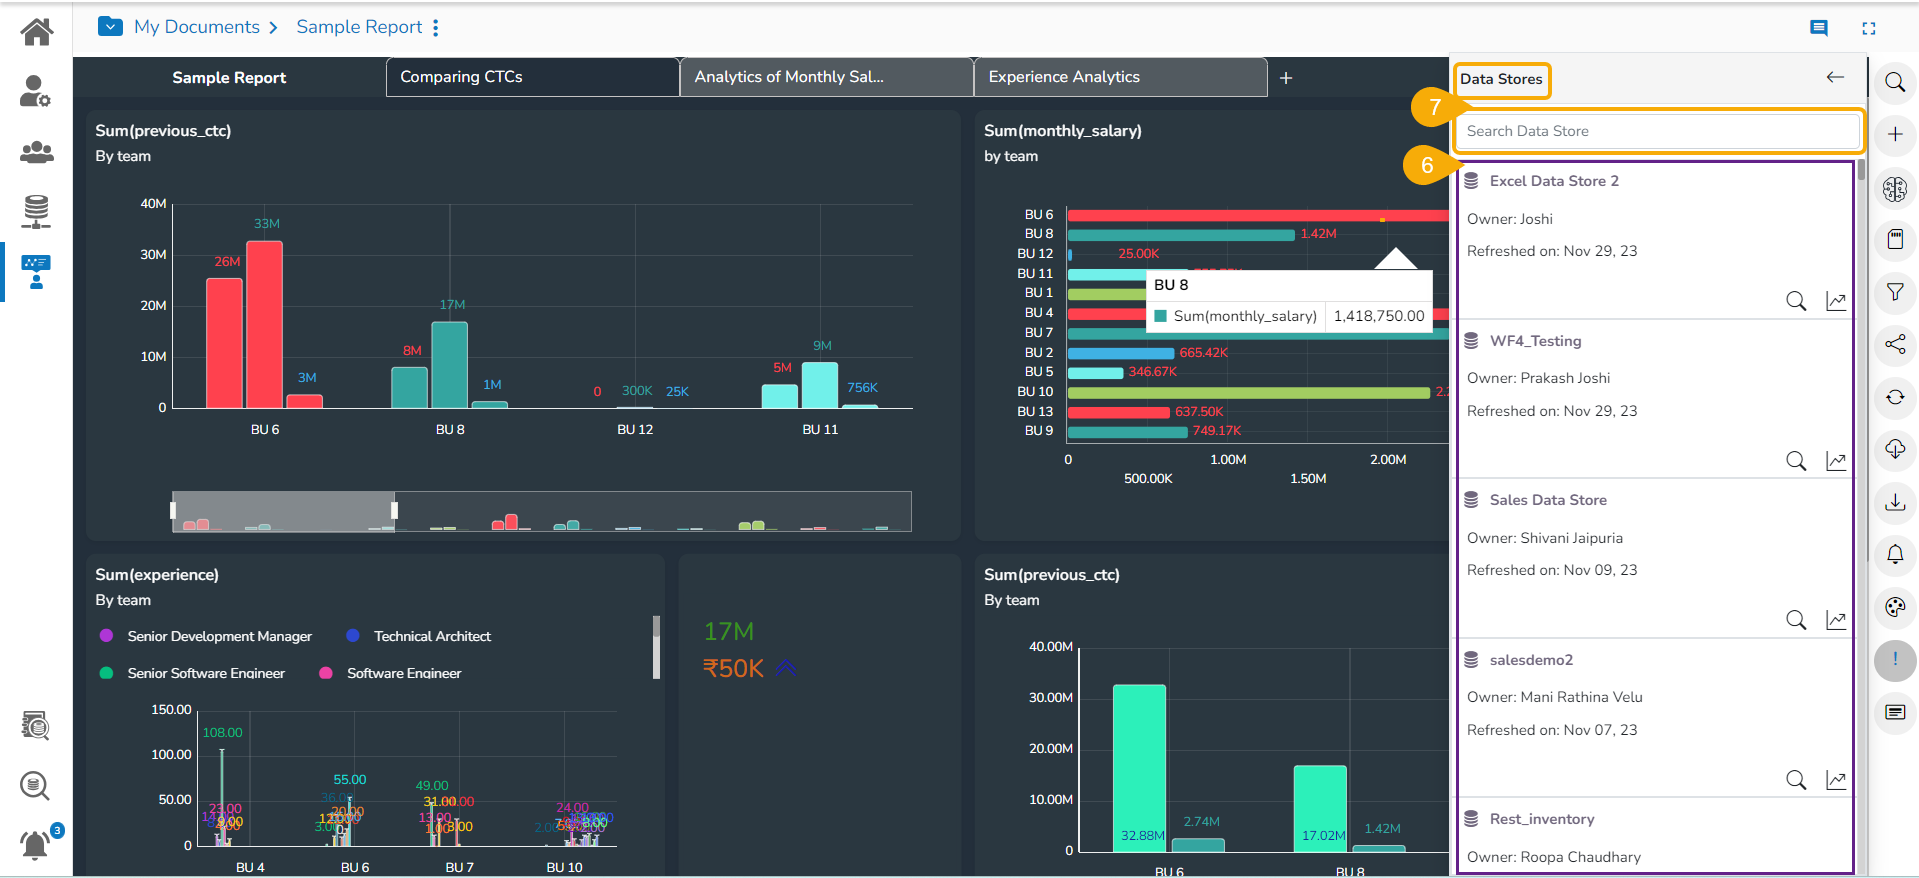
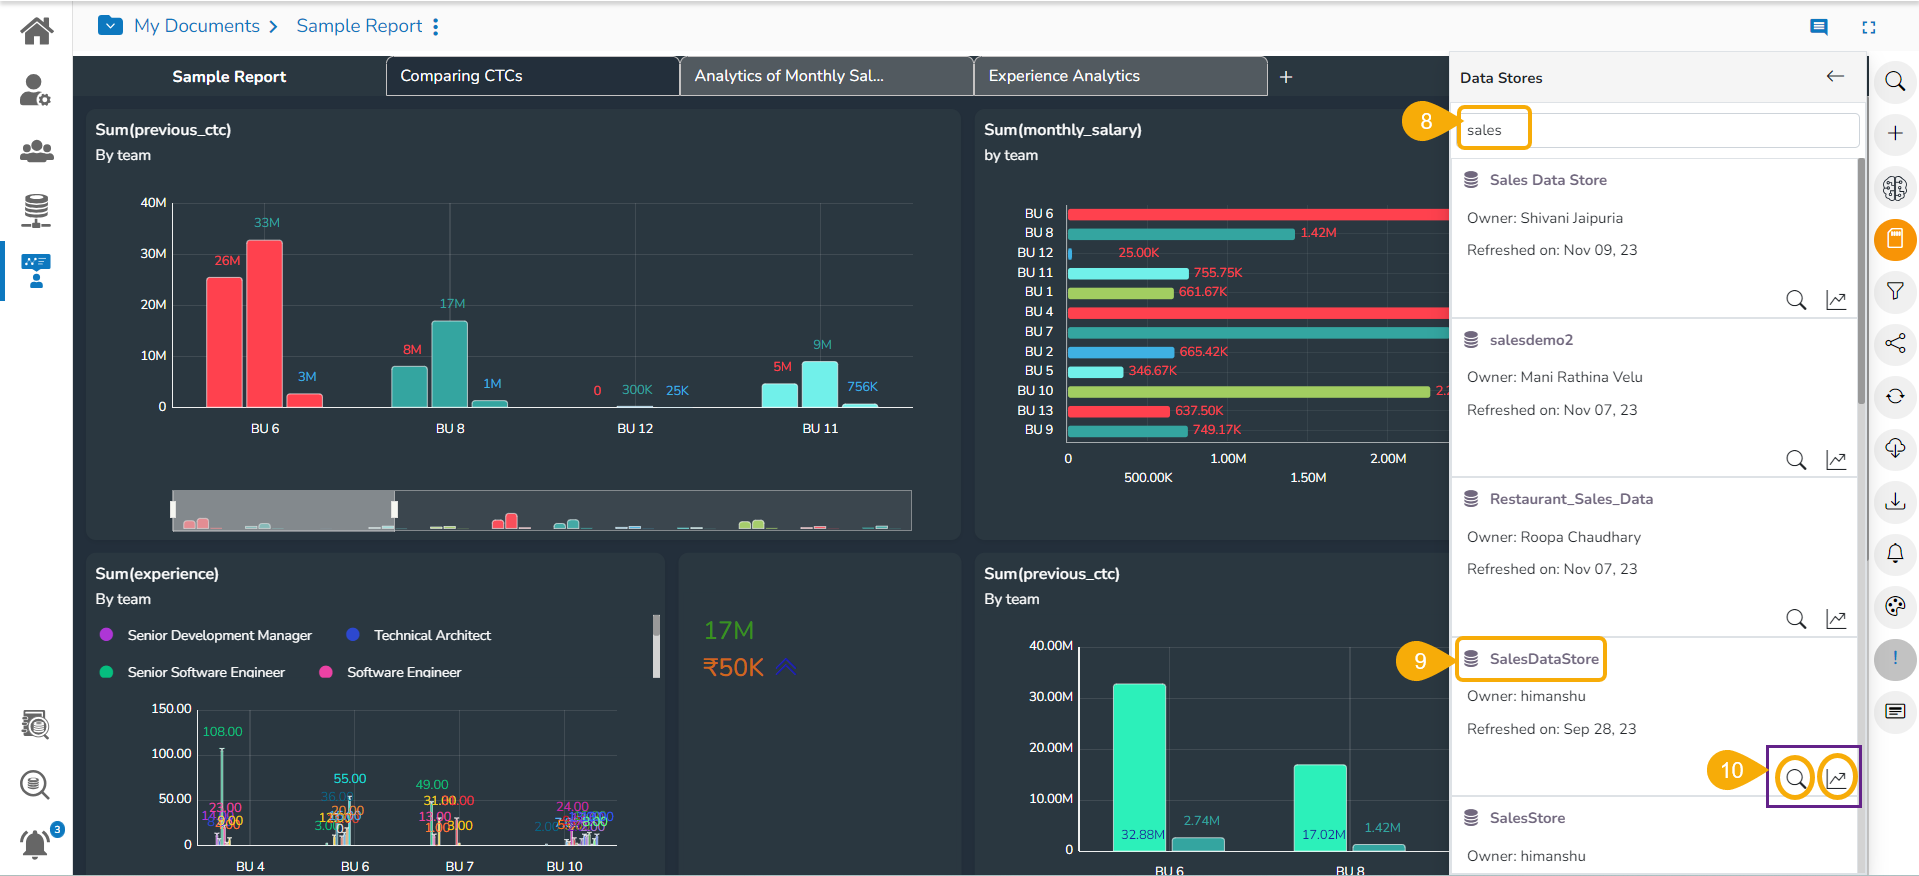
Selecting Another Data Store
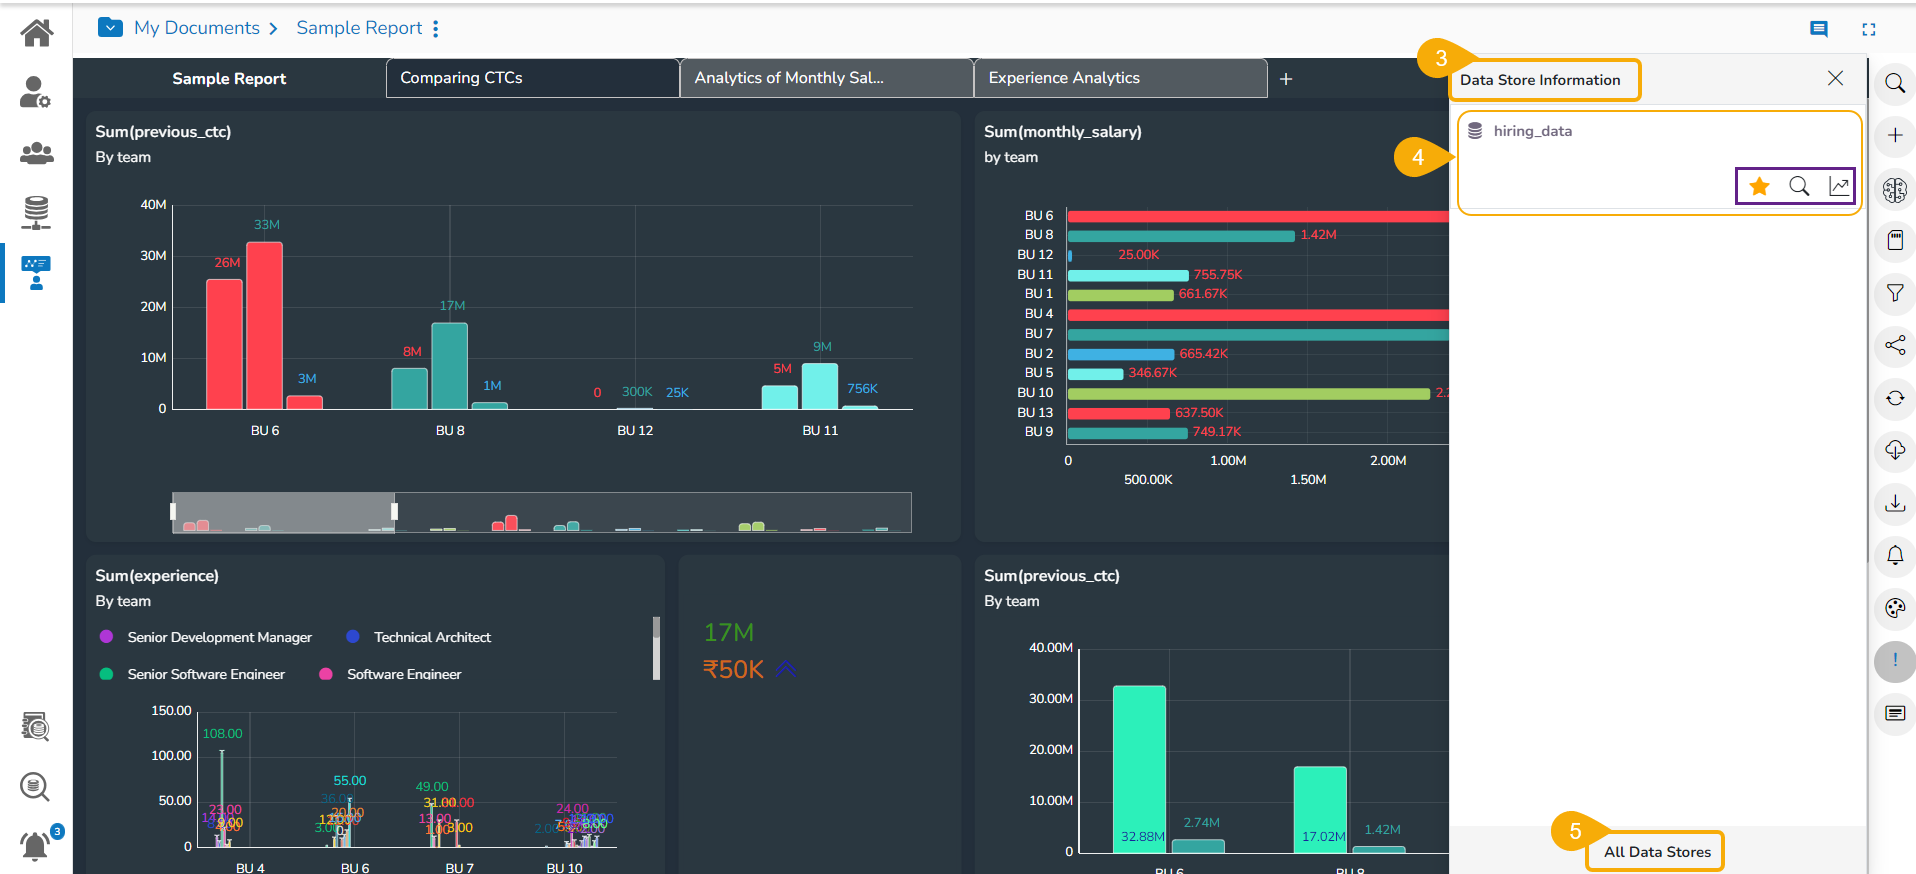
Setting a Data Store as Primary Data Store
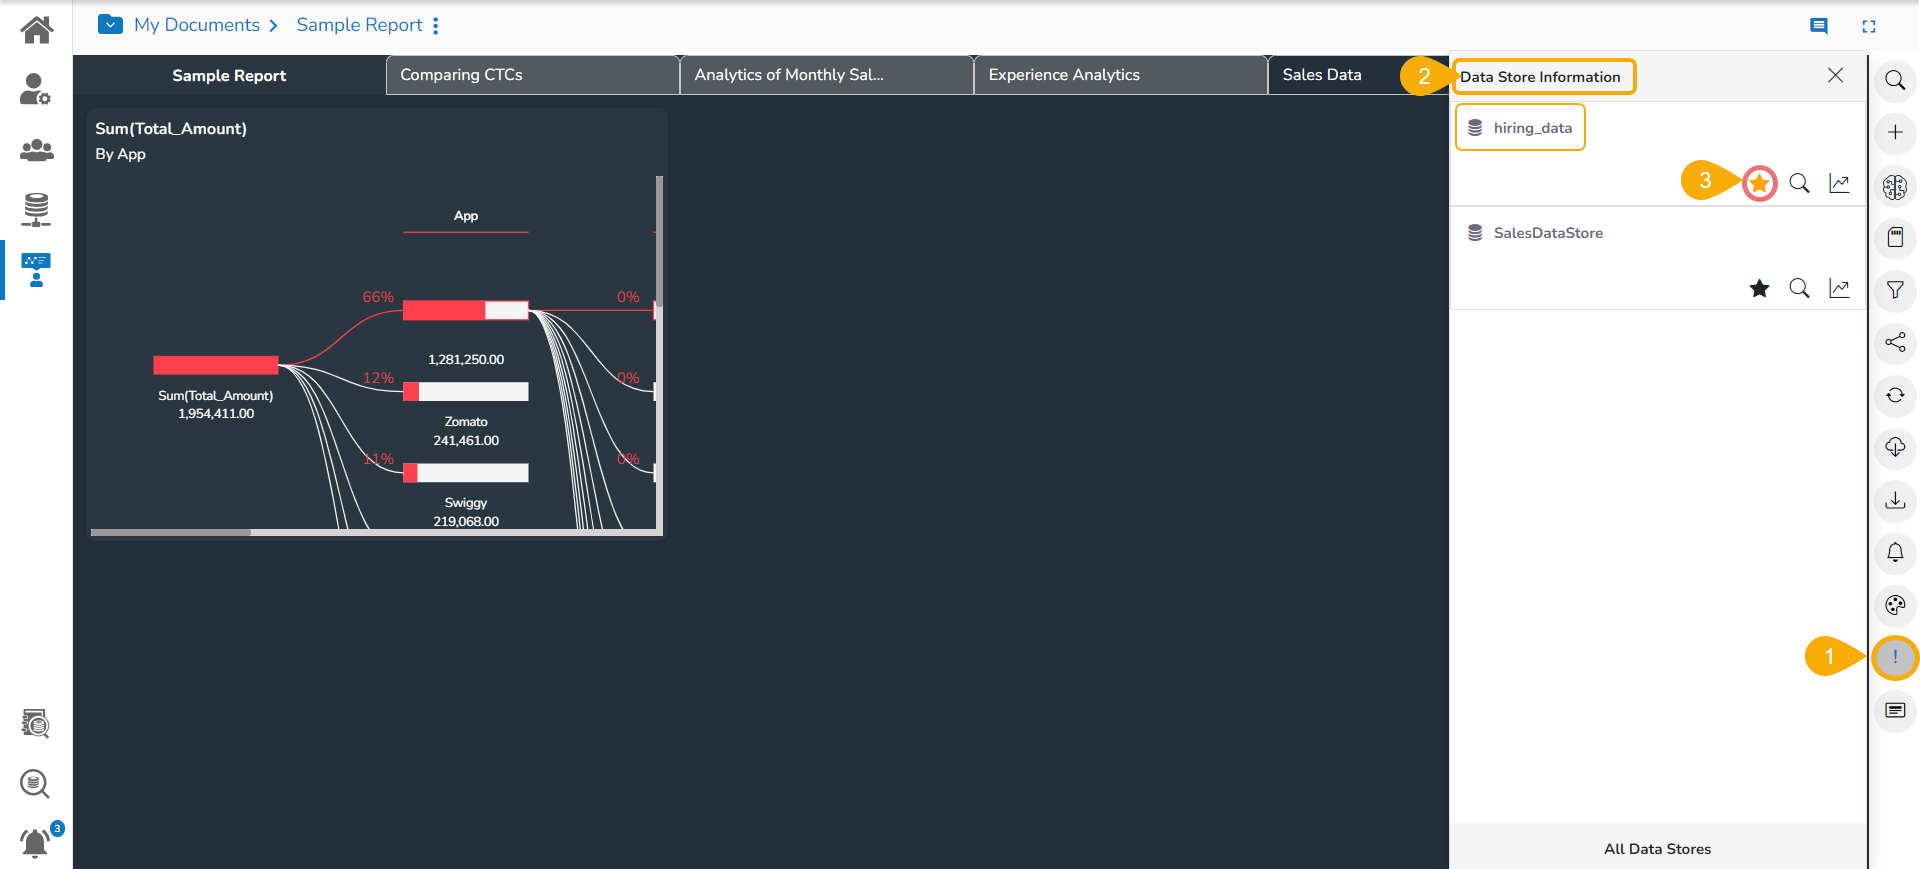
Please Note: The user gets Search![]() and View Design
and View Design![]() icons on the Data Store Information window for the instant access of those pages.
icons on the Data Store Information window for the instant access of those pages.