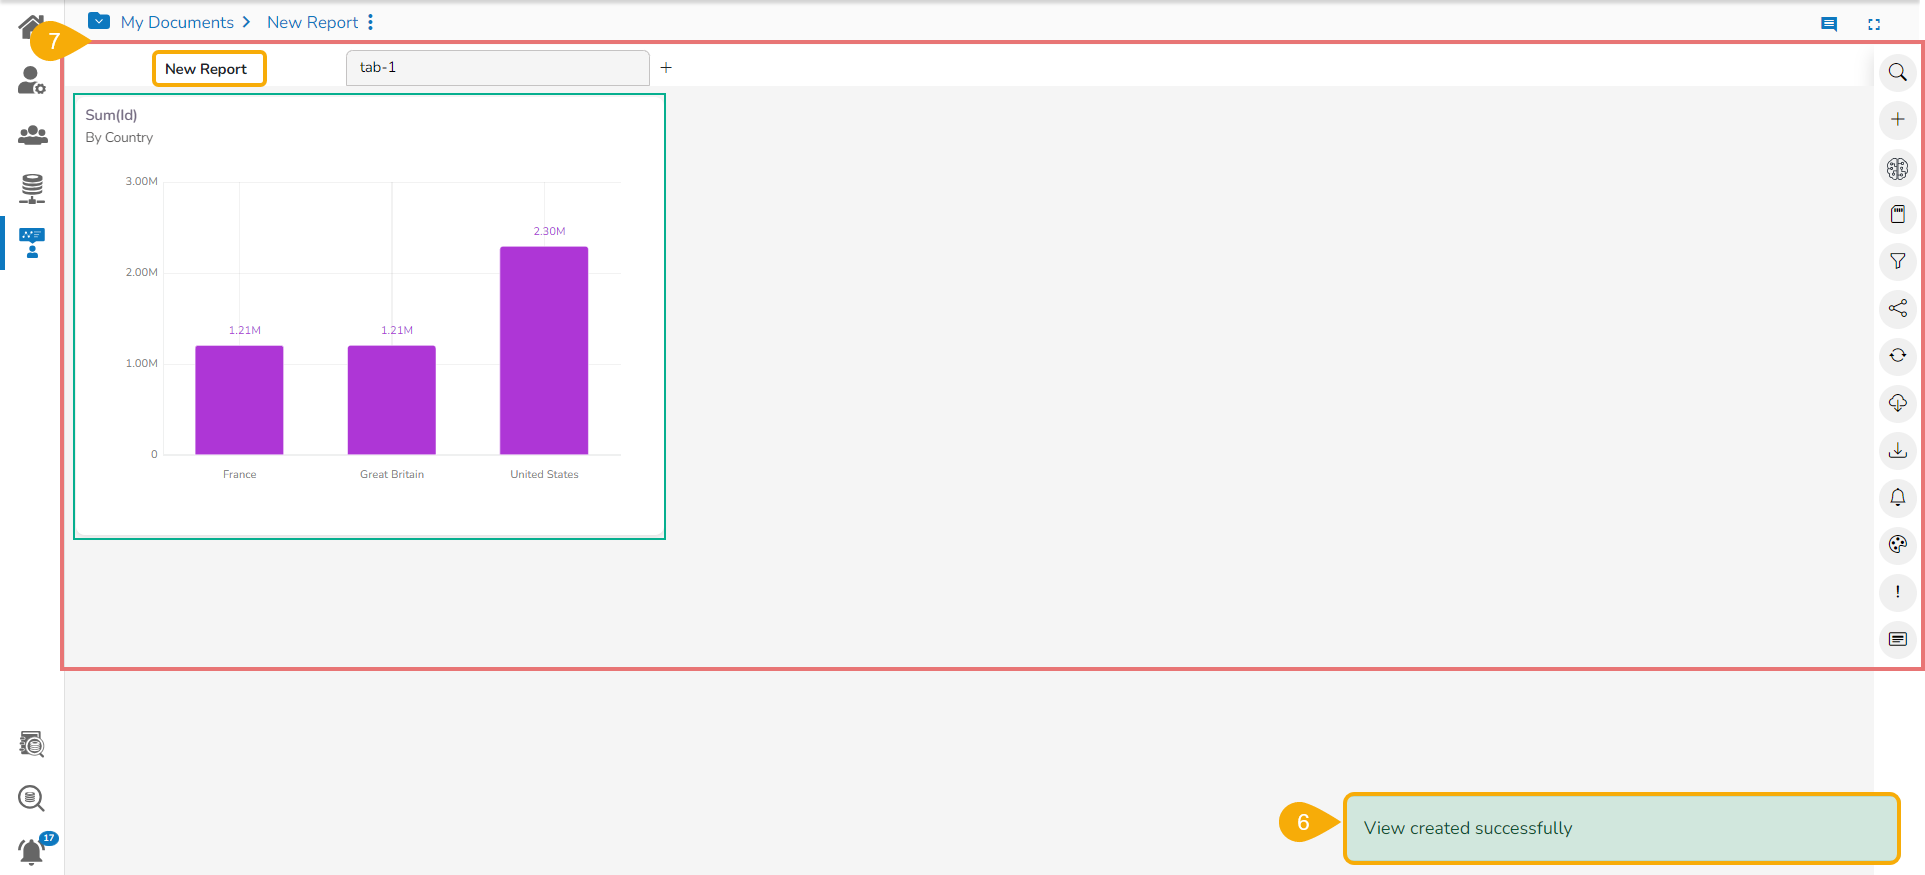
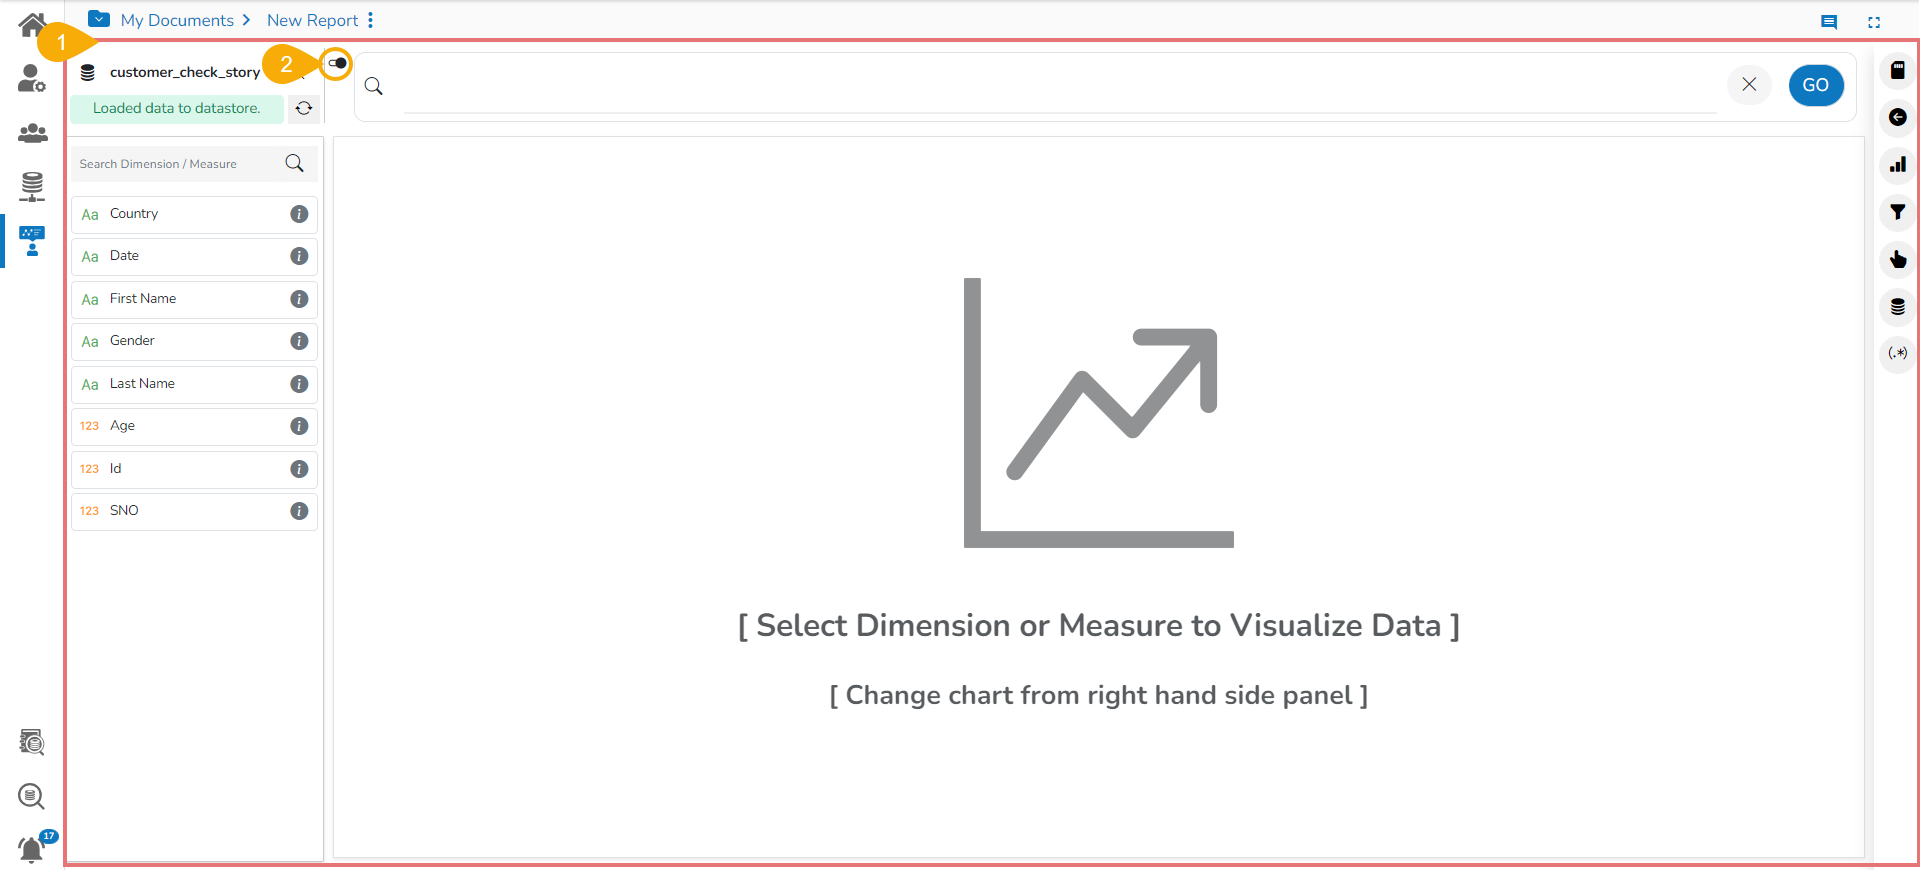
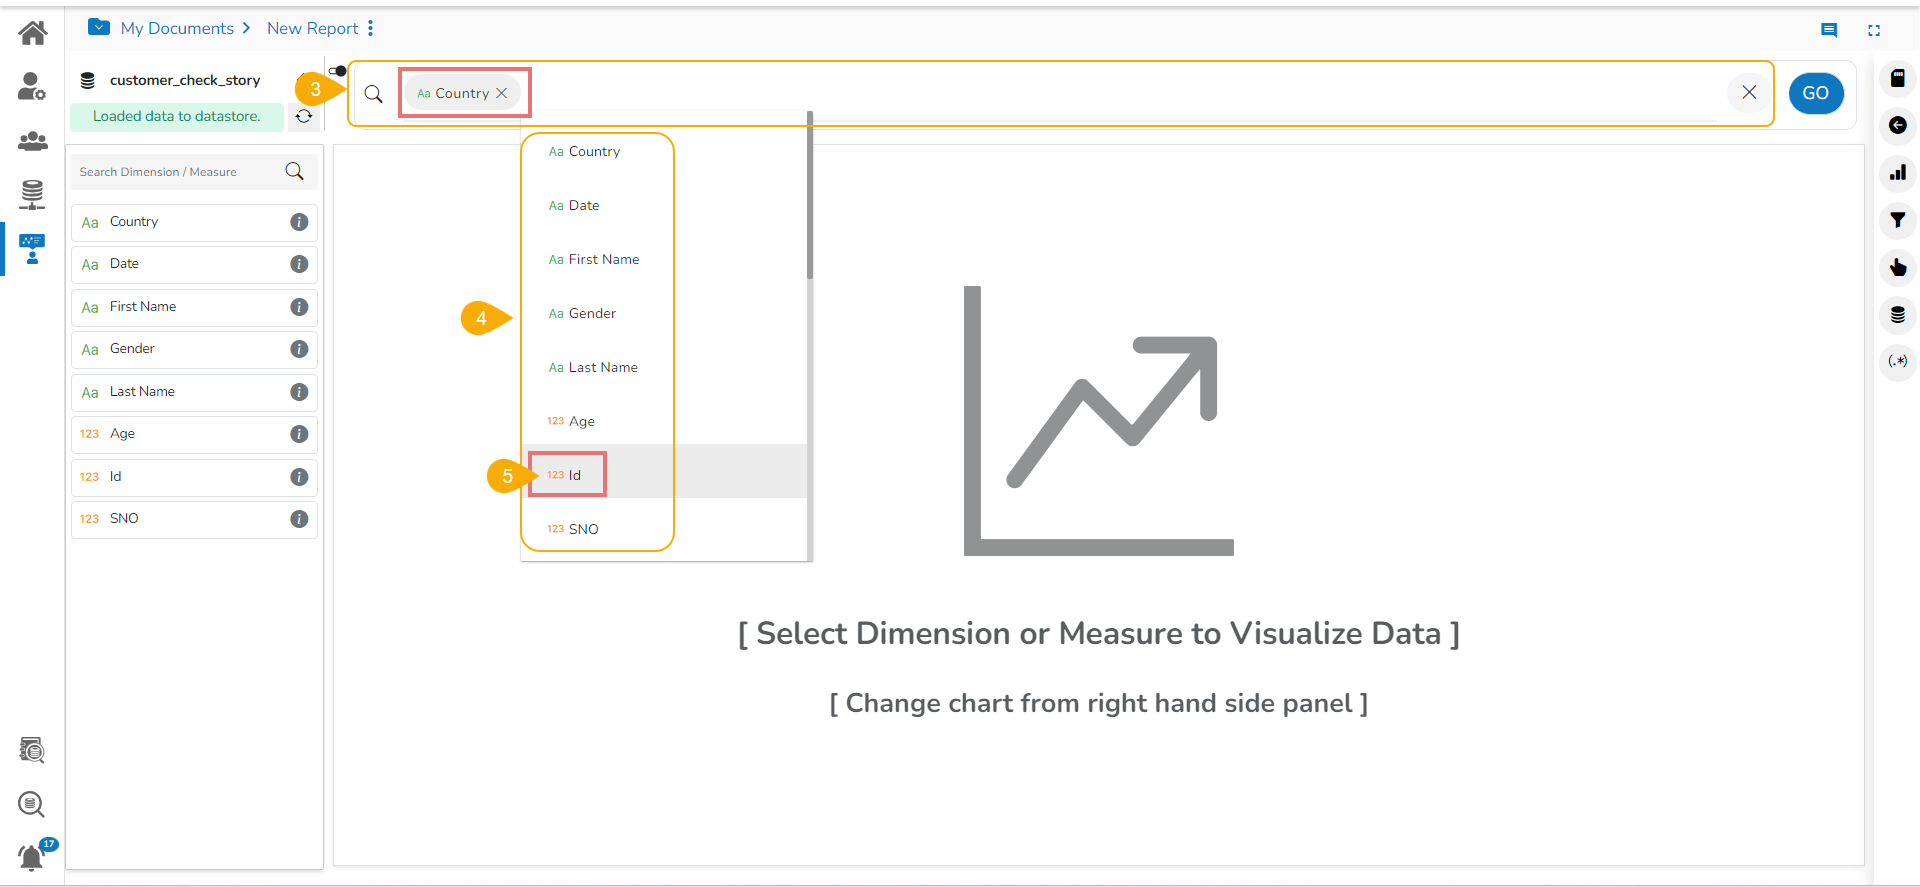
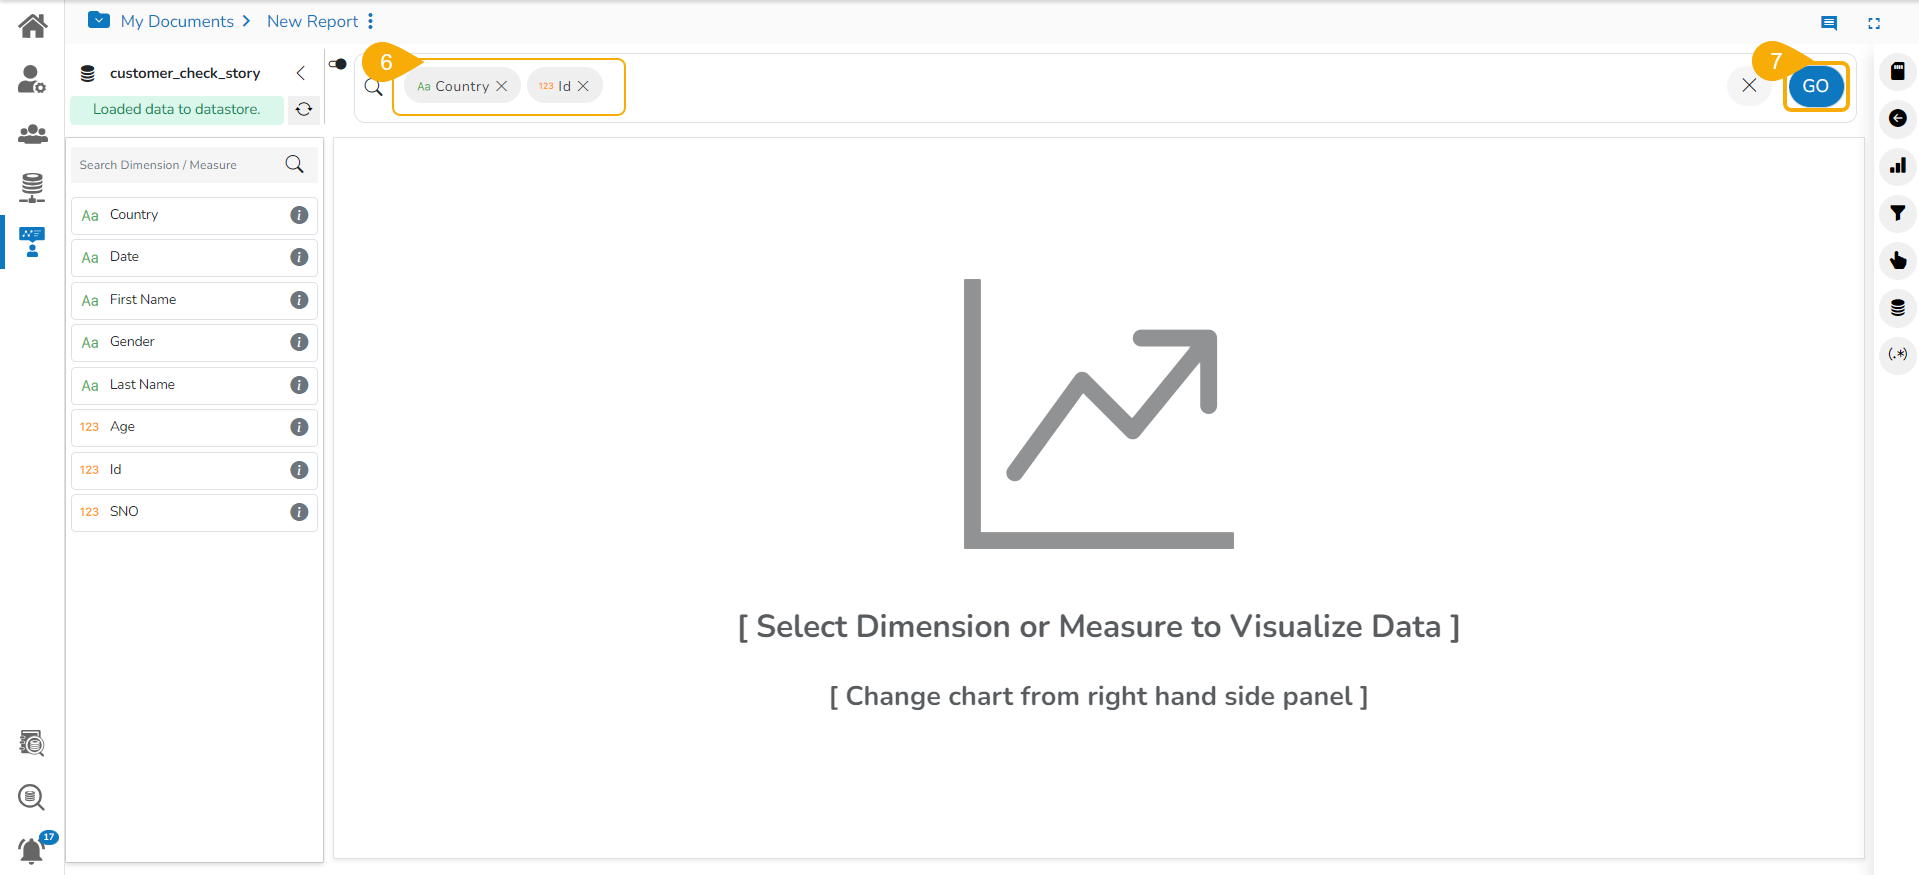
Designing a View
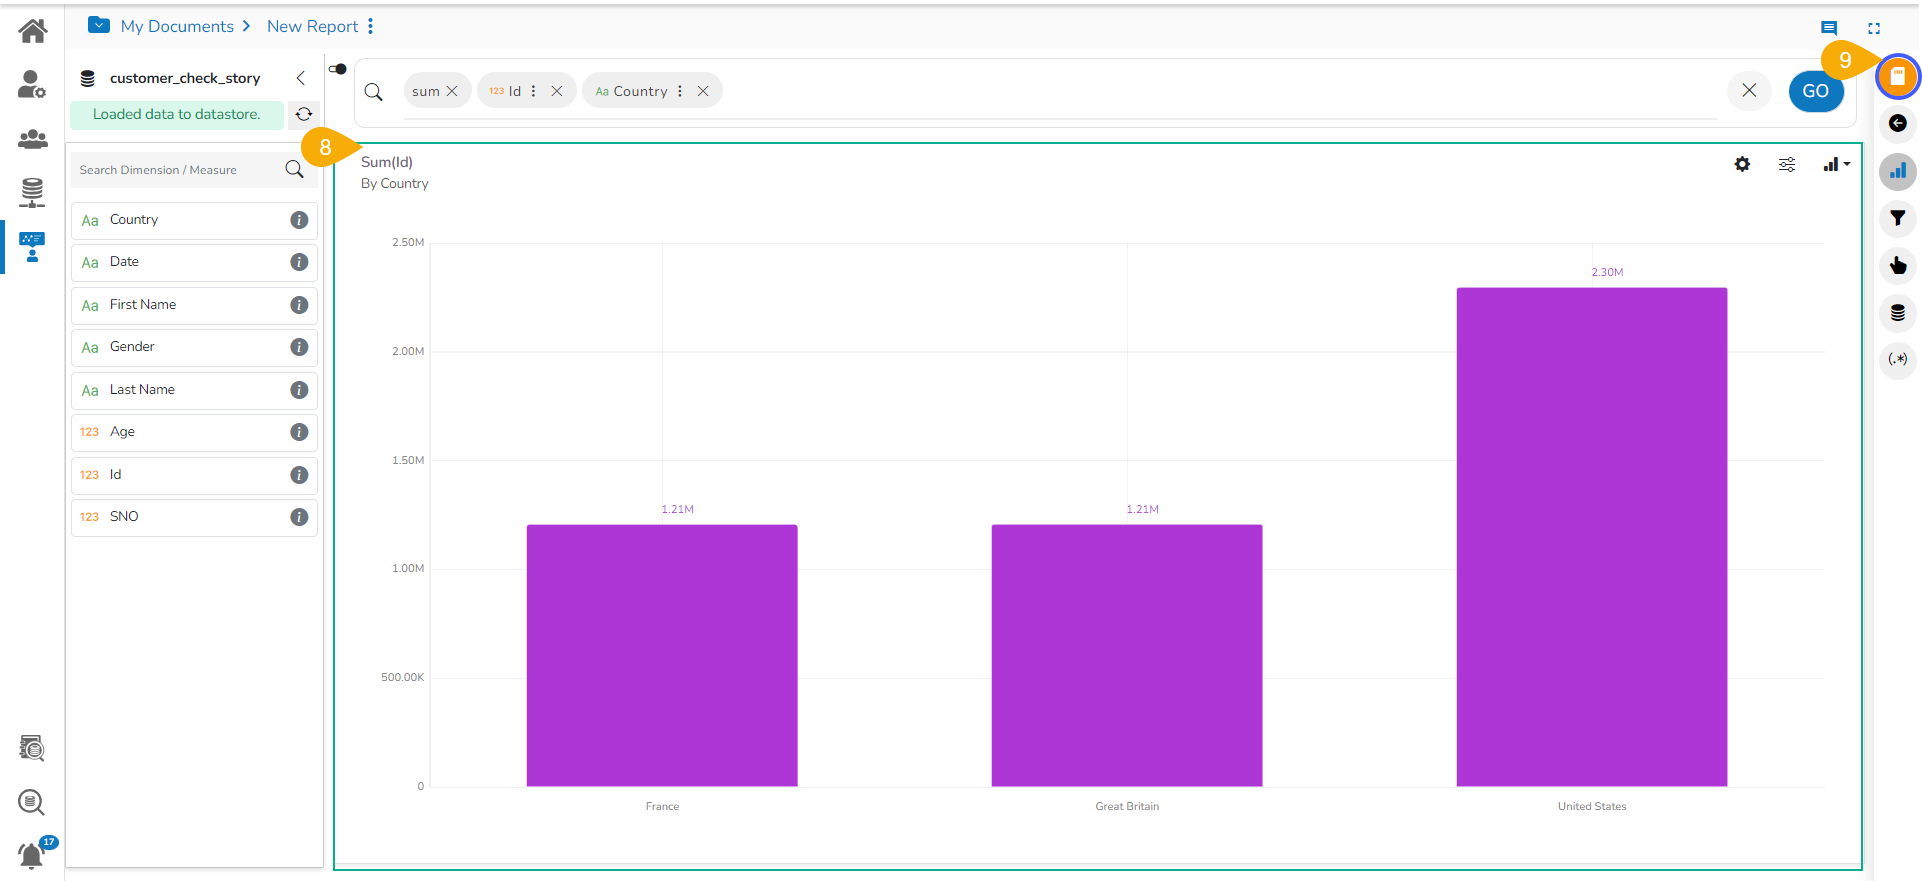
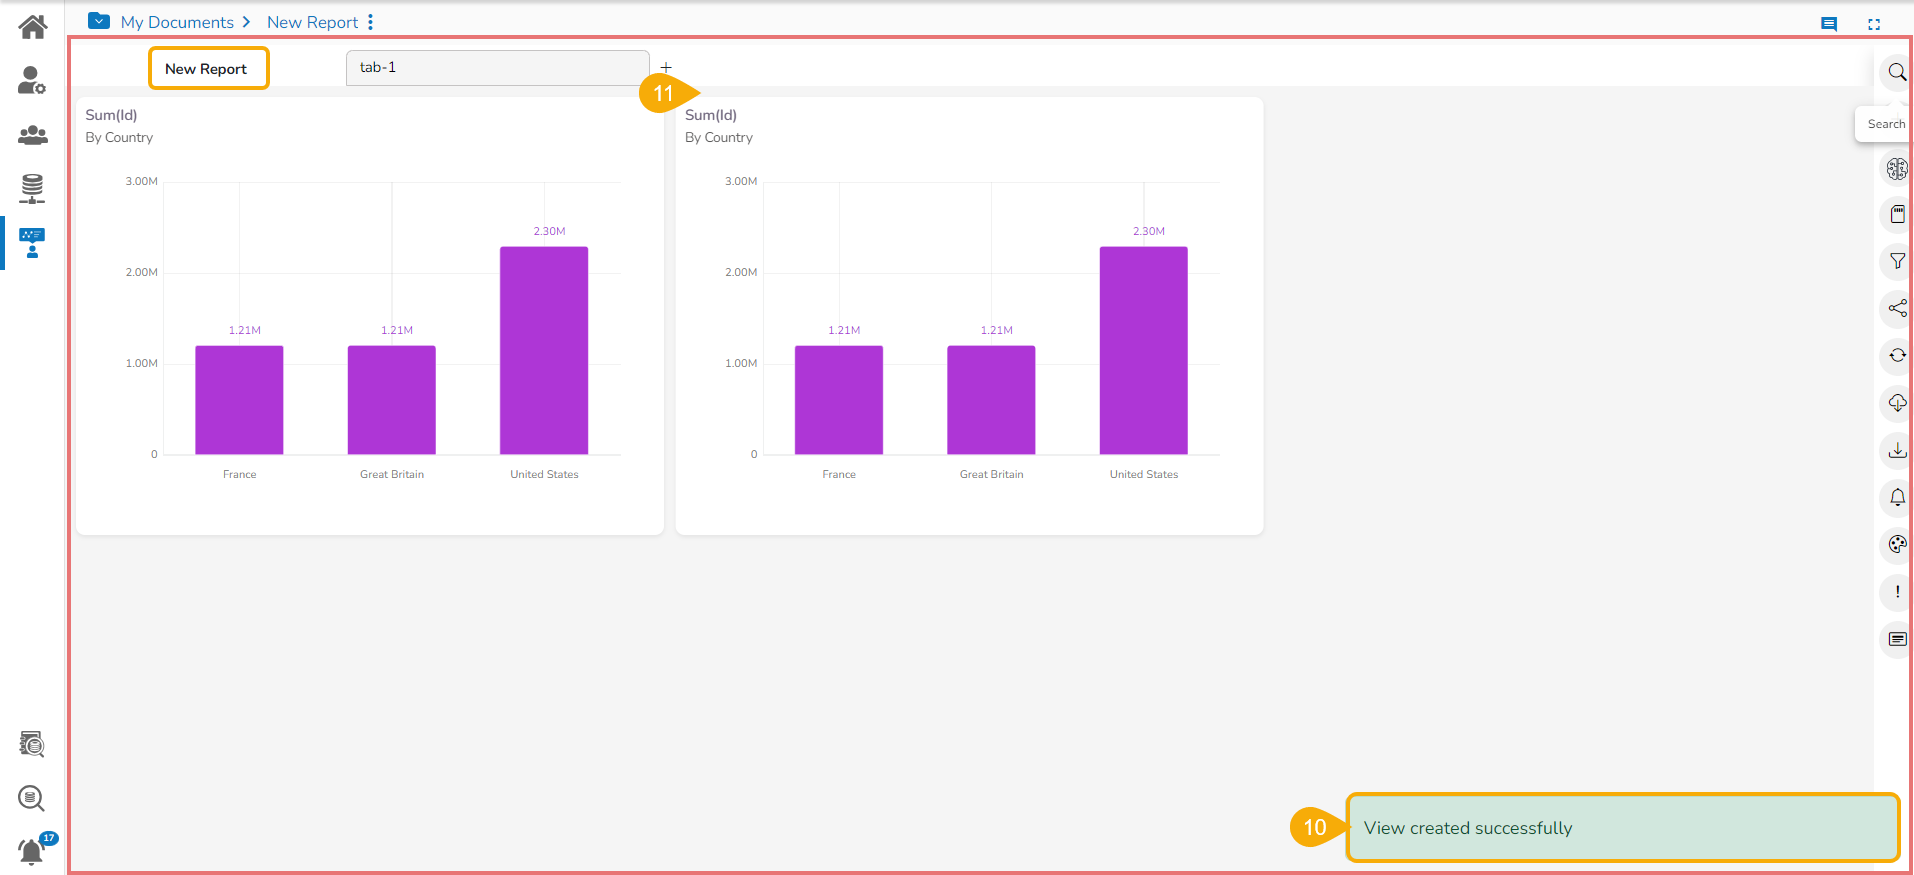
The user can start creating/ designing a View for a newly created Report by using the Design page or Design canvas.
Once the Report gets created, the user gets redirected to the Design page/ Design canvas to begin with the View creation.
Please Note: The reports based on the file uploads will support the Designing View functionality only after the data gets loaded to the data store.
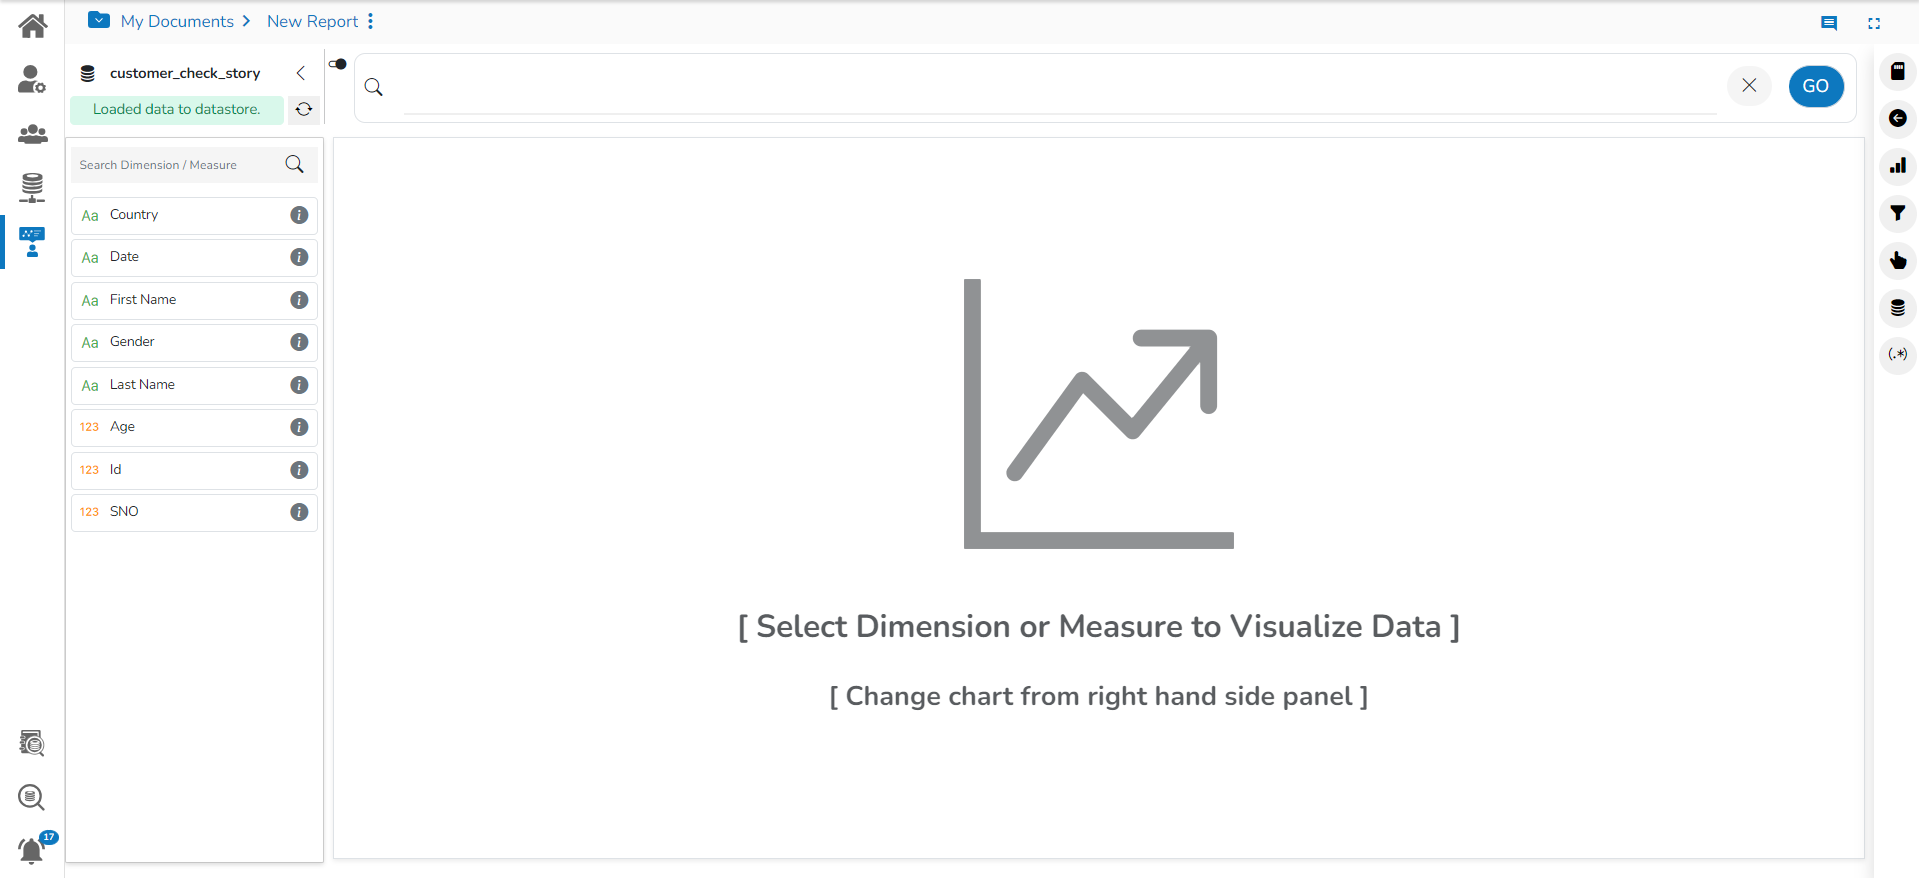
Designing a View with the Old UI
Navigate to the Design page.
Use the Switch UI icon to select the Old UI.
Drag and drop Dimensions/Measures to the suggested place or use double clicks on a Dimension or Measure value to get added in the specified place.
Instantly a view gets created using the Mixed chart (by default).
Click the Save View icon to save it.
A confirmation message appears.
The View gets saved on the final screen of the Report.
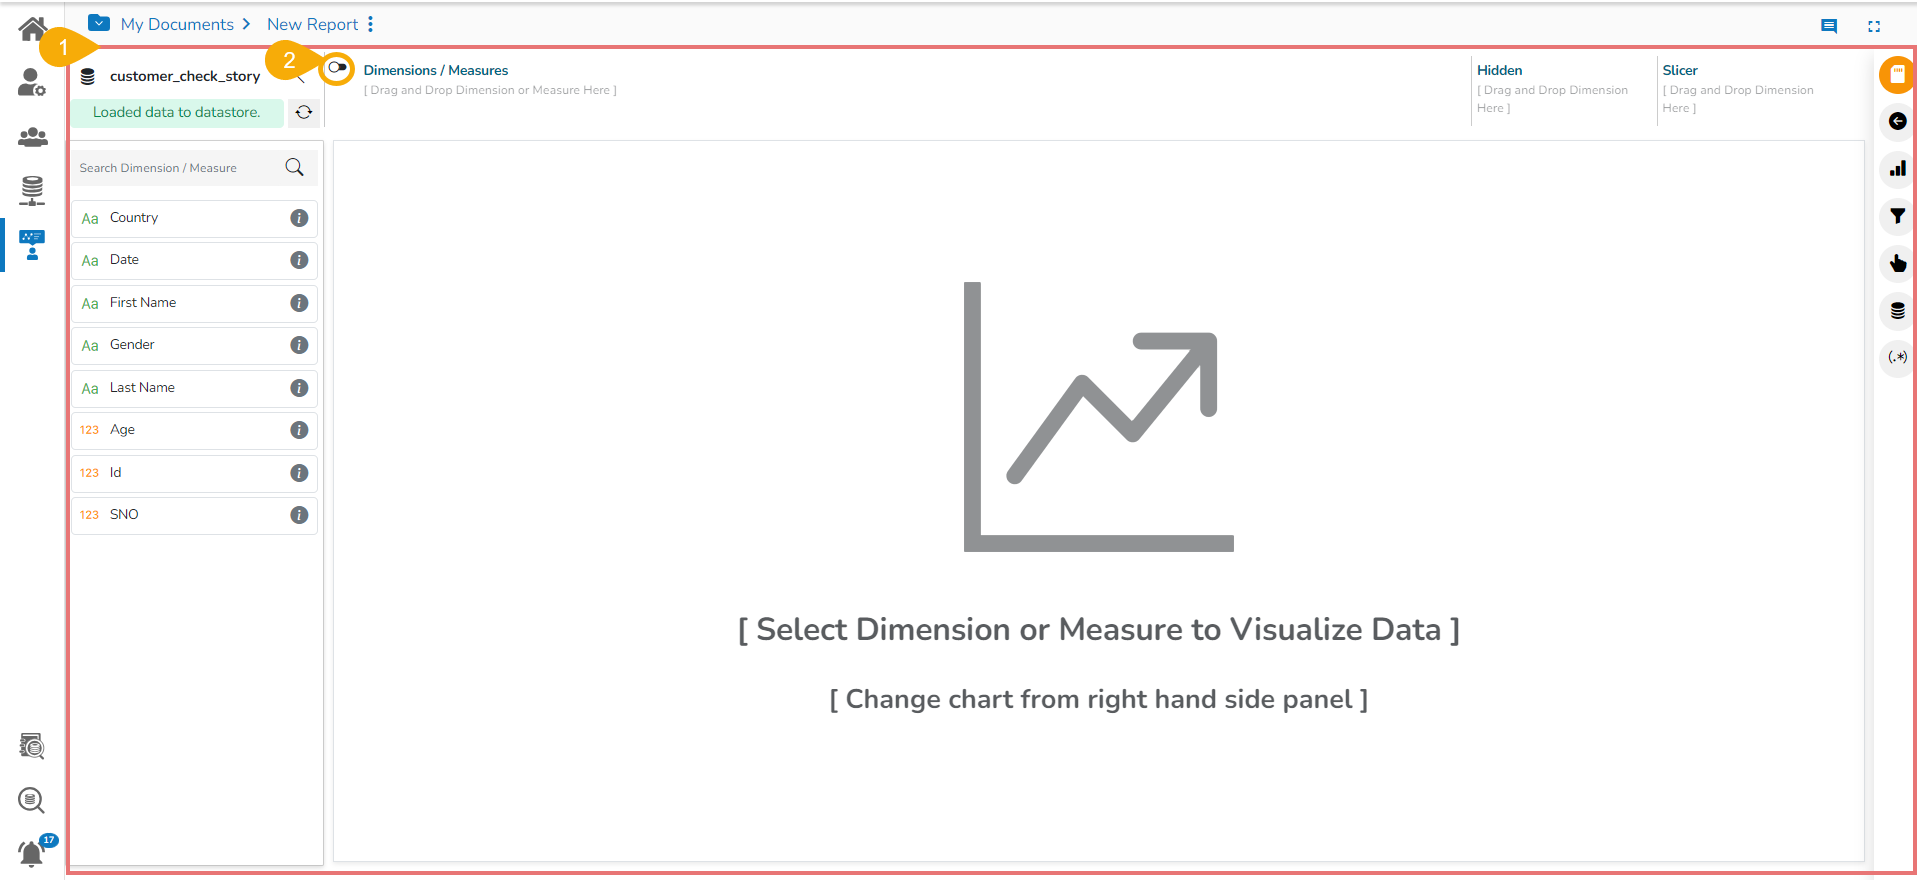
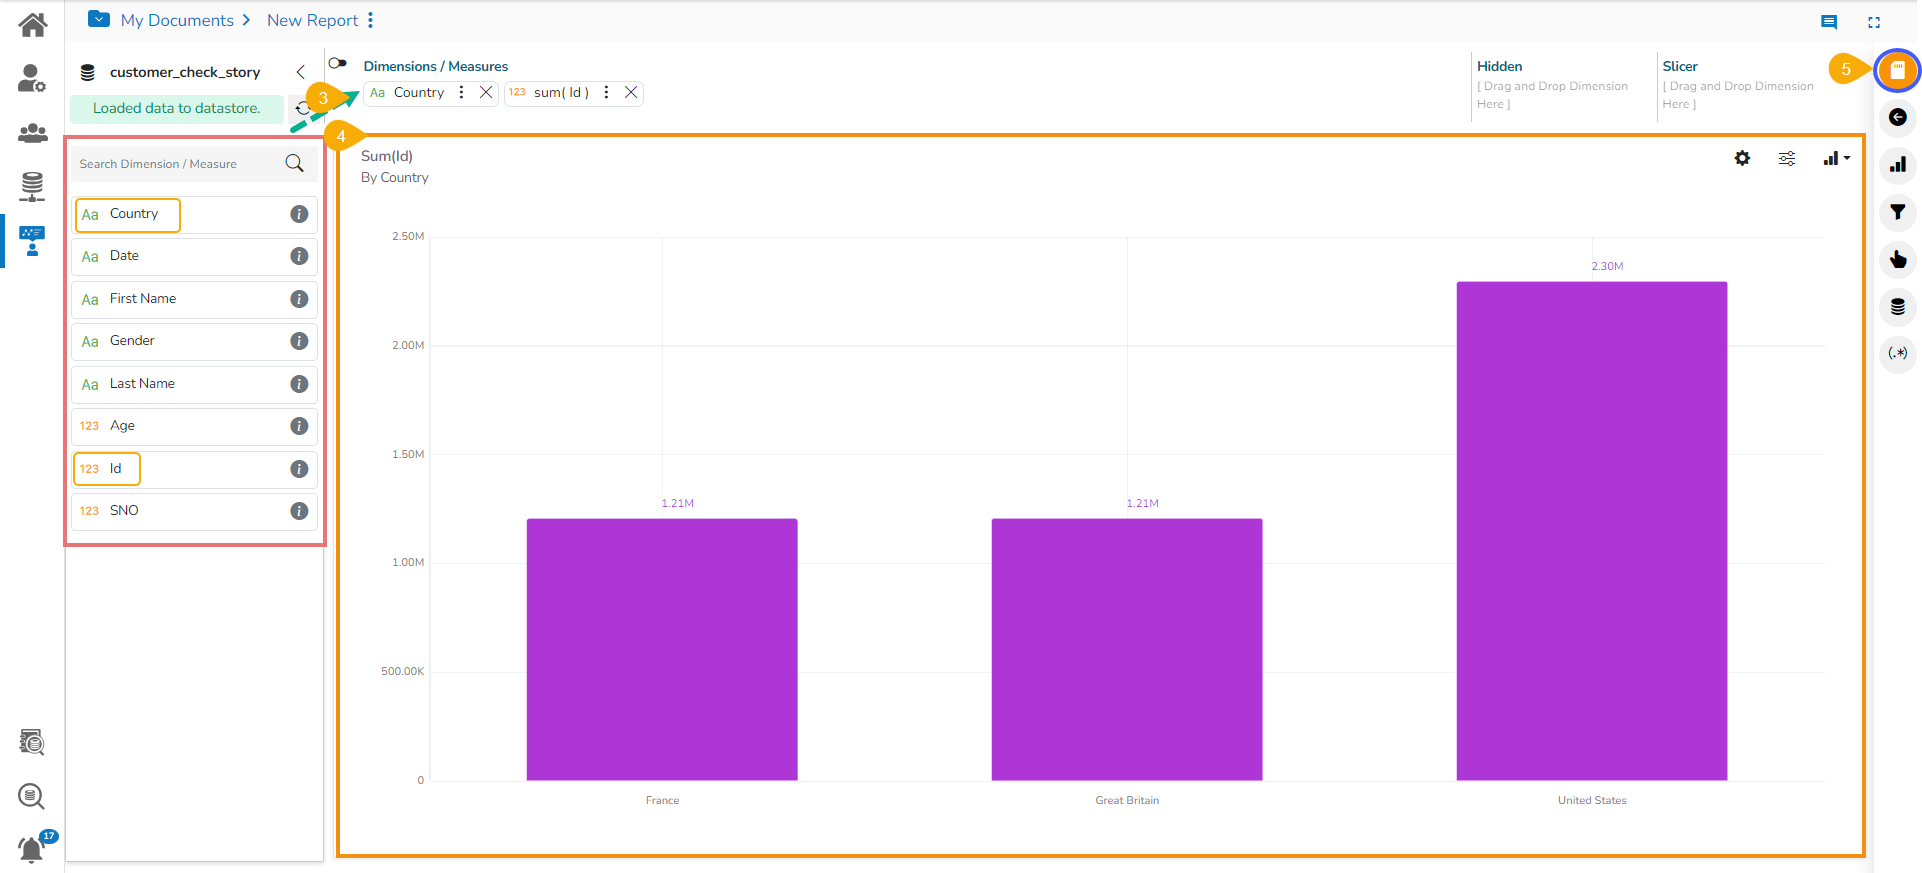
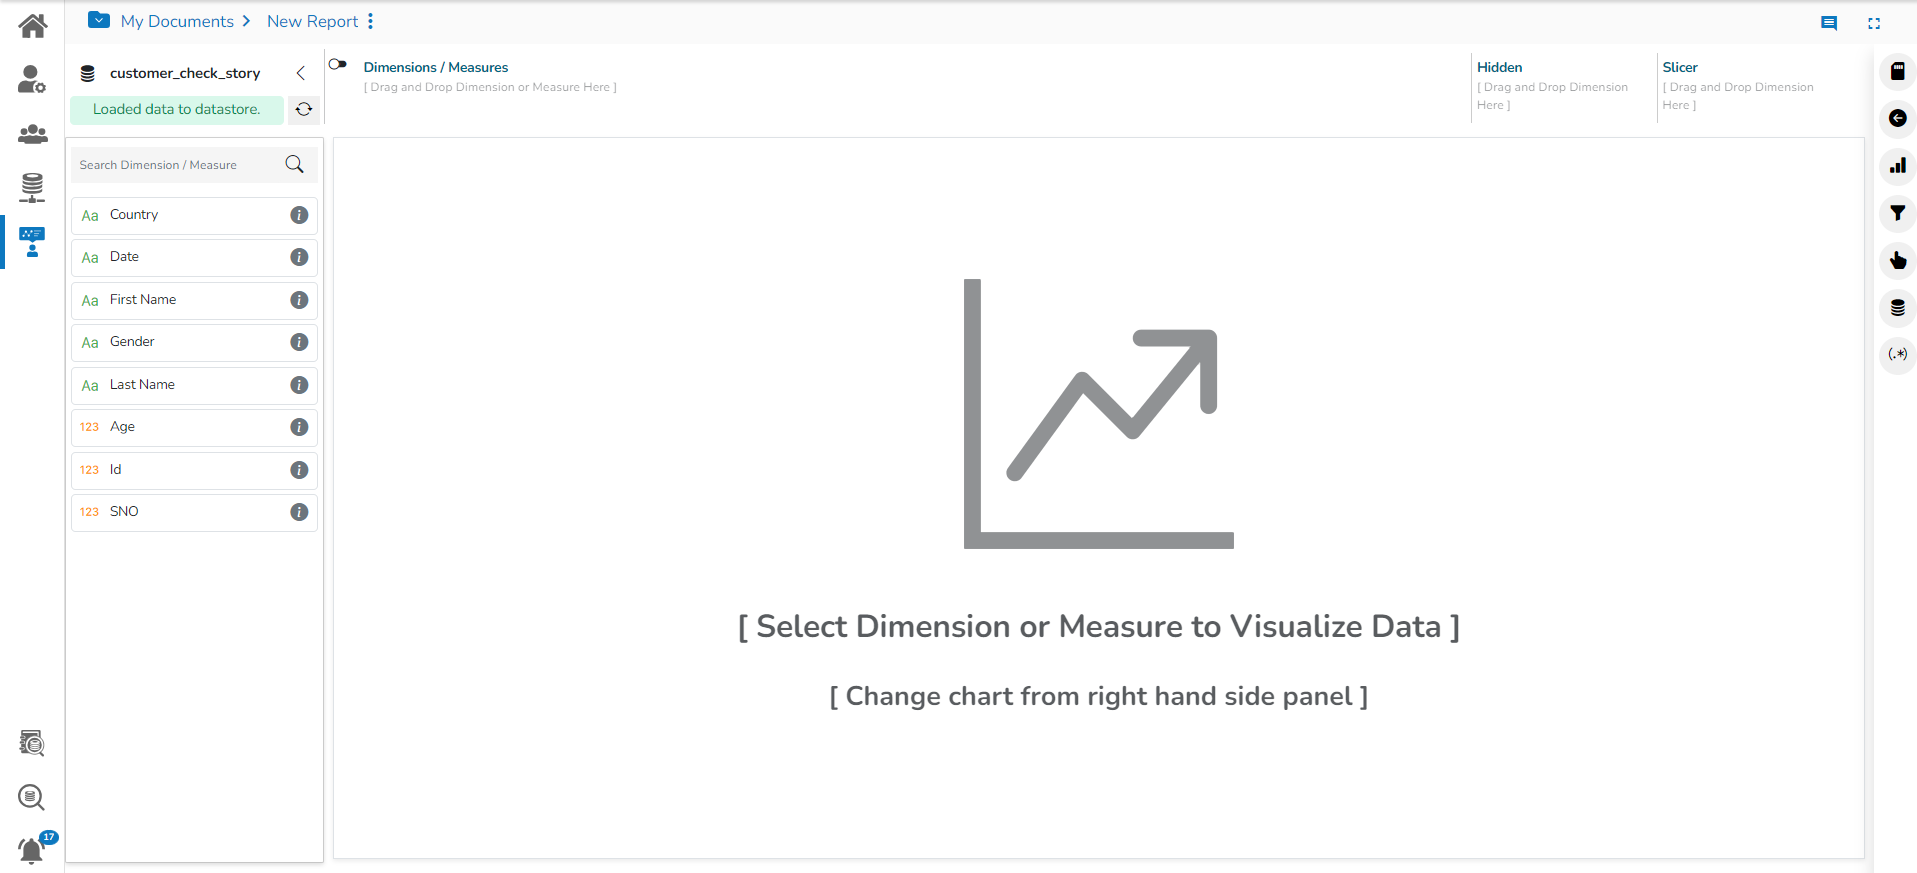
Designing a View with the New UI
Navigate to the Design page.
Use the Switch UI icon to select the New UI.
Use the Search bar provided at the top of the page.
By using the left click in the Search bar all the available Dimensions and Measures under the selected Datastore get listed.
Choose the desired combination of the Dimension and Measures with a click.
The selected combination of the Dimension and Measures will be added to the Search bar.
Click the GO option.
Instantly a view gets created using the Mixed chart (by default).
Click the Save View icon to save it.
A confirmation message appears.
The View gets saved on the final screen of the Report.
Please Note:
Refer to the Design section of this document for a detailed understanding of the Design page options.
The user can select another charting component from the Chart tab to change the default visual display of the newly created View.
Use the Properties tab to set the chart-specific properties and enhance the look and feel of the newly created View.
Last updated