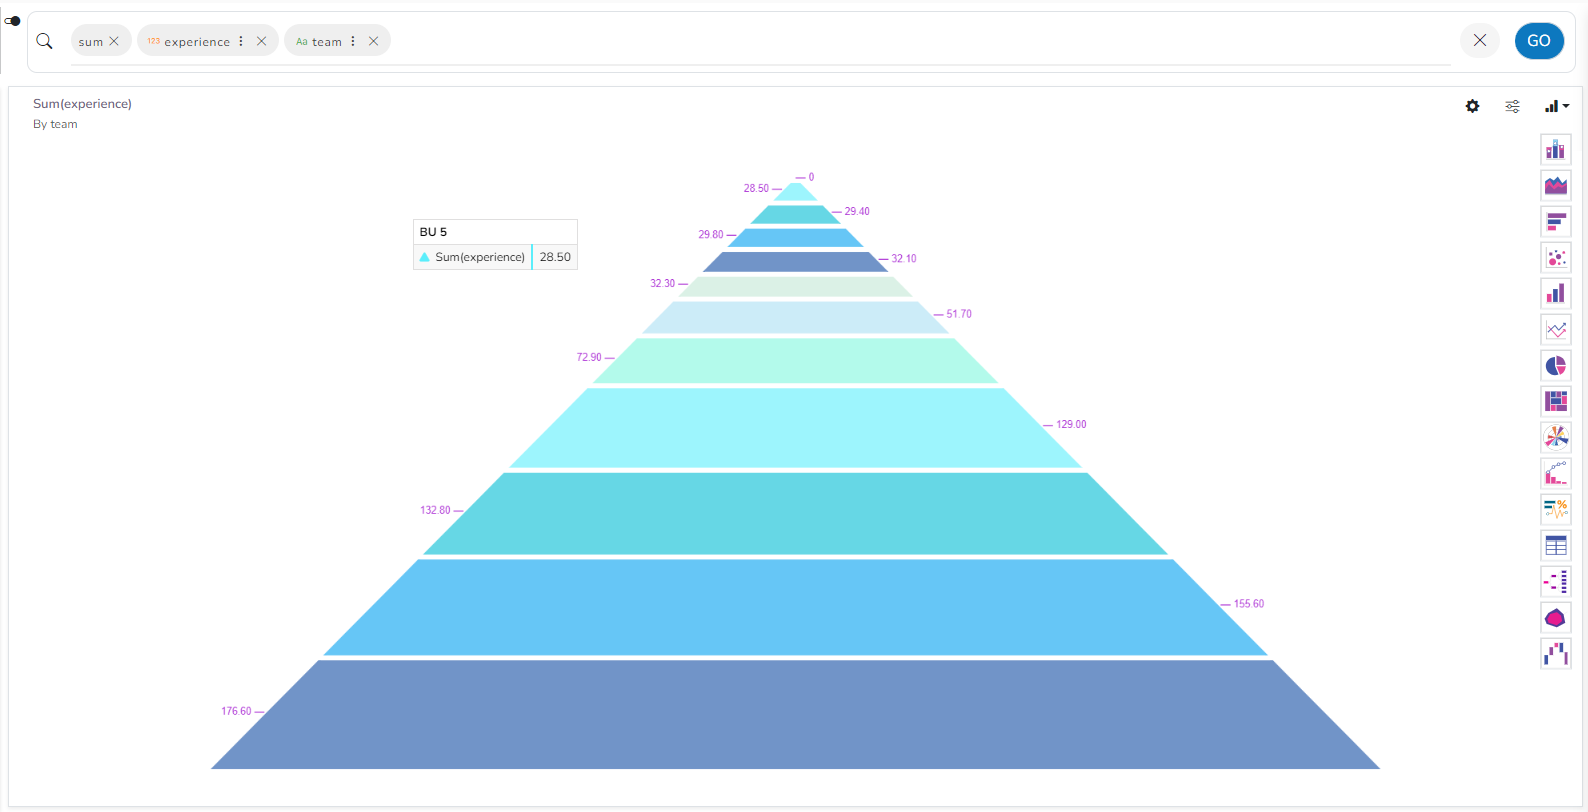
Inverted Funnel chart
Check out the given walk-through on the Properties of the inverted Funnel chart.
Inverted Funnel charts are a great way to track progress through a workflow with multiple steps. They can highlight how well a process is being followed and easily identify any bottlenecks.
The users can invert the funnel chart to see things from a different point of view. It widens at the bottom and narrows at the top pinpointing the various phases in a classified structure. This chart can be used to see the hierarchical structure of an organization or distribution process of fund/salary/profit etc.
Best Situations to Use a Inverted Funnel chart
To display hierarchical pattern
Example:
To categorize the administrative structure in an organization

Properties
General Settings
Exclude Global Filter: The view gets excluded from the Global Filter condition by putting a checkmark in the box.
Show Data Label: Data label gets displayed by using a checkmark in the given box.
Show Legend: Provide a checkmark in the box to display Legend. After enabling ‘Show Legend,’ users need to select the following information:
Show Percentage: Provide a checkmark in the box to display percentage.
Please Note: At present the supported Legend Style is Floating only.
Series Color
Click the Add Color option to insert new colors to the series or modify the added color.

The selected color gets added to the series.
View Filter: Select a filter option from drop-down menu.

Insights
Text: Provide any information regarding the chart. If any digit or character is required to be highlighted, put it inside two asterisks. (E.g., *70%* or *skills*).
Font Size: Set/modify Font Size of the Insights text.
Font Color: Select a Font color for the Insights Text.
Text align: There are three alignments to align the text.
Left
Right
Centre
Position: There are two options to position the text.
Bottom
Right

Last updated