
Global Filter
The Global filter is meant for the entire Report. It is available on the final page of a Report.
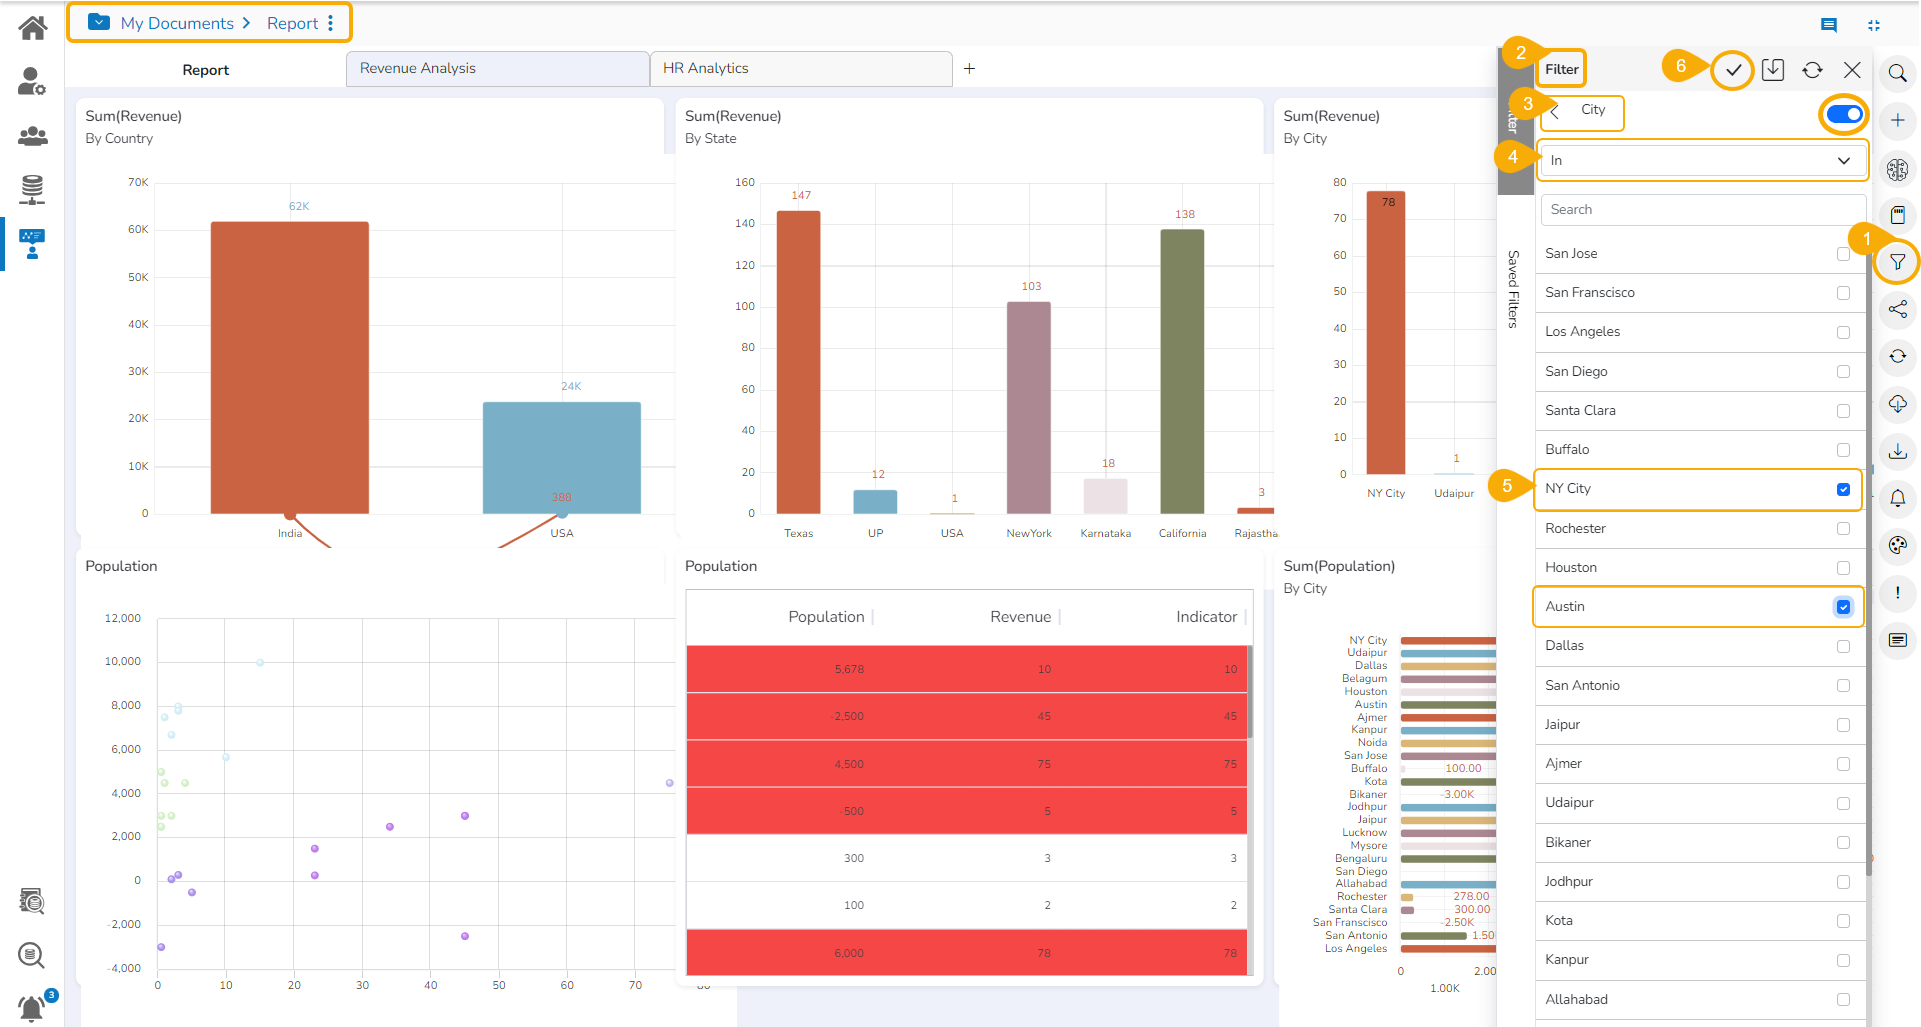
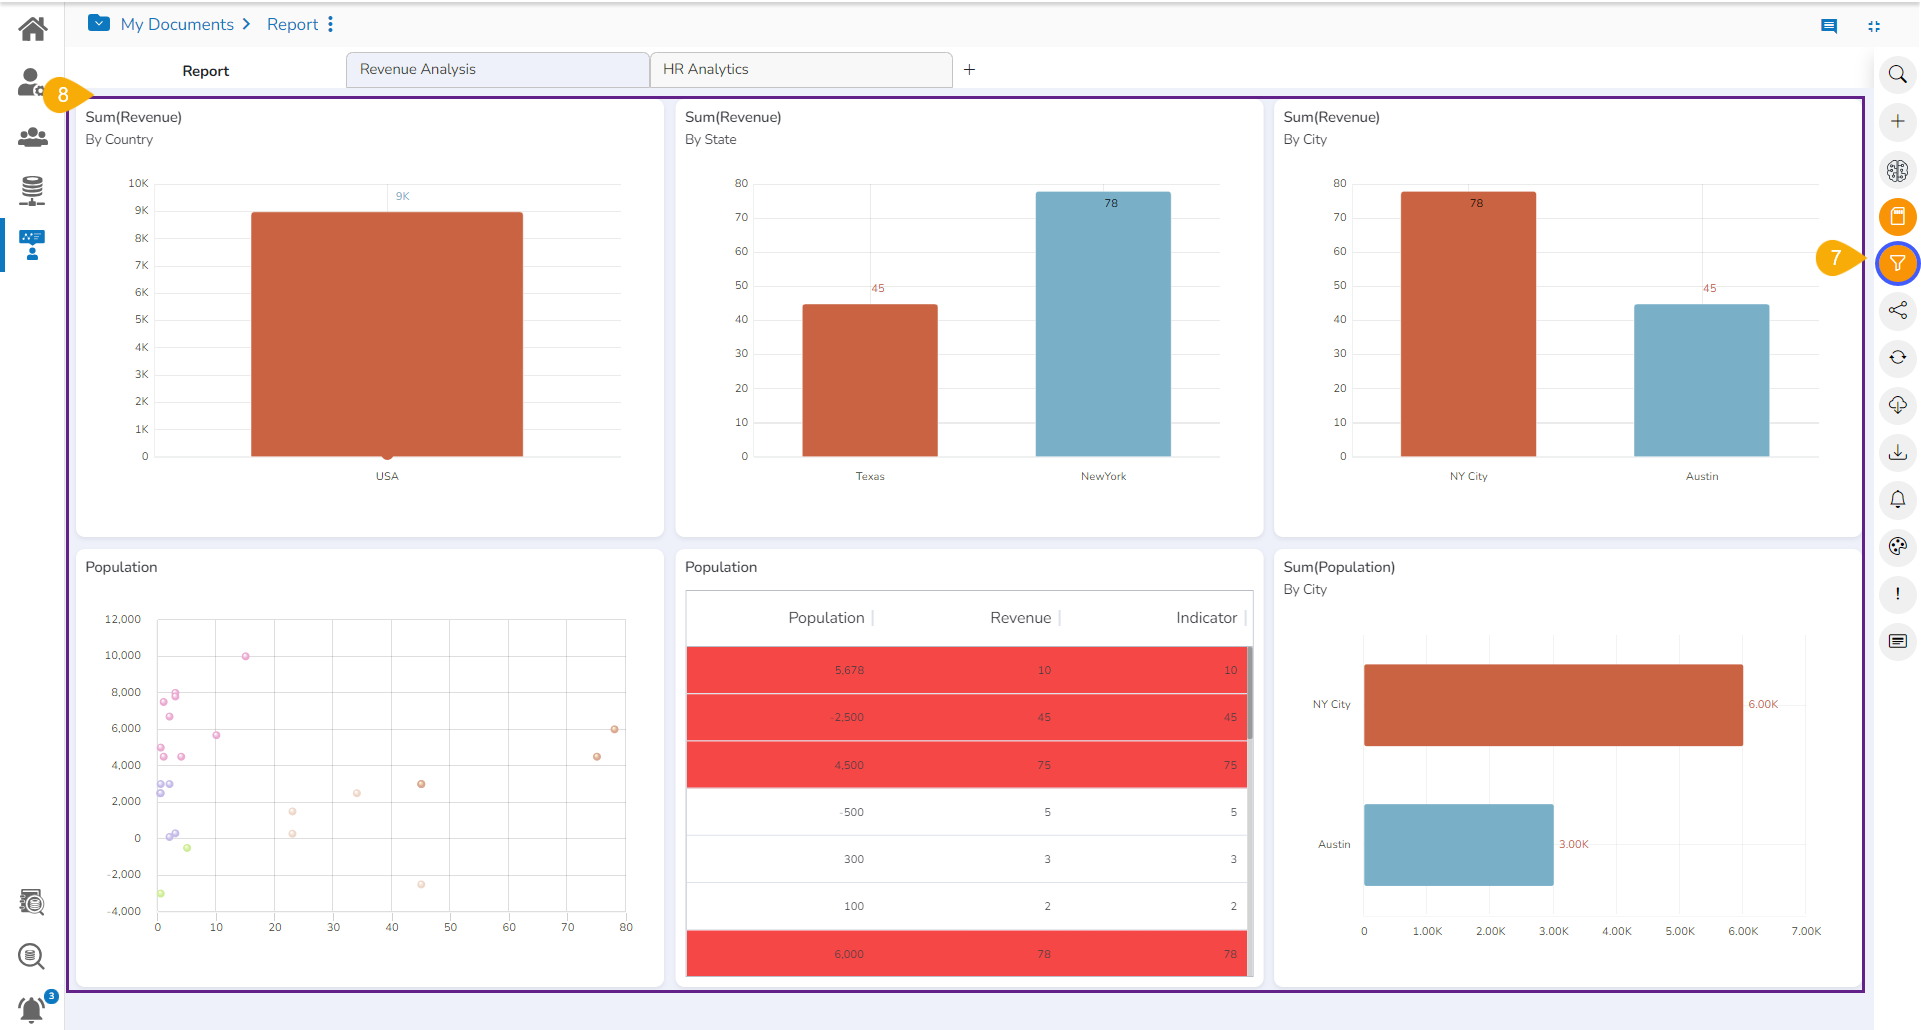
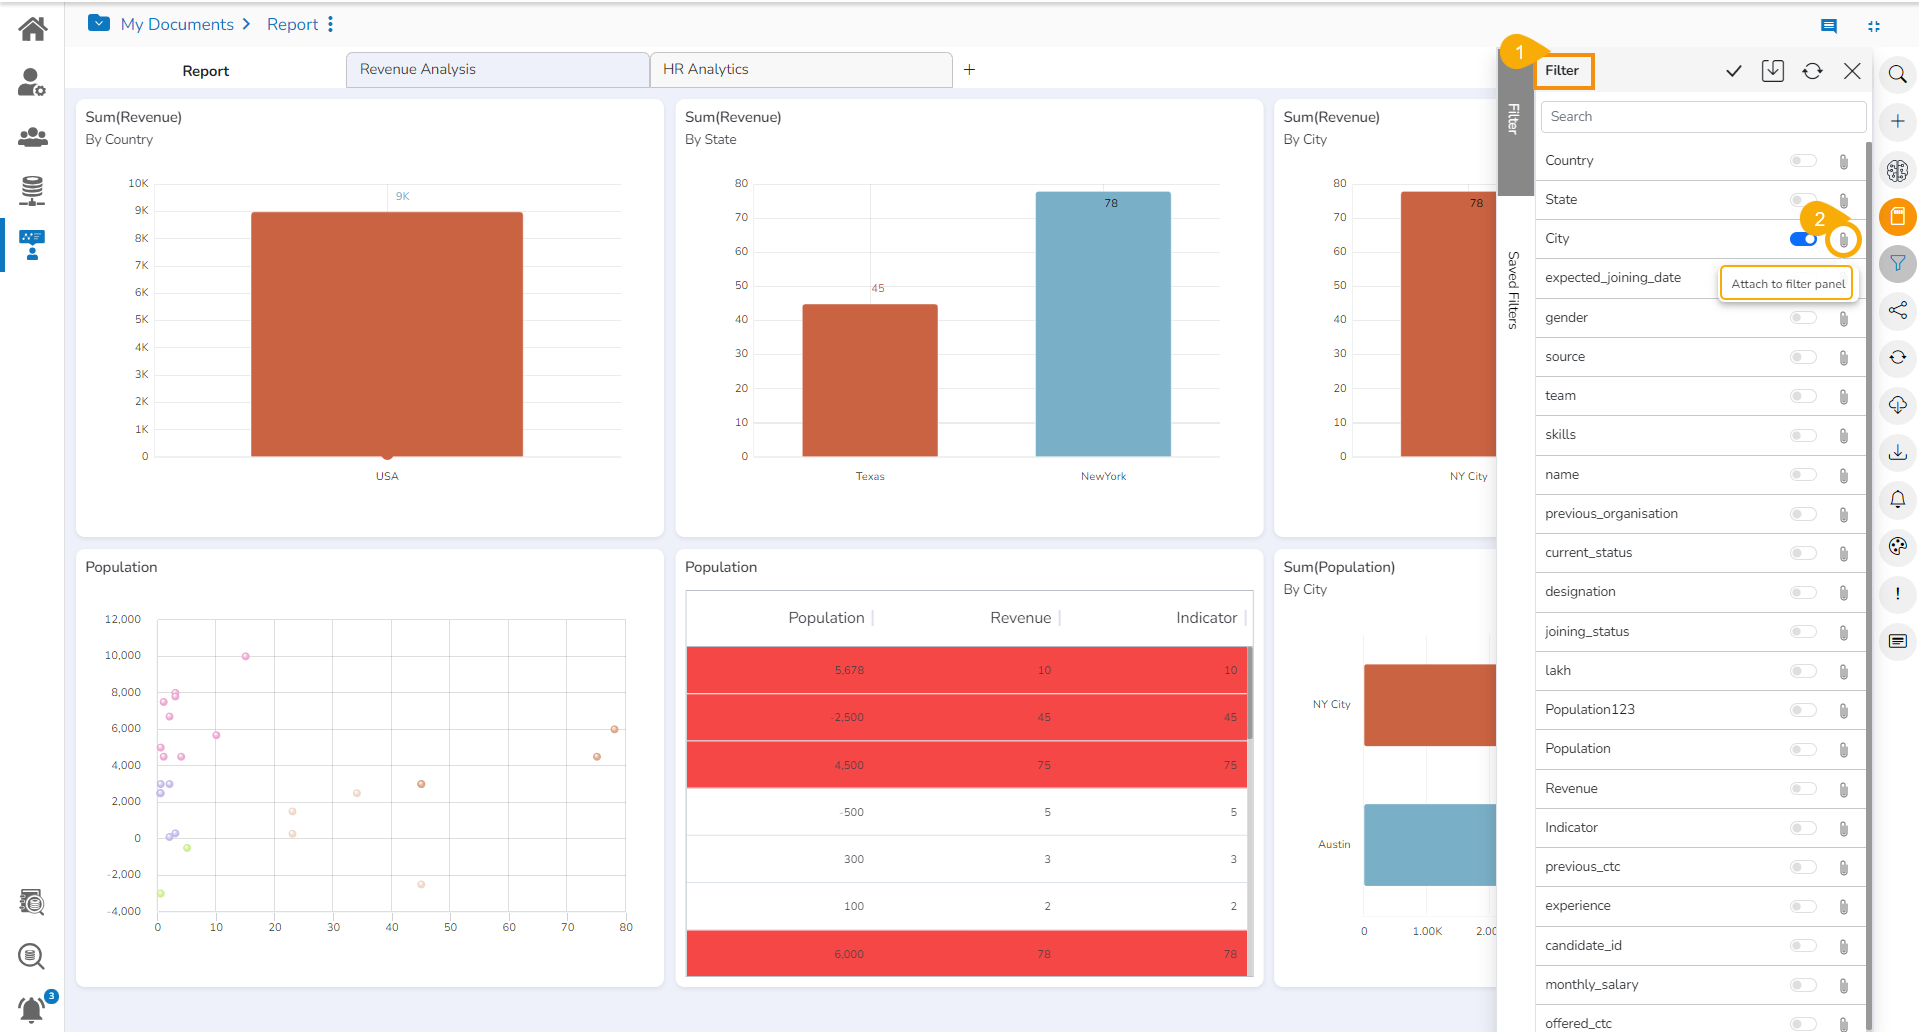
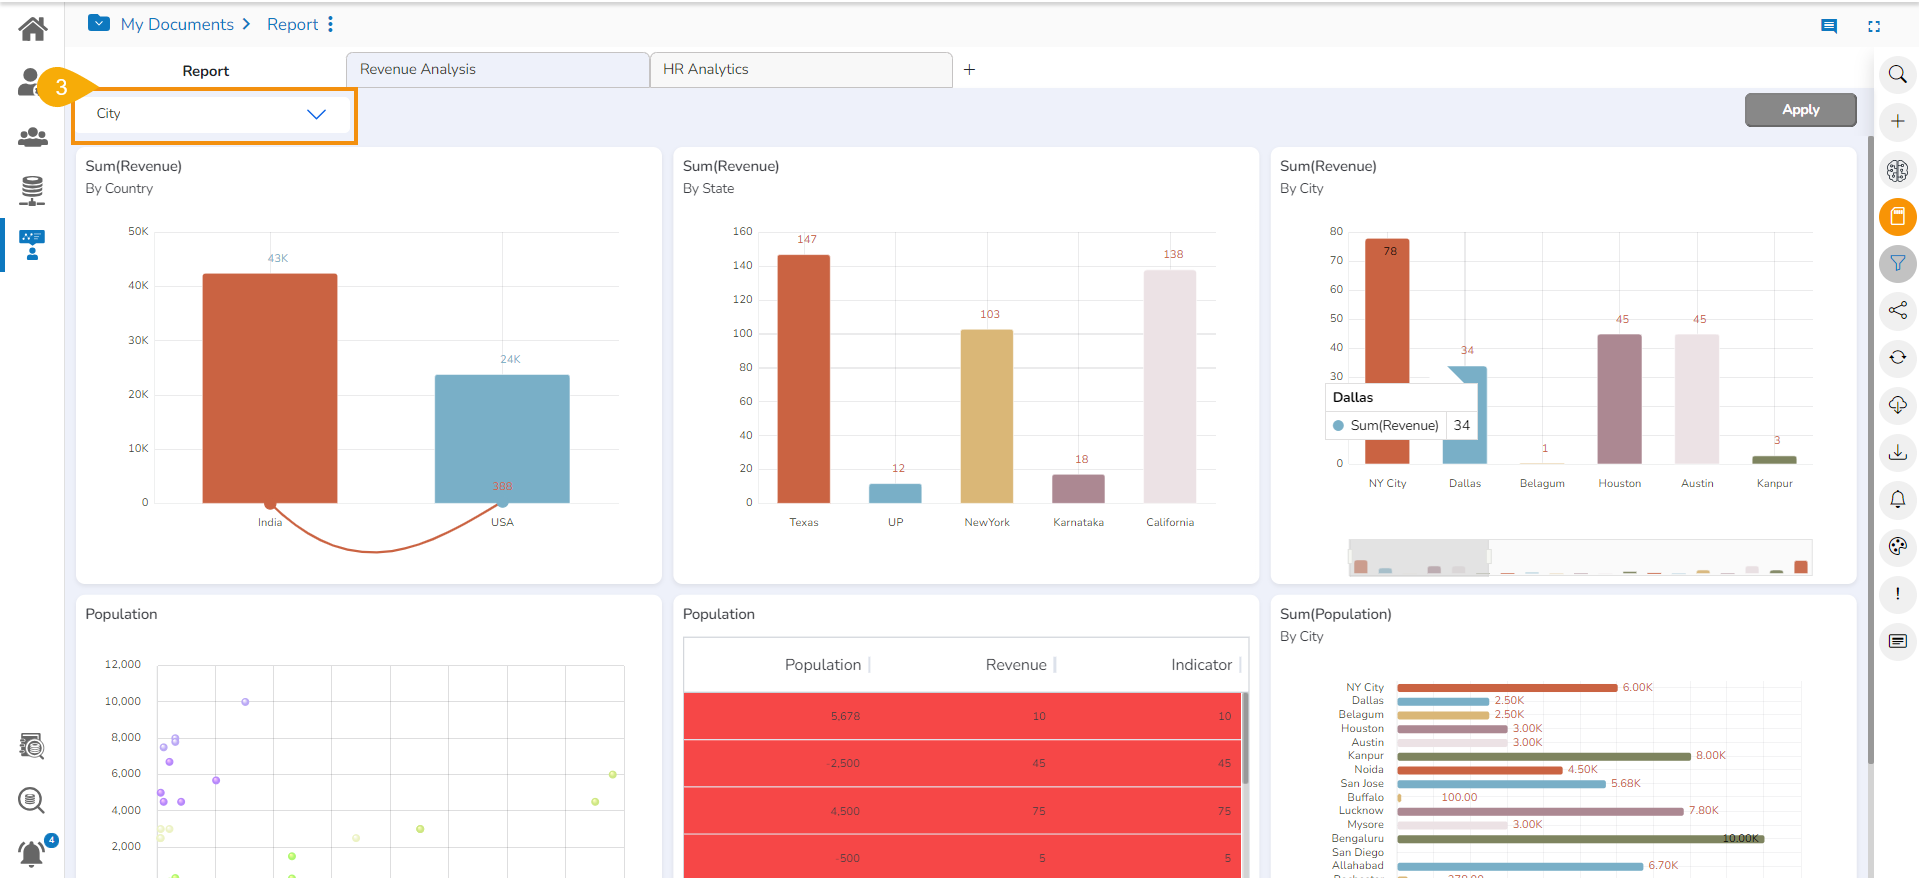
Applying Global Filter
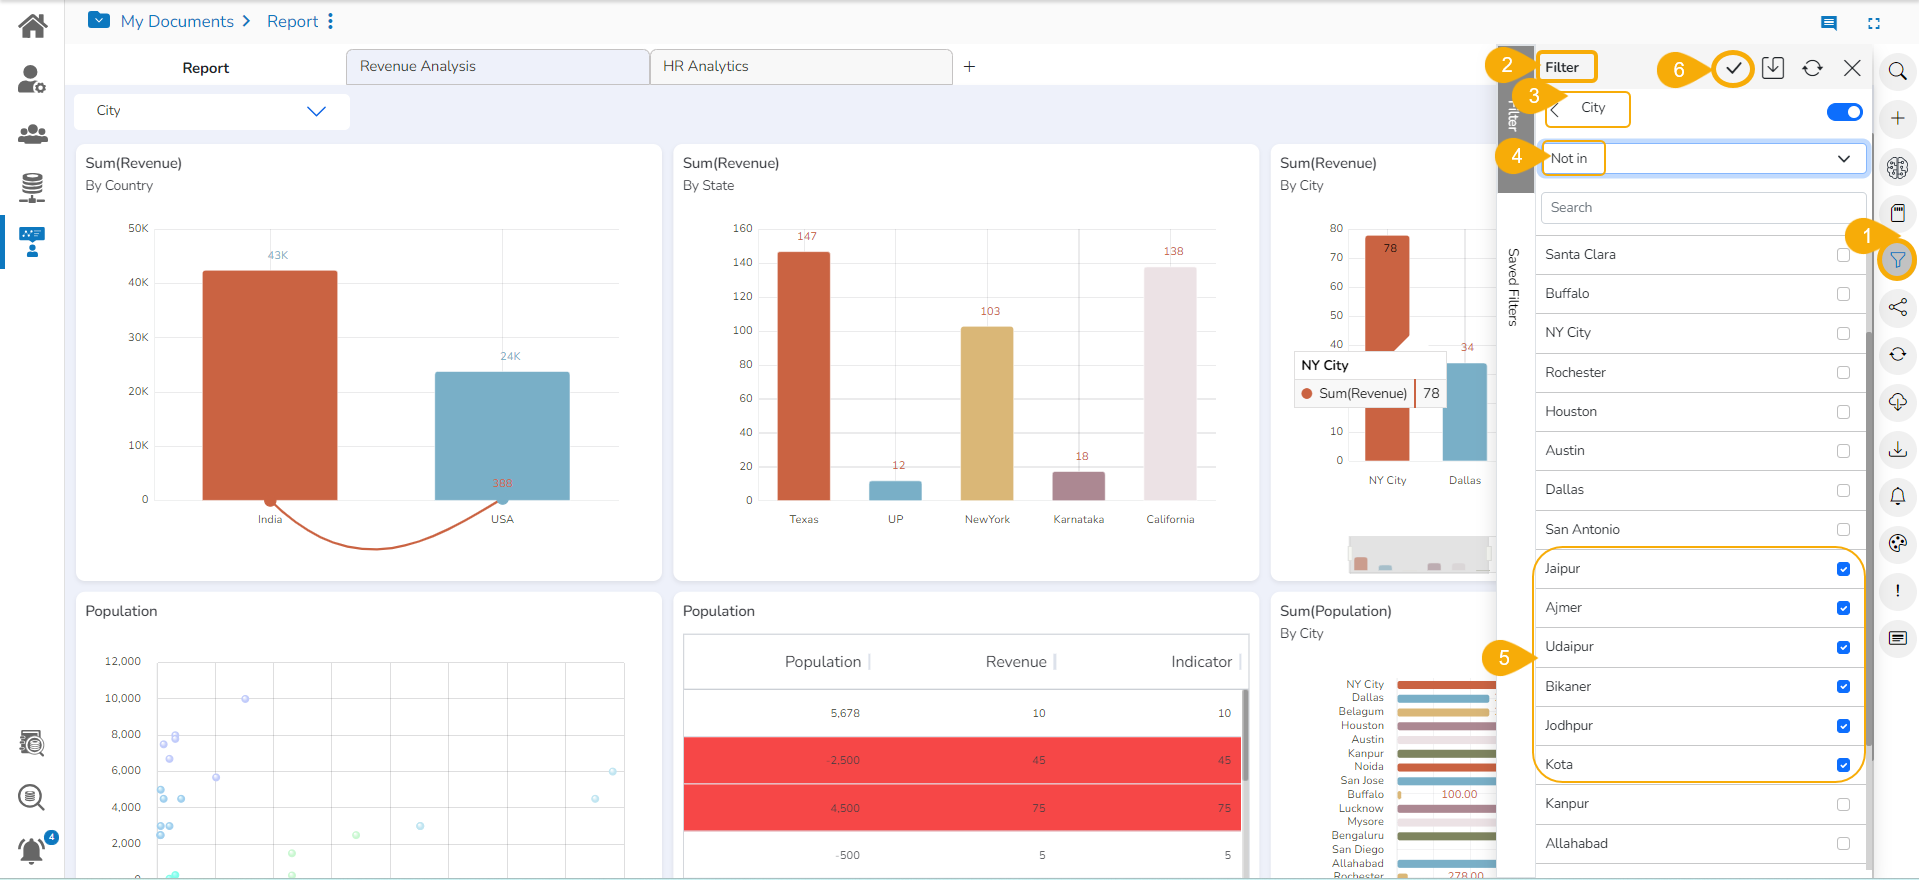
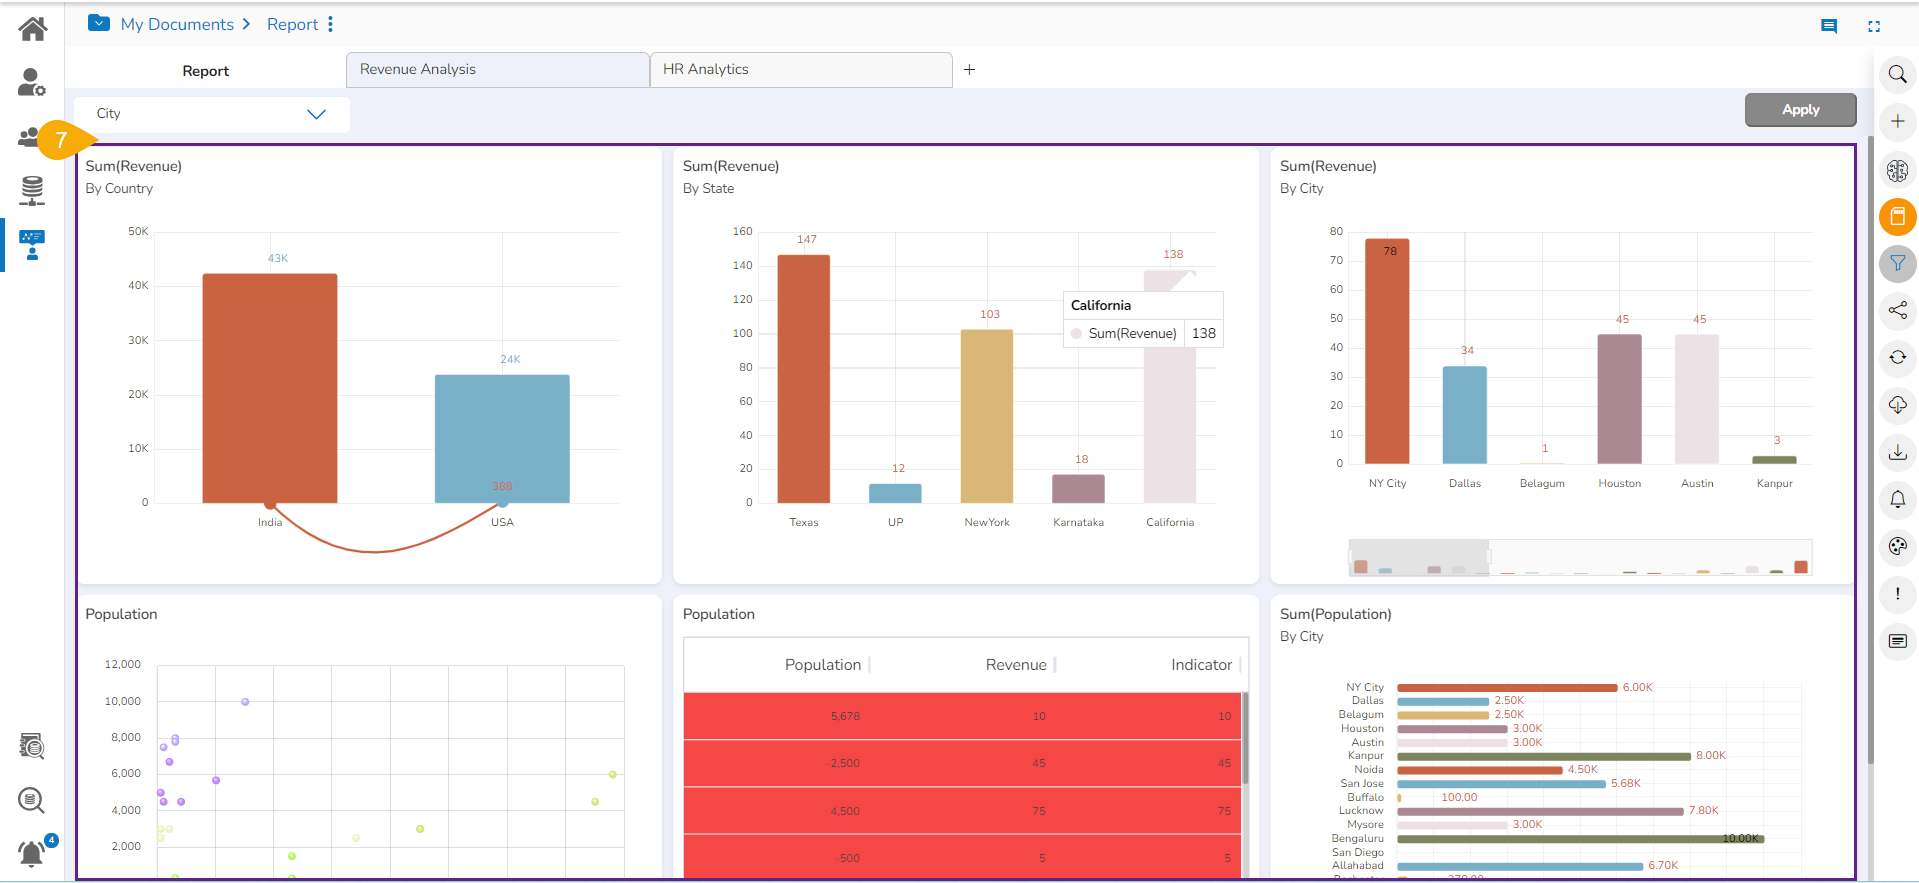
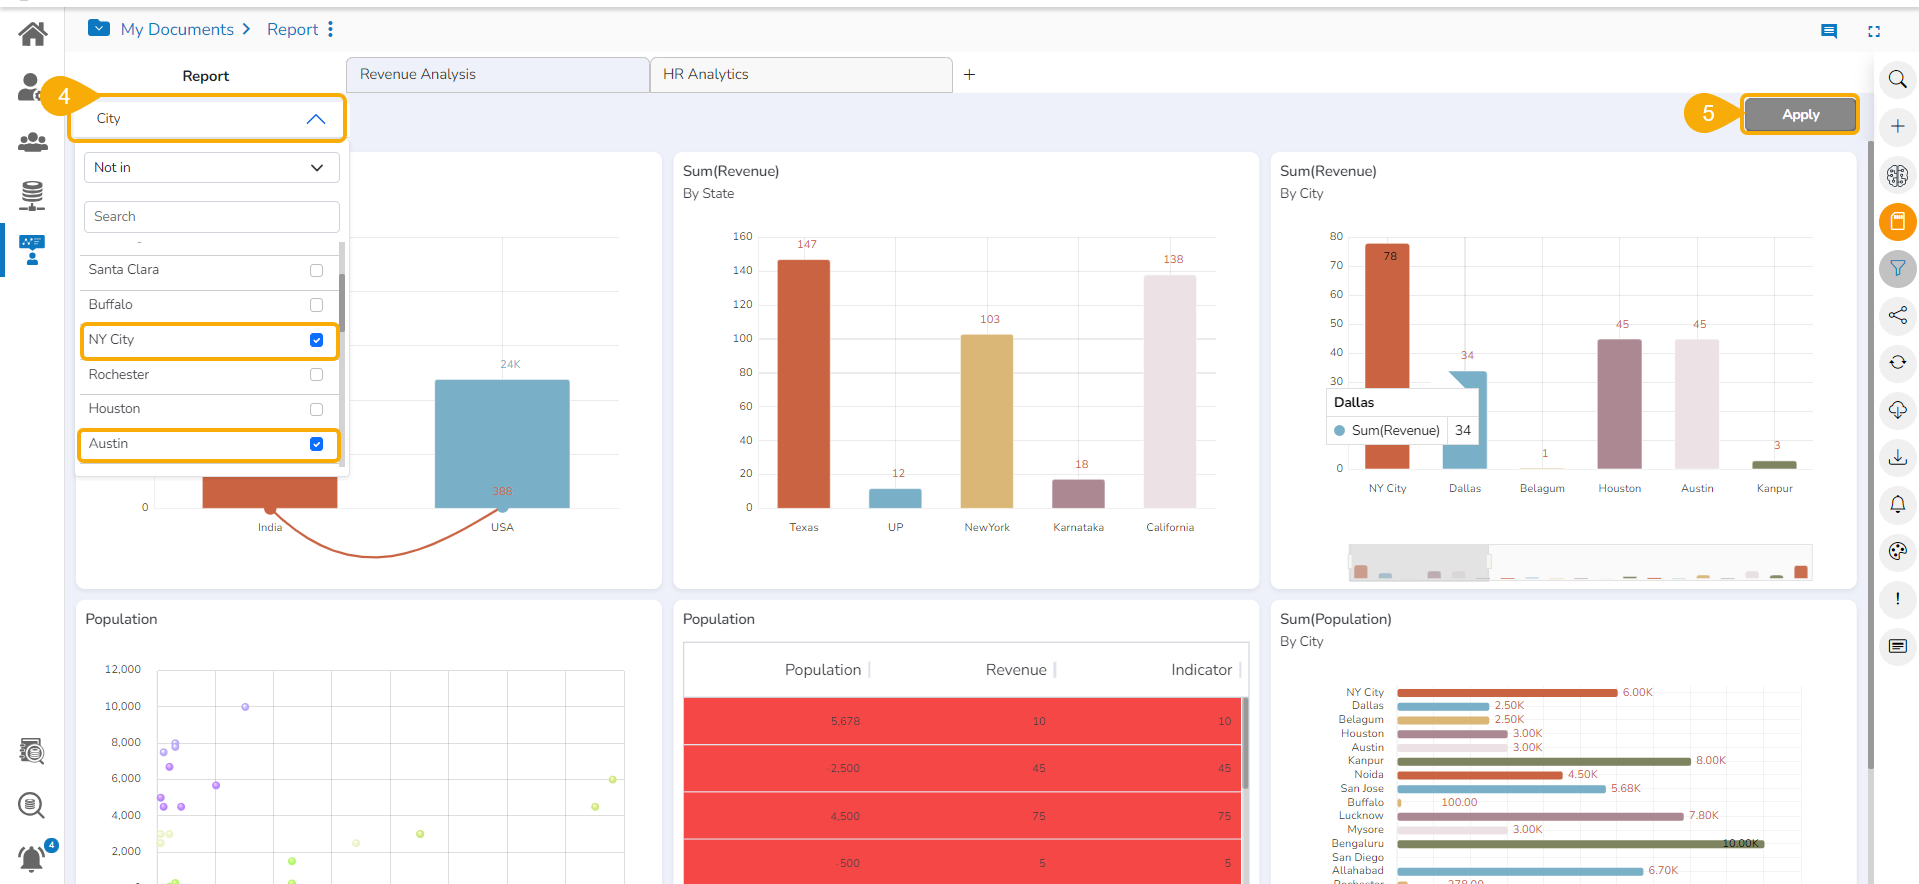
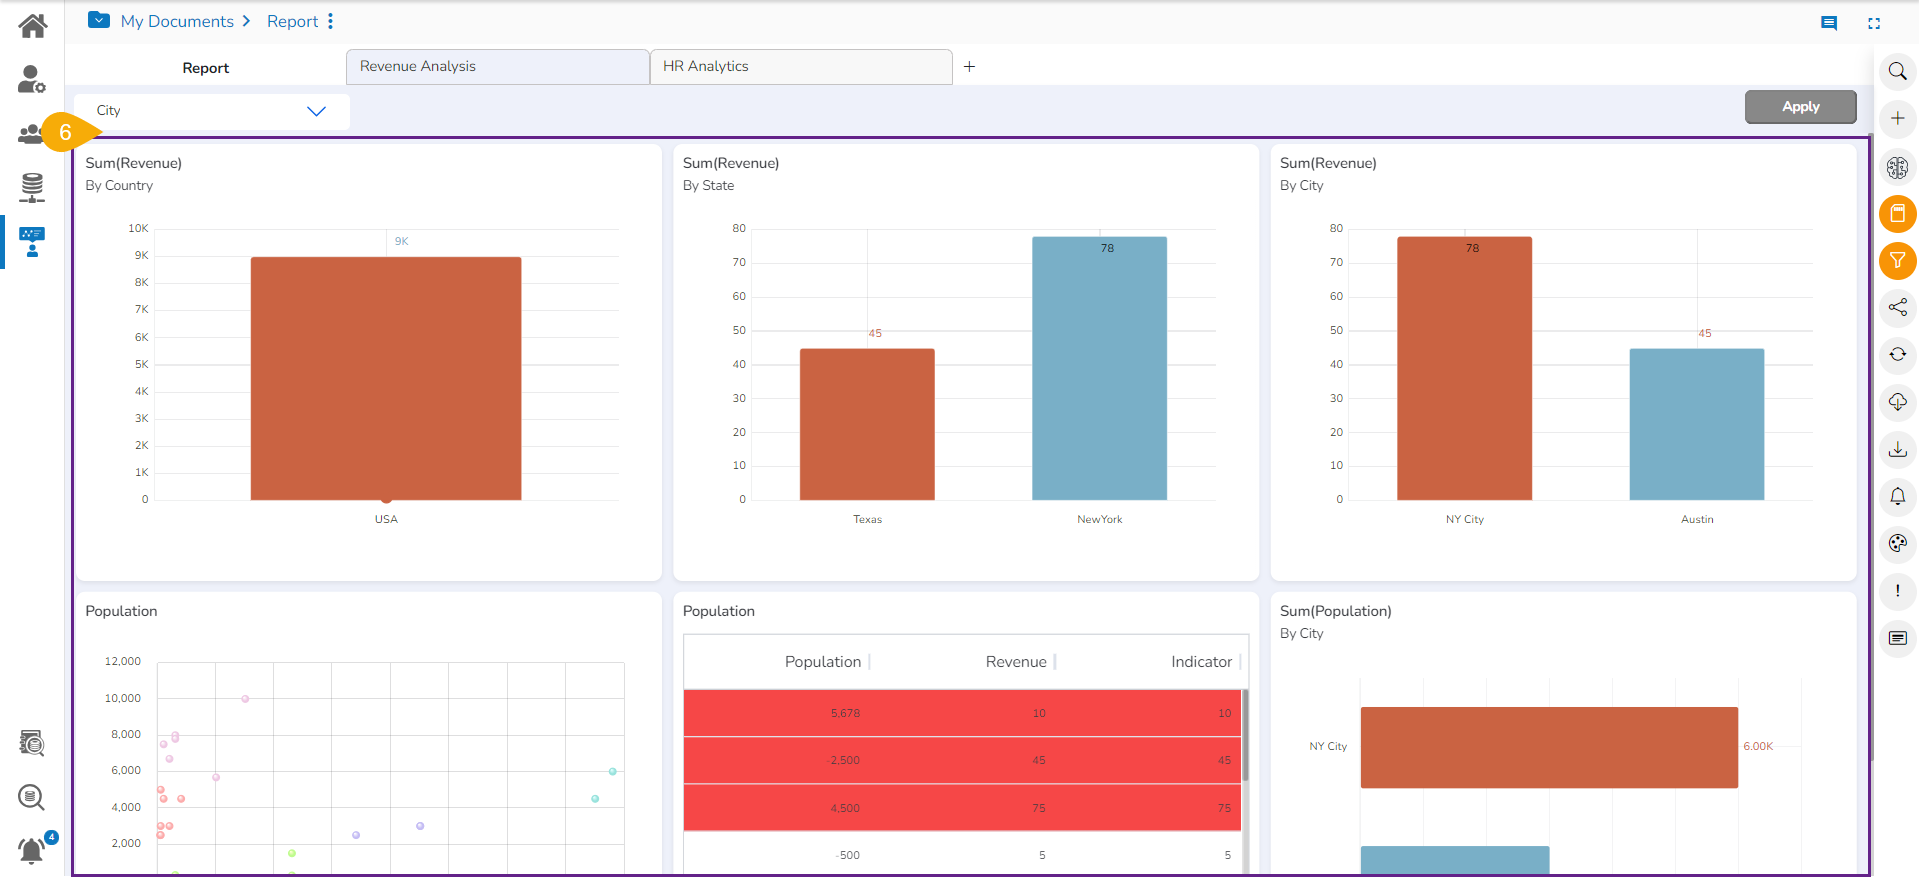
Filtering with Not In Option
Filter Panel

The Global filter is meant for the entire Report. It is available on the final page of a Report.