# Area chart
An area chart or area graph displays graphically quantitative data. It is based on the line chart. The primary use of area charts is to show trends over a period.
* **The best situation to use Area Chart:** To showcase data that depicts a time-series relationship
* **Examples:**
* To view the sales of a manufacturer over a period.
* To display quarter wise revenue growth of an organization**.**
* **Variations of this chart:** Group and Stacked Area graphs.
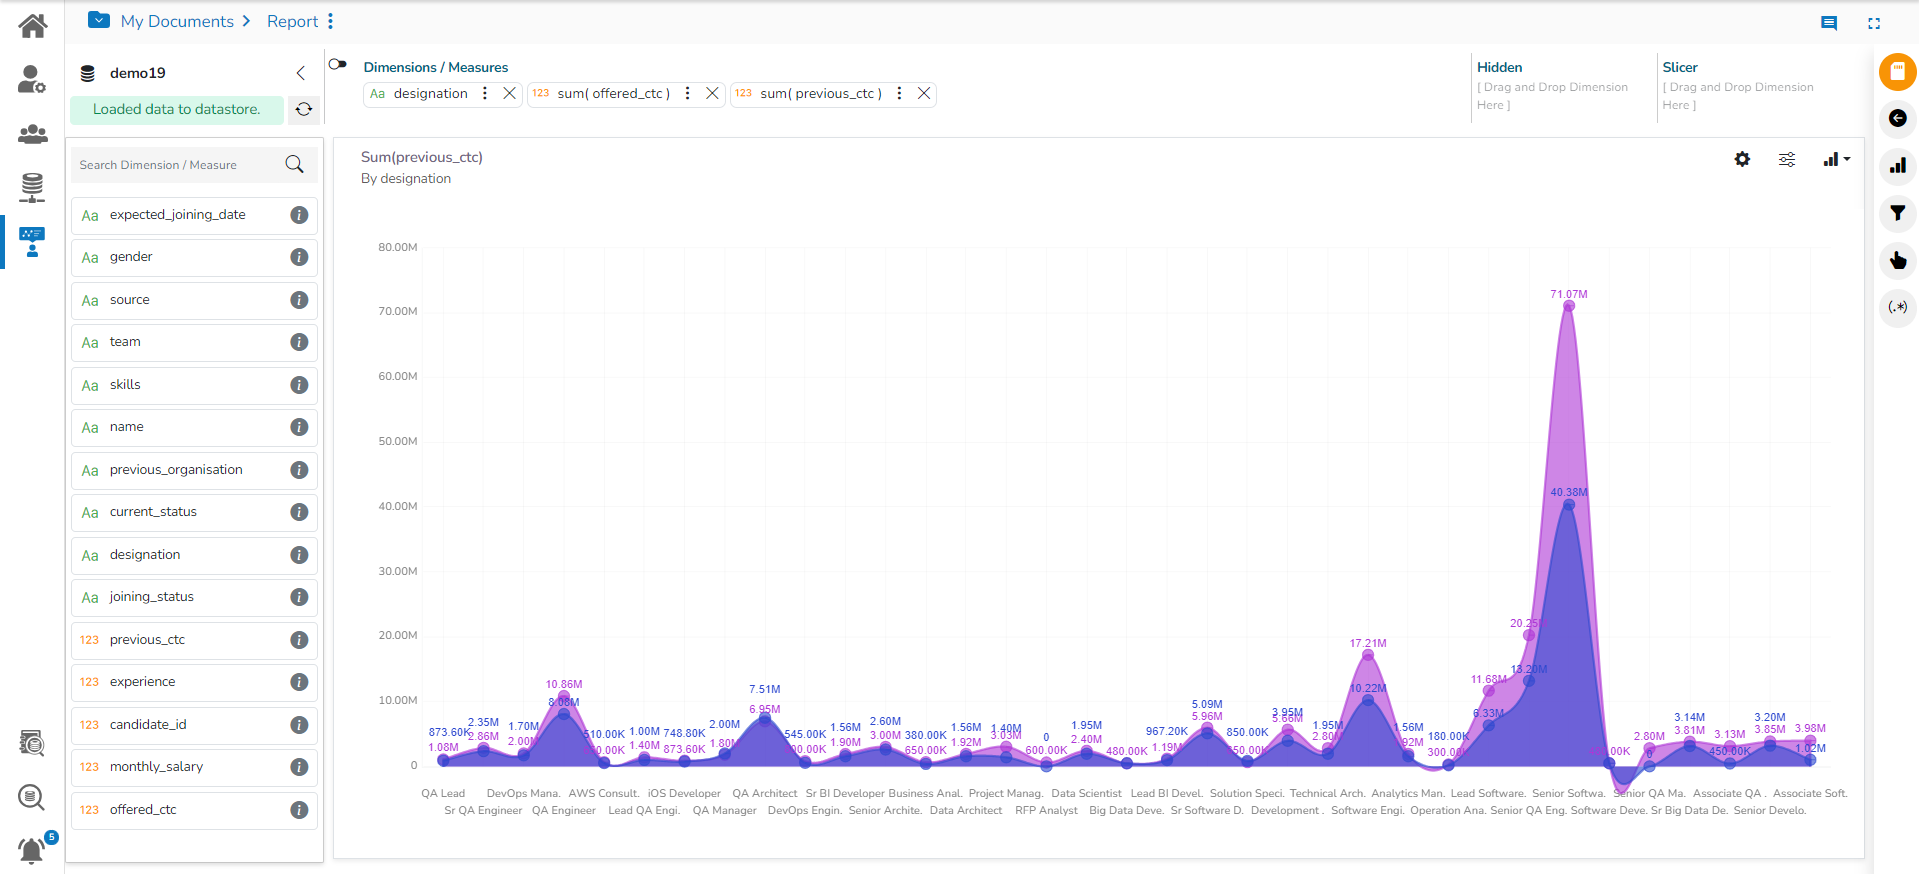
View with default Area chart
## **Properties**
### **General Settings**
* **Style**: Select a style to display the data (the provided choices for this field are: Overlaid, Stacked, 100%)
* **Order**: Select a sequence for displaying information
* **None**
* **Ascending**
* **Descending**
* **Manual Sort** (Users can manually sort the dimensions by using the indicator signs)
* By selecting an order (ascending or descending, users will be required to configure the following fields:
* **Order By**- Select a value option from the drop-down menu to order the sequence of the data.
* **Limit**- Set a number to display the requested data by this limit.
* **Exclude Global Filter**: The view will be excluded from the Global Filter condition by putting a checkmark in the box.
* **Show Data Label**: Data label gets displayed by using a checkmark in the given box.
* **Enable Base Zero**: Base value gets presented from Zero by using a checkmark in the given box.
* **Show Point**: Enable the Show Point option by using a checkmark in the given box.
* **Line Form**: Select a line format from the drop-down menu (the provided choices for this field are Curve and Segment)
* **Show Legend**: Displays legend by turning on the radio button. After enabling ‘Show Legend’, users need to select the following information:
* **Legend Style**: Select one of the following options by using the drop-down menu.
* Fixed
* Floating
* The following fields appear when the selected ***Legend Style*** option is ***Fixed***.
* **Legend Font Size:** This option allows to increase or decrease the font size of the legend.
* **Legend Orientation**: This option will be provided when the ***Show Legend*** option is enabled, and the selected ***Legend Style*** is ***Fixed***. The users need to select an option out of the given choices using the drop-down menu.
* Vertical
* Horizontal
* **Legend Checkbox**: Enable this option by a checkmark to add the checkbox beside the Legend. It helps the users to customize the display of the data (The data for a legend value appears if a checkmark is used in the given checkbox. The data for the unchecked checkbox does not appear).

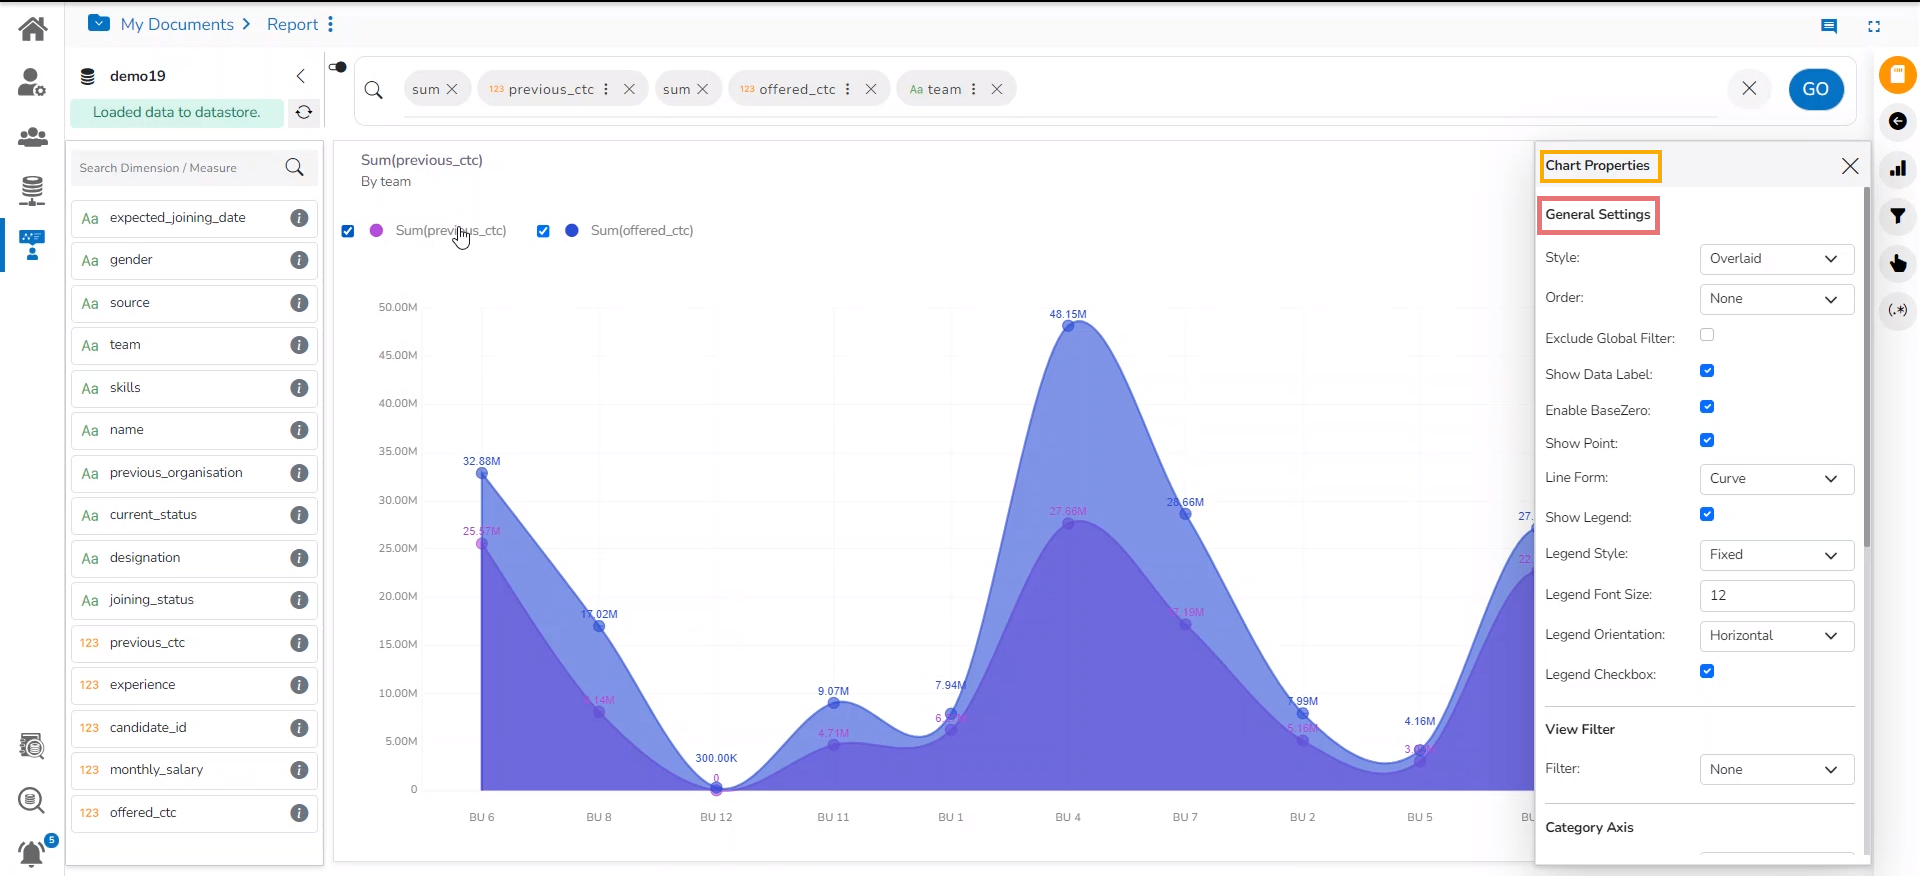
Area chart displaying the selected data values with fixed legend
### **View Filter**
* **Filter**: Select a filter condition using the drop-down menu.
{% hint style="info" %}
*Please Note: The selected **View Filter** option will be reflected to customise the View data after adding the View to report.*
{% endhint %}
### **Category Axis**
* **Title**: Provide a title for the axis.
* **Axis Label**: Enable the category axis label by using a checkmark in the box.
* **Label Angle**: Select a display angle for the axis label.
### **Value Axis**
The Area chart contains only one Value Axis to be configured.
* **Title**: Provide a title for the Primary Value Axis
* **Axis Label**: Enable the Primary Value Axis label by using a checkmark in the box
* **Format Type**: Select a desired format type from the drop-down menu (the provided options for this field are: None, Auto, Percent, Thousand, Lacs, Crore, Million, Billion, Trillion, Quadrillion).
* **Currency Type**: Select a currency symbol to be displayed in the view (the provided options for this field are: None, Rupees, Euro, Pound, USD, Yen, Cent).
* **Precision**: Set the after-decimal value (It displays up to 5 precision)
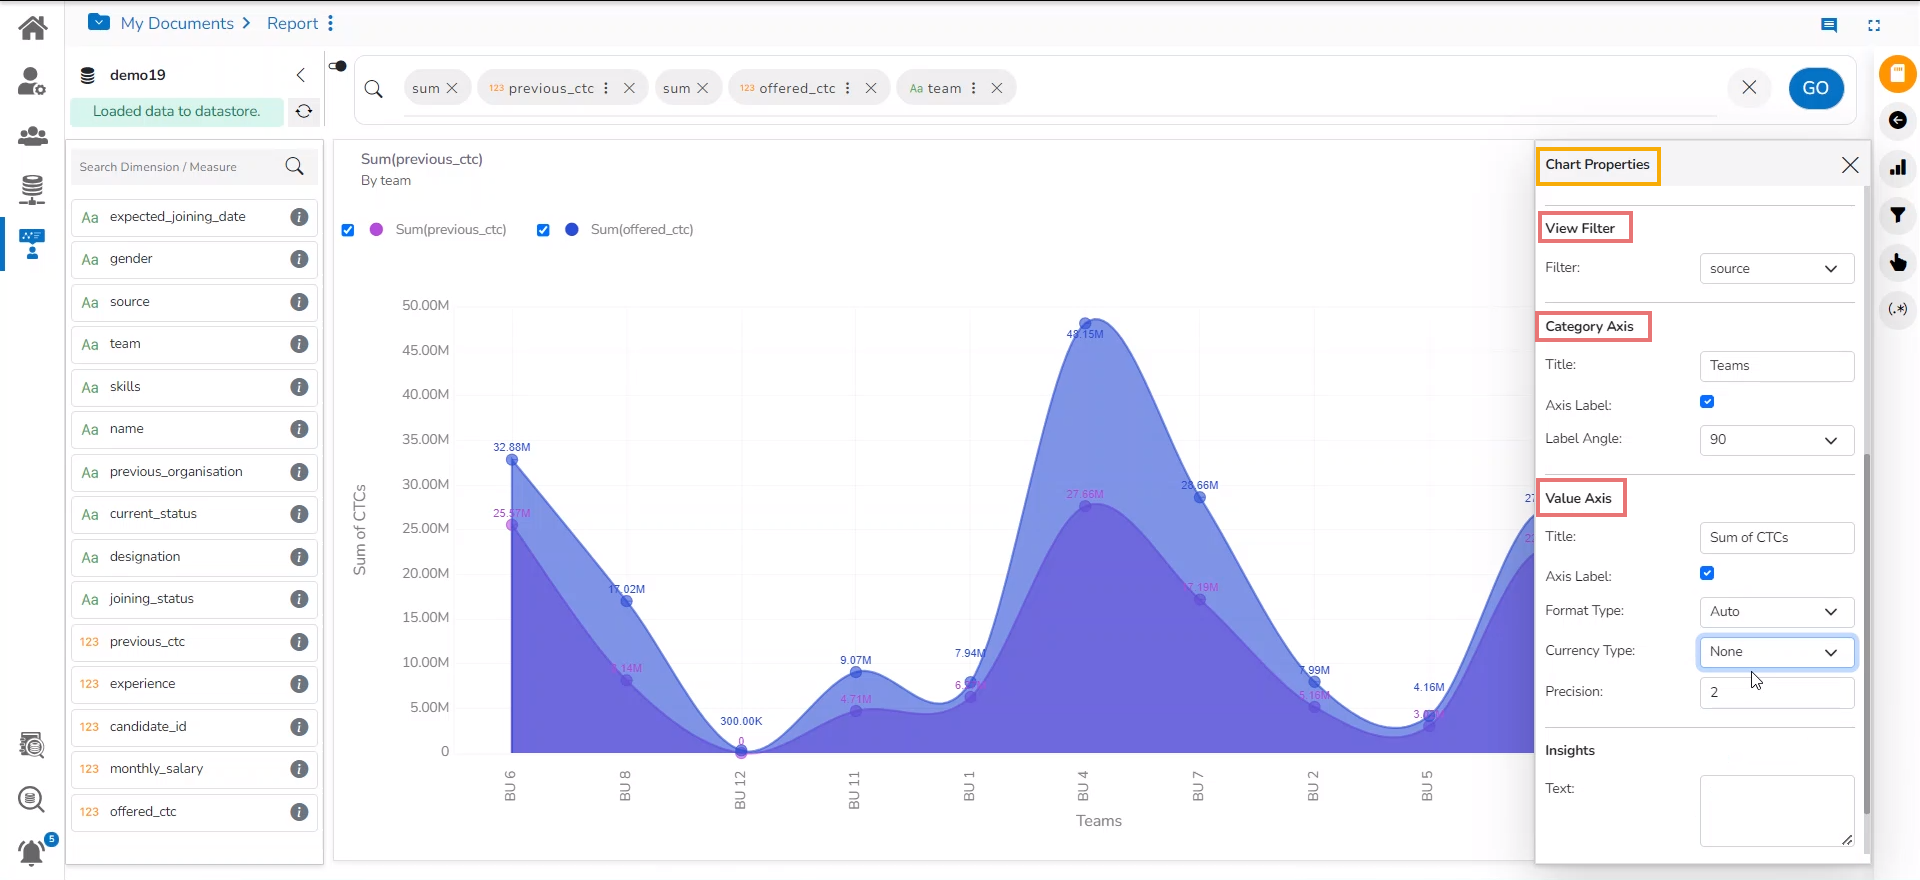
Applying View Filter, Category Axis, and Value Axis for the Area chart
### **Insights**
* **Text:** *Provide any information regarding the chart. If any digit or character is required to be highlighted, put it inside two asterisks. (E.g., \*70%\* or \*skills\*).*
* **Font Size:** Set/modify Font Size of the Insights text.
* **Font Color:** Select a Font color for the Insights Text.
* **Text align:** There are three alignments to align the text.
* Left
* Right
* Centre
* **Position:** There are two options to position the text.
* Bottom
* Right