
Alert Center
Set threshold limit to trigger data alerts using this function
The alert center triggers alerts based on the lower threshold and upper threshold values for the defined dimension or measure.
Creating a New Alert
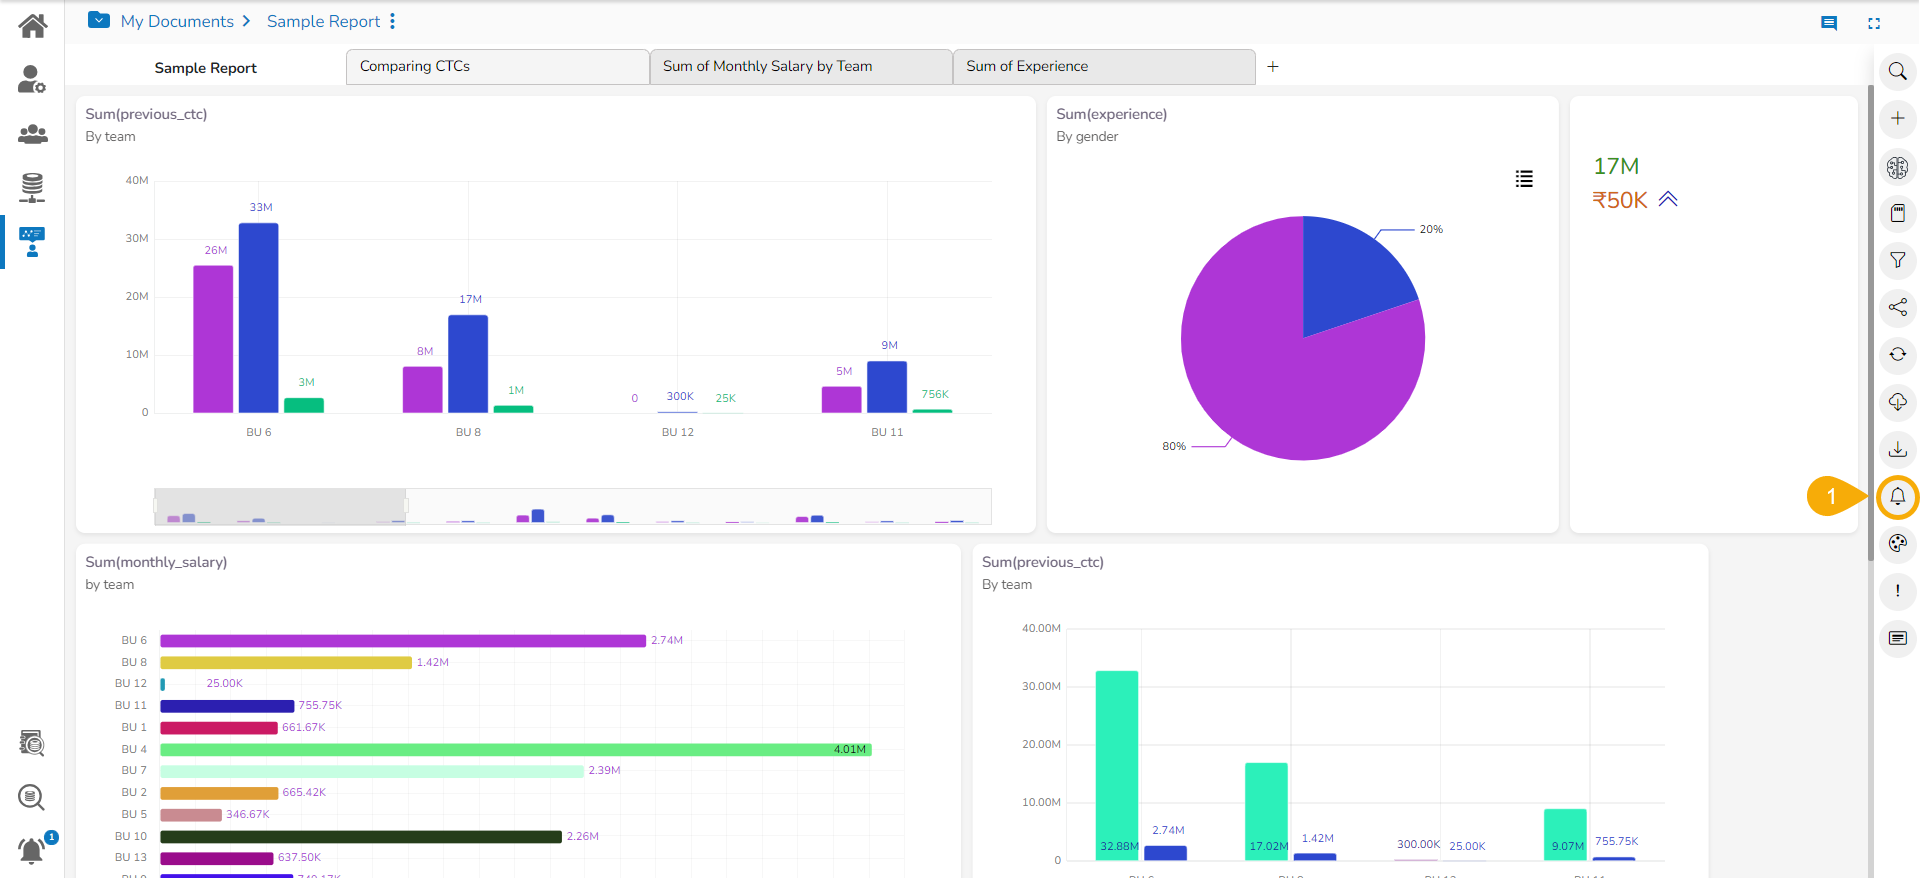
Click the Alert Center icon from the final screen of a Report.
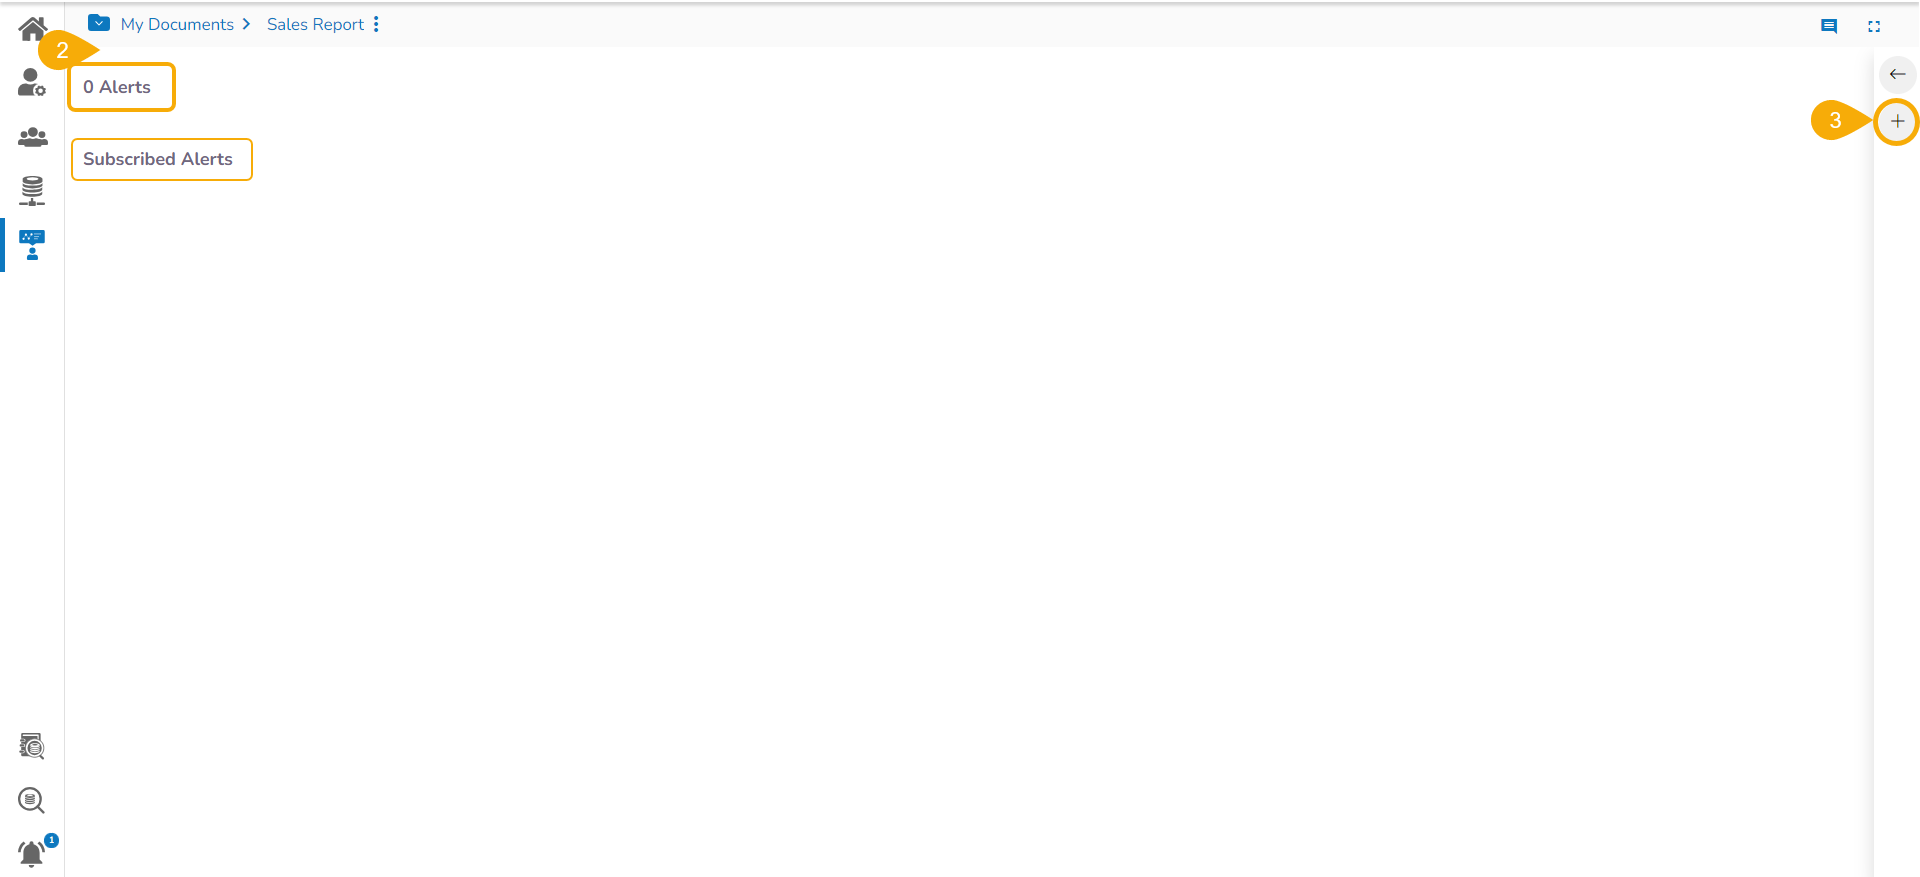
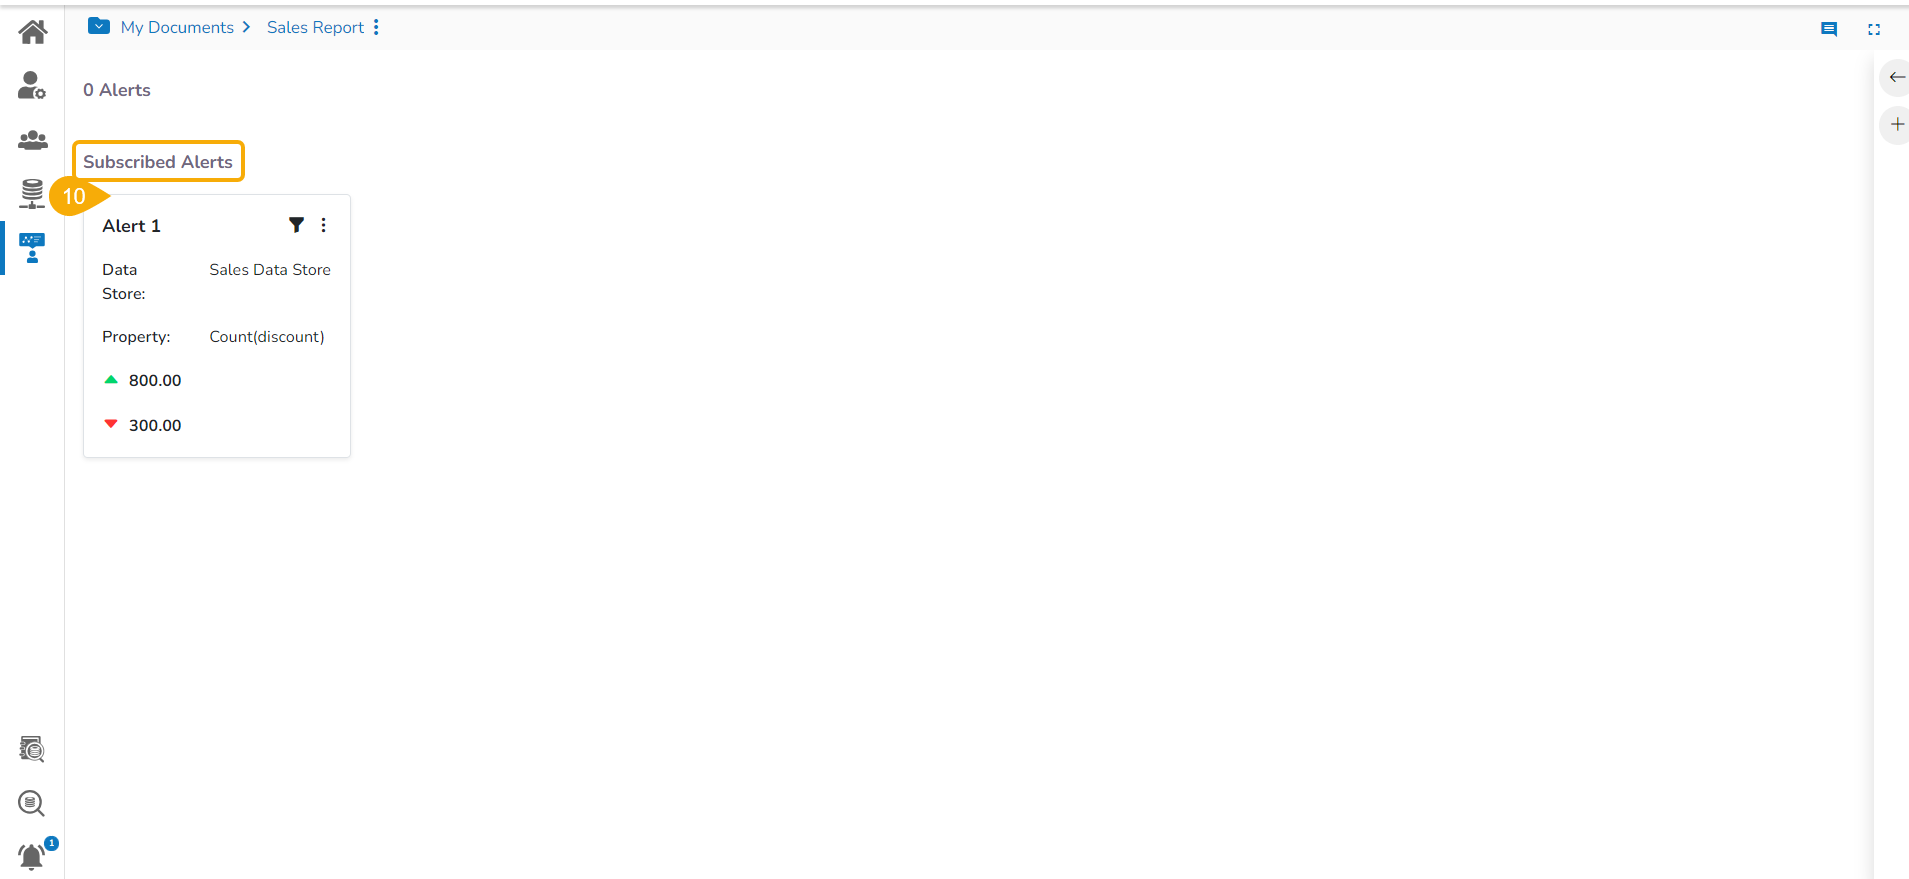
A new page opens prompting to subscribe alerts (the same screen also displays the previously Subscribed Alerts).
Click the Create New Alert icon.
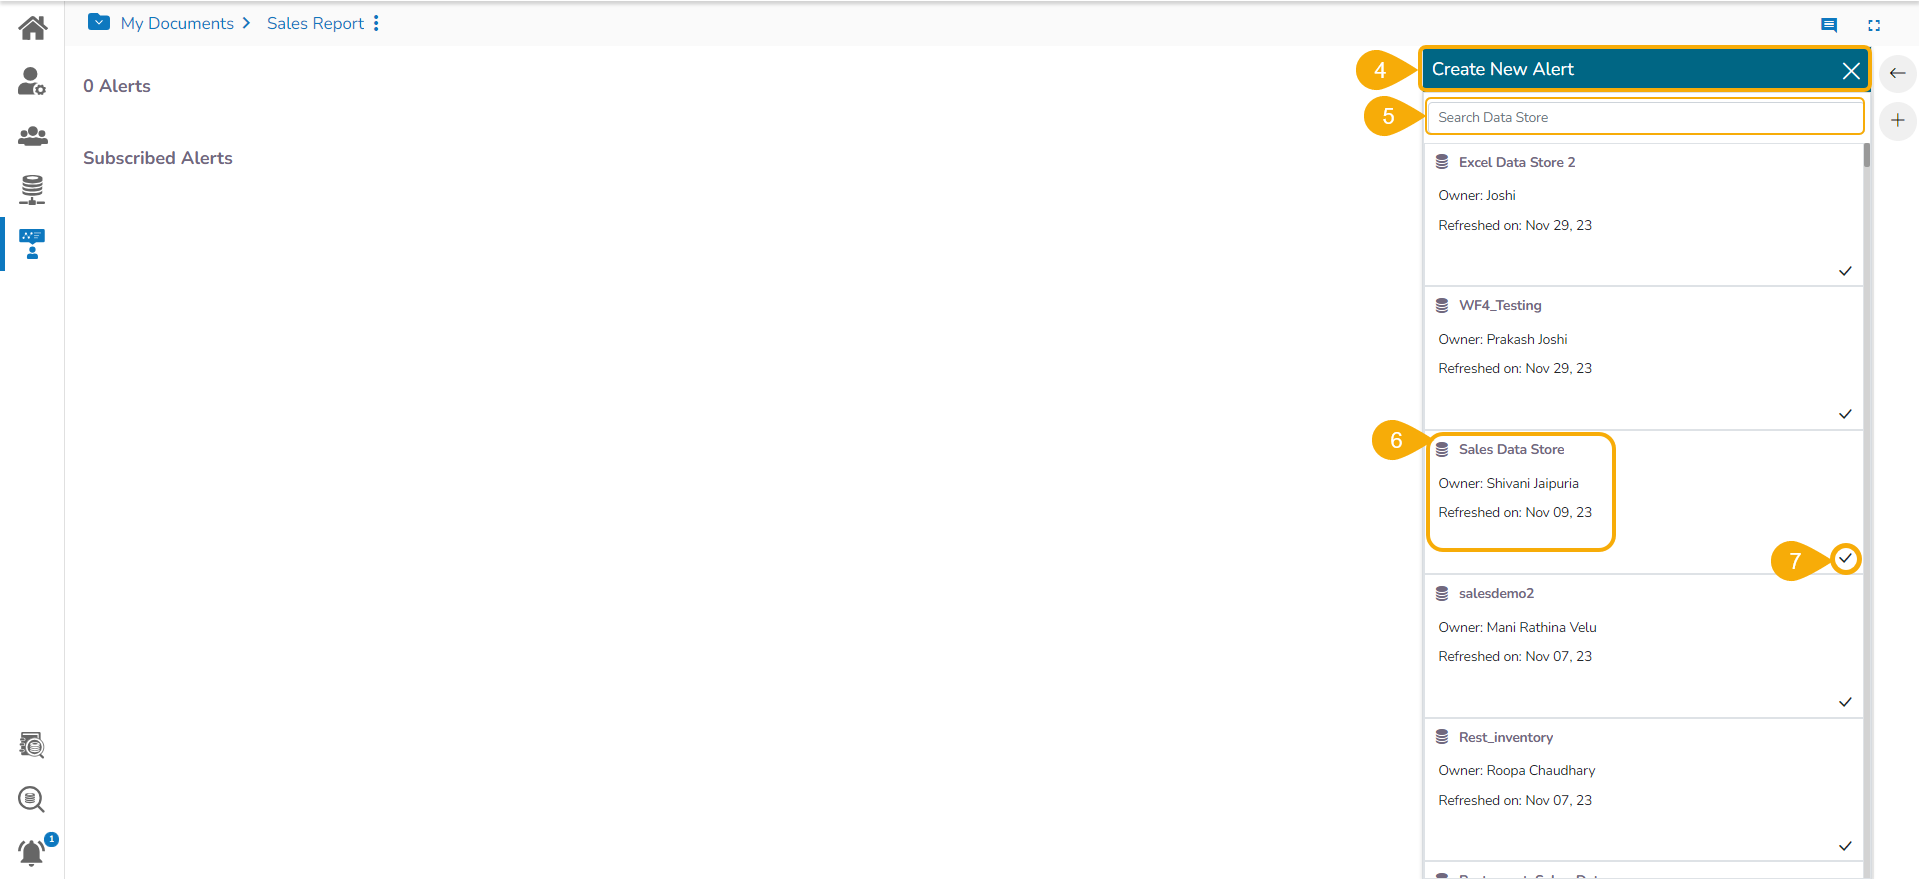
The Alert window opens, displaying a list of the available Data Stores.
Use the Search bar to search for a Data store from the displayed Data Store list.
Choose a Data Store containing a time dimension from the list (An error message appears to notify the users if the selected Data Store does not contain a Time Dimension).
Click the Select icon for the chosen Data Store.
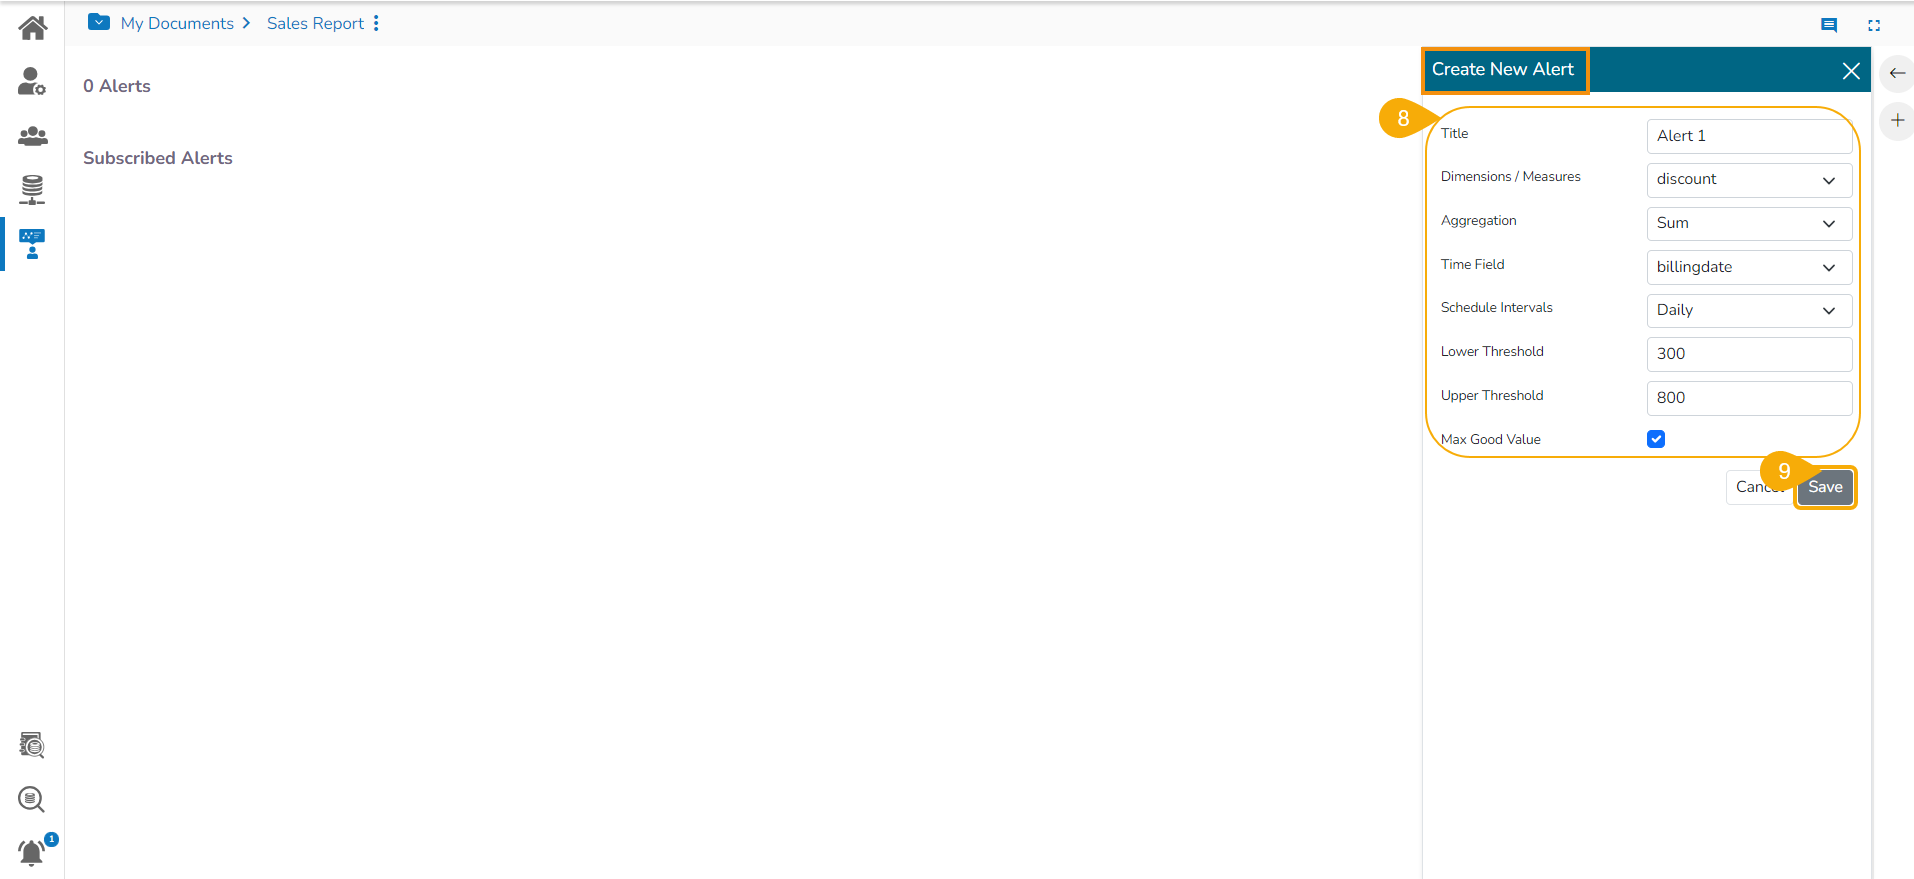
After selecting a data store the following fields display to fill the required information:
Title: Give a title to the created alert.
Dimension/Measures: Select a dimension or measure from the drop-down list.
Aggregation: Select an aggregation type from the drop-down list.
Time Field: Available time fields appear as options for this field.
Schedule Intervals: Select a time range to schedule the refresh intervals using the drop-down menu.
Lower Threshold: Set value as the lower threshold (the default value for this field is 0).
Upper Threshold: Set value as the upper threshold (the default value for this field is 100).
Max Good Value: Enable/disable the Max Good Value by a checkmark in the box.
Click the Save icon.
Please Note:
The user can enable the Aggregation field only after selecting a Dimension/Measure field from the drop-down menu.
The order of colors changes in Semi-Gauge from 'green-yellow-red' to ‘red-yellow-green’ by enabling the Max Good Value option.
The newly created alert gets added to the Subscribed Alert page.
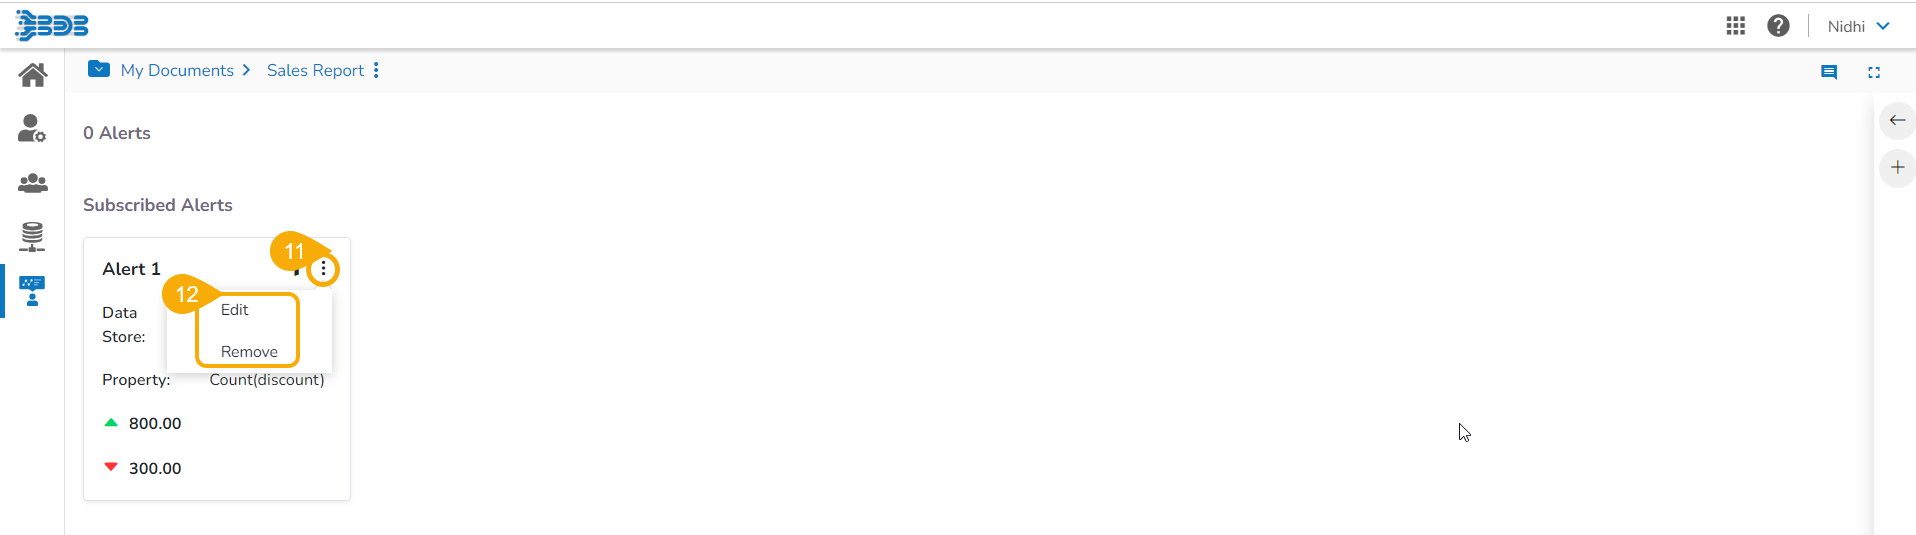
Click the Options icon for a Subscribed Alert.
The Edit and Remove options appear.
Filter Option for Alert
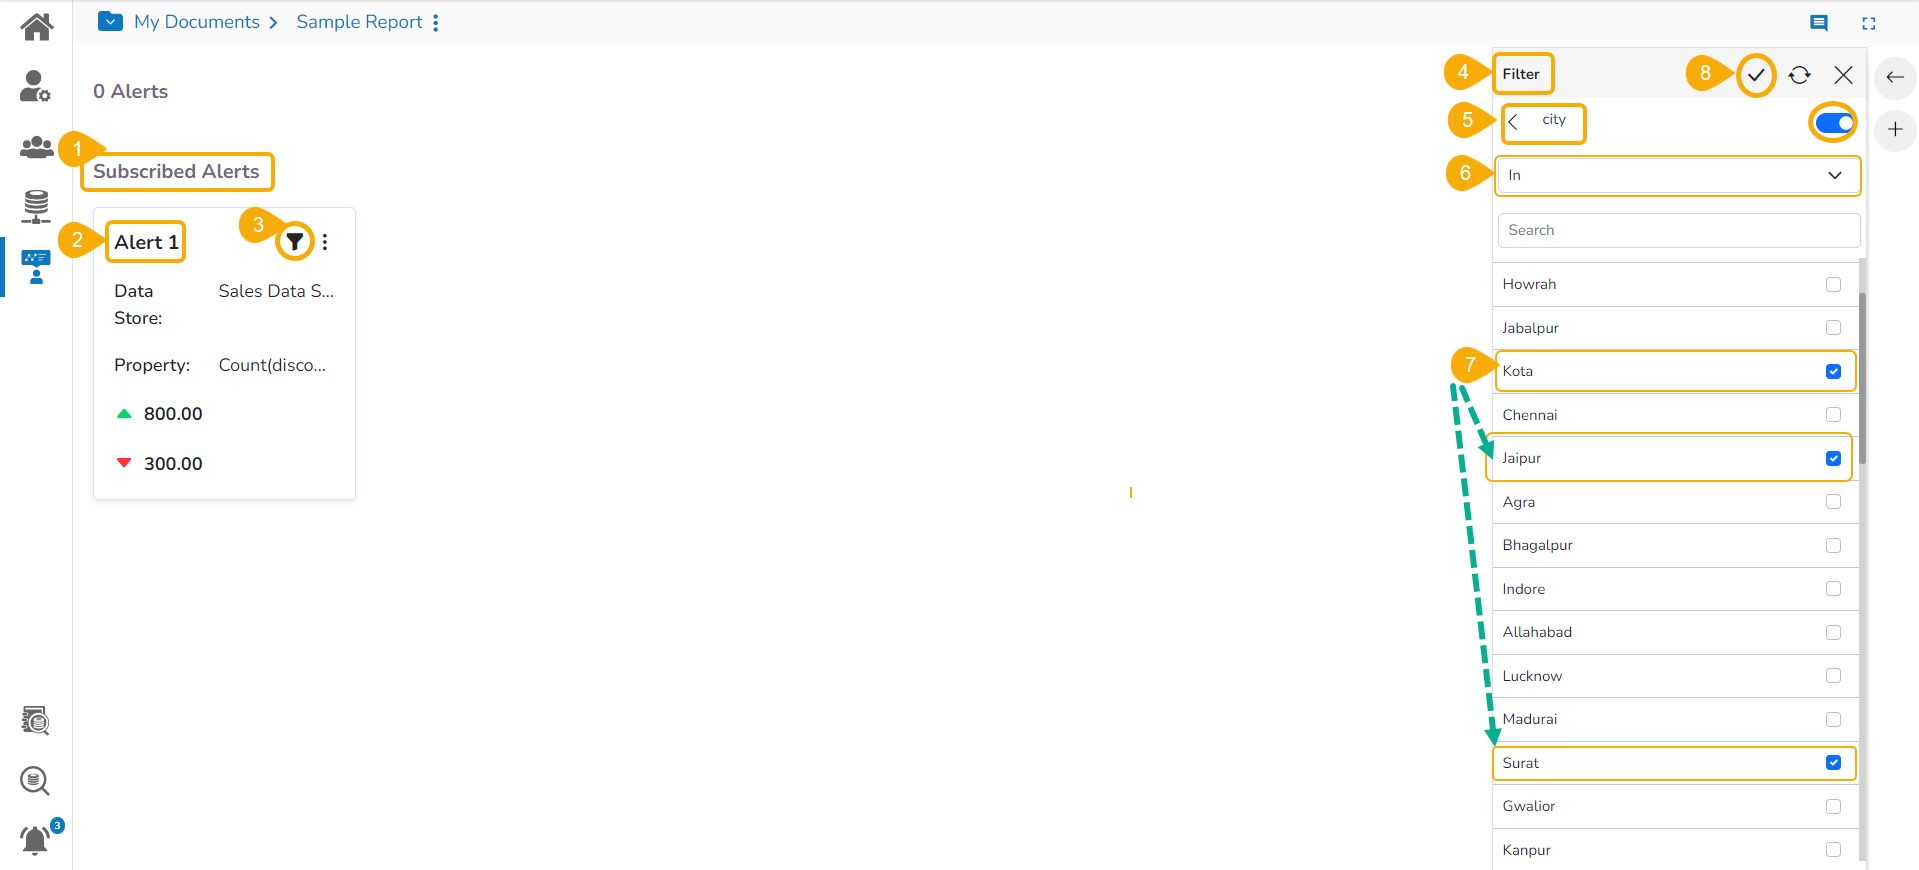
The user can apply a filter rules to a subscribed Alert.
Navigate to the Subscribed Alerts page.
Select a subscribed Alert.
Click the Filter option for the Alert.
The Filter panel opens on the right side of the page.
Select a Dimension, Measure, or time value from the displayed list of the filter values.
Select a rule to apply on the selected filter value (the supported rules are In, Not In, Like, Not Like).
Select the sub values for the selected dimension/ Do the required configuration for a Measure or Time column.
Click the Apply icon.
Triggered Alert
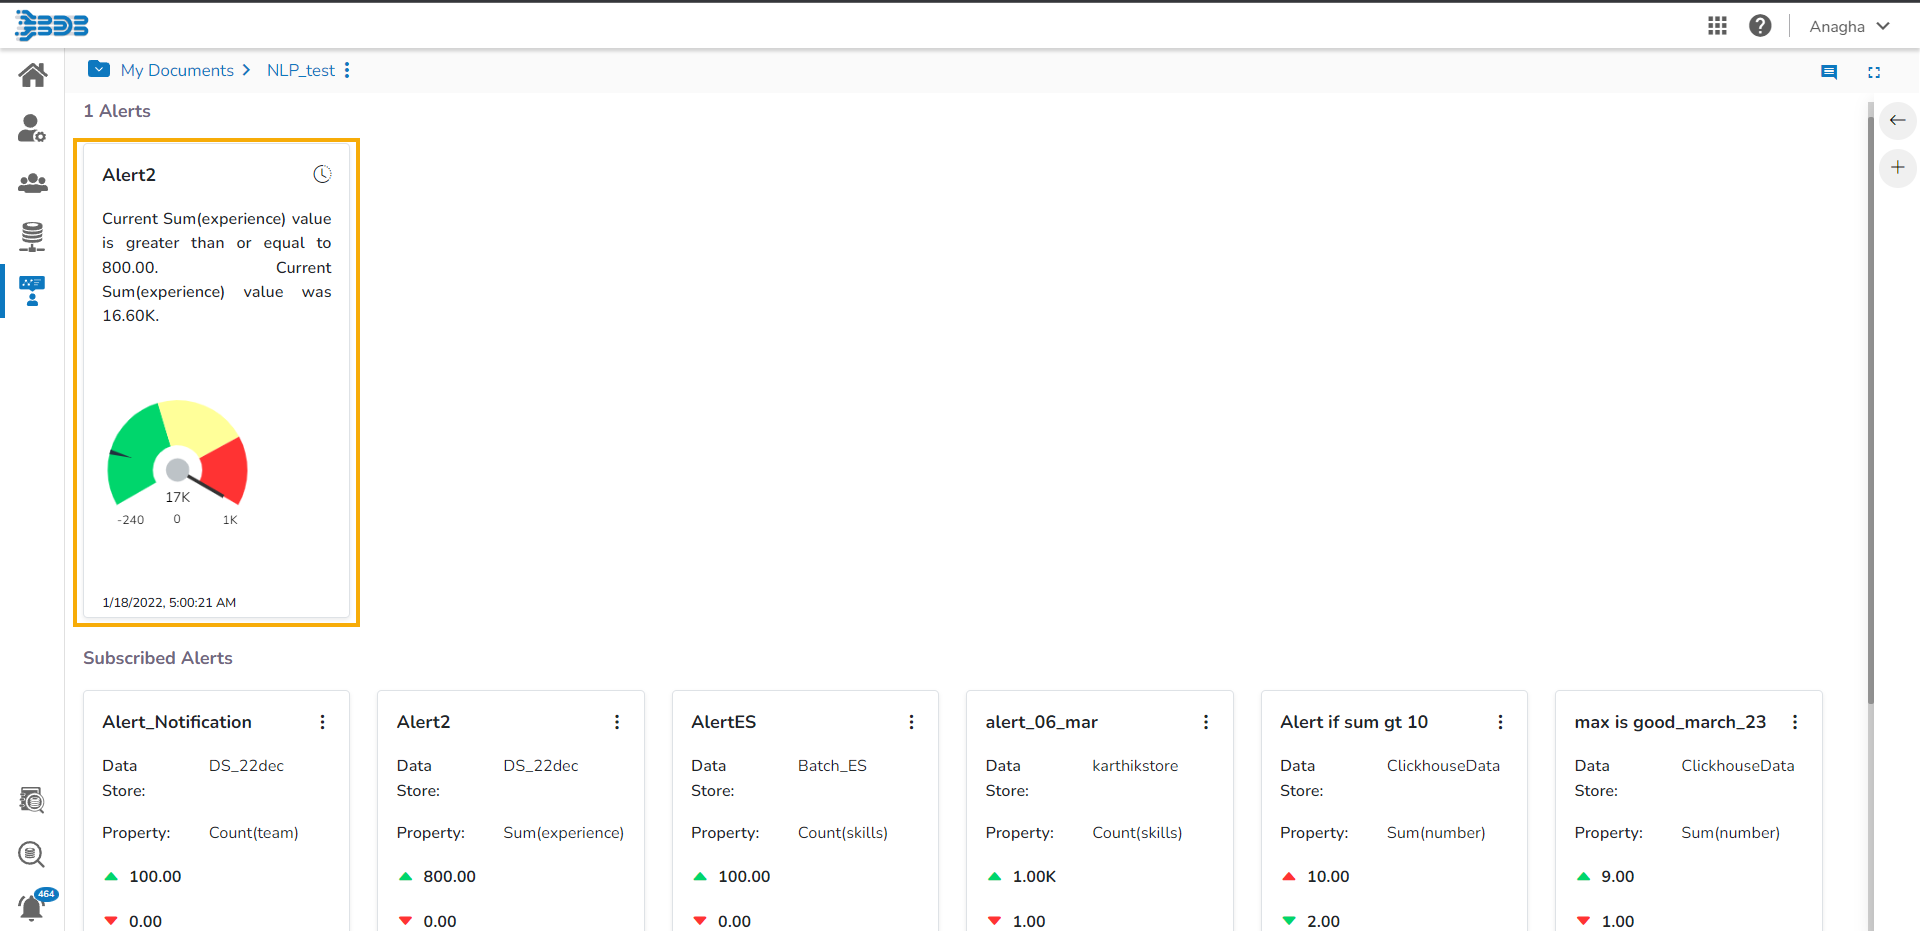
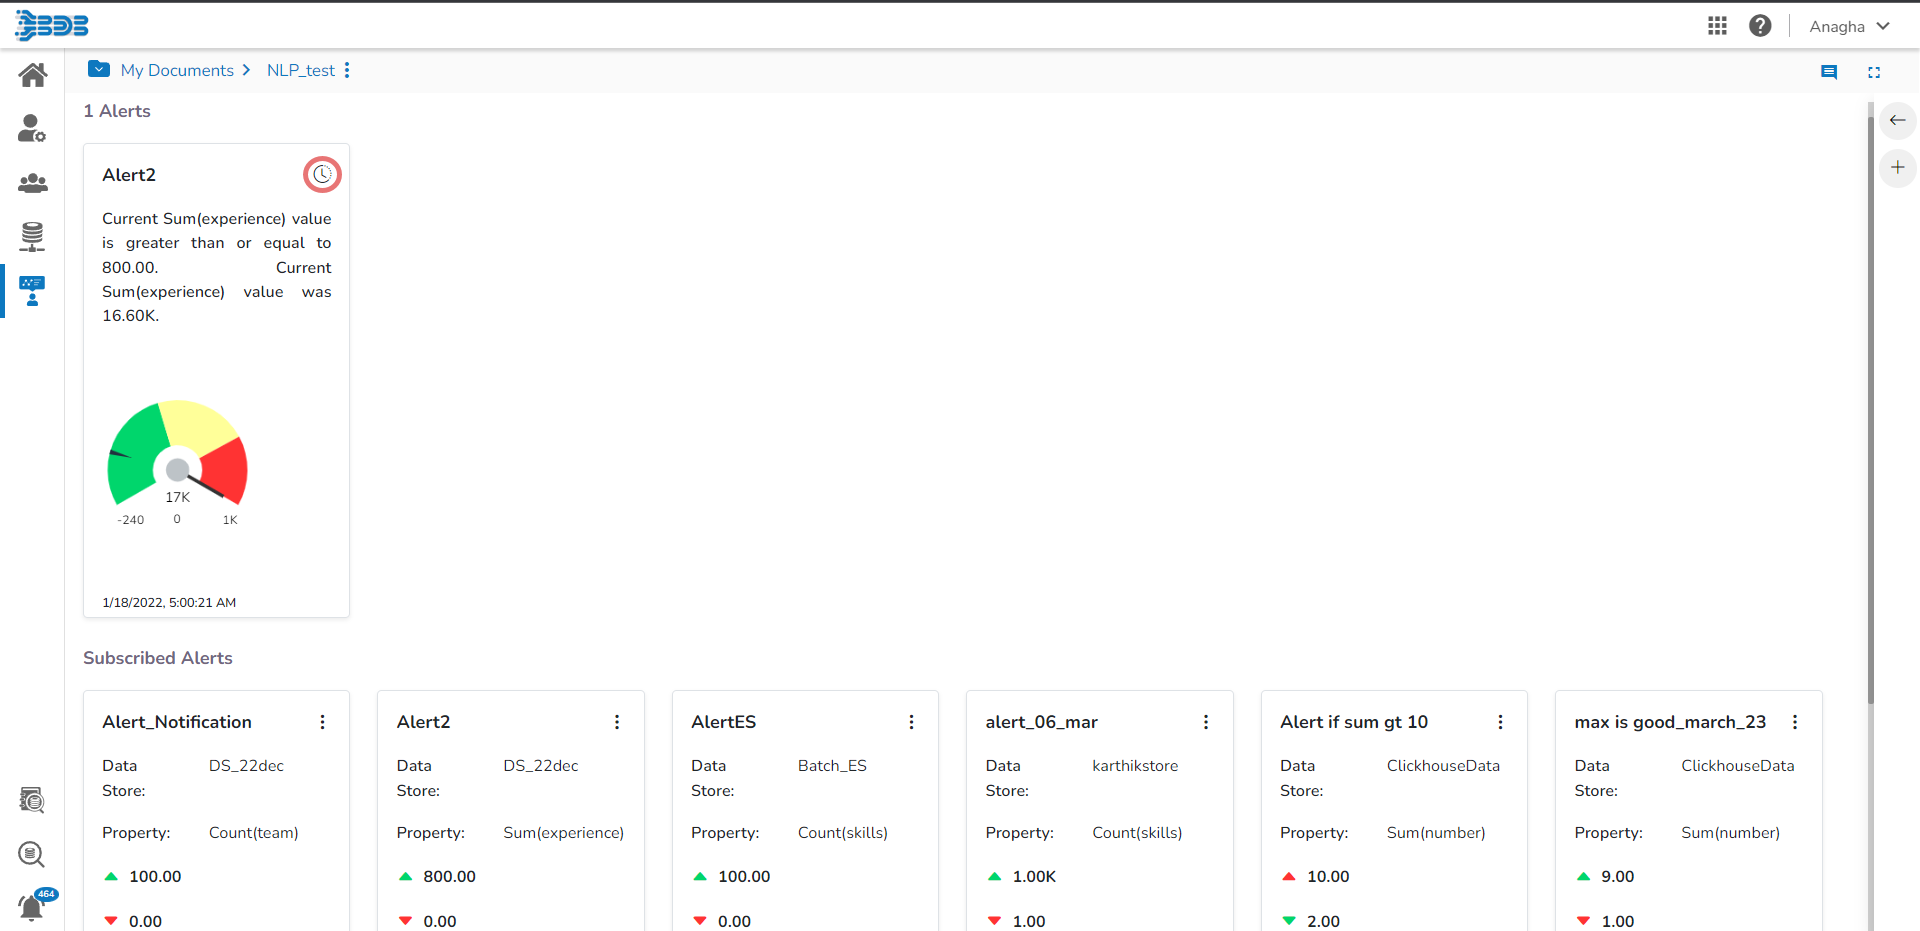
The triggered alerts display under the Alert Center with a brief explanation of the change in the set alert thresholds. The below-given image displays a triggered Alert.
Display Alert History
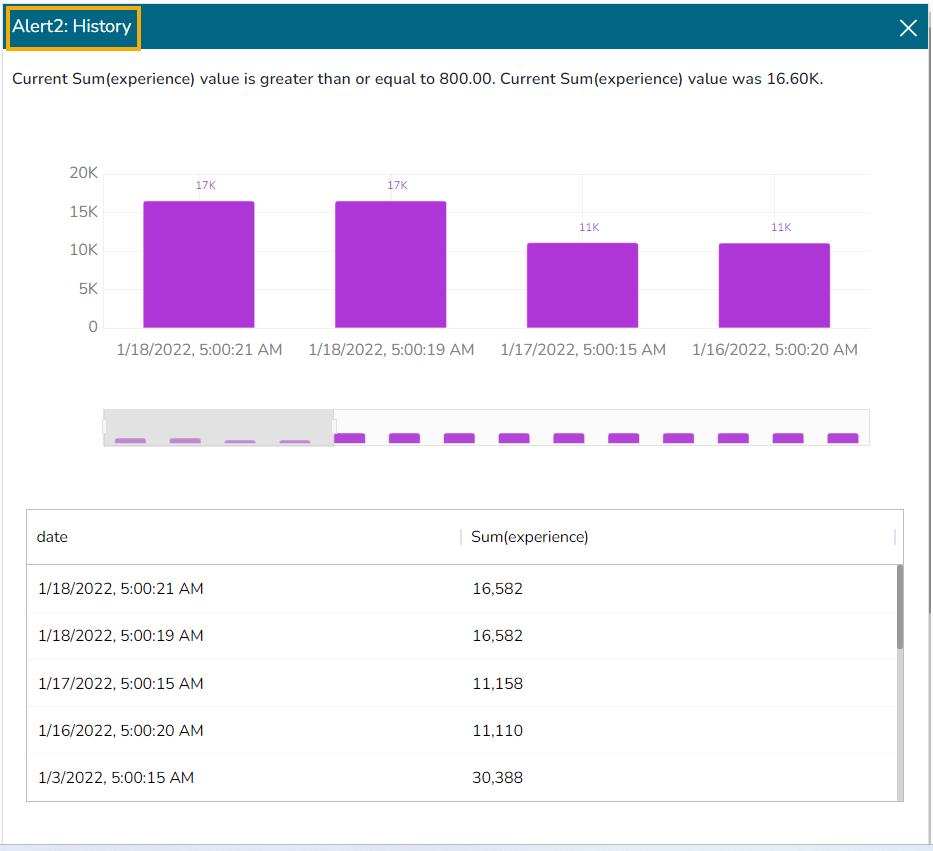
The user can click the Show History option given on the triggered alert.
A page opens, displaying the information of previously triggered alerts.
Please Note:
Choosing the Edit option redirects the users to modify the inserted values for Alert.
A Click on the Remove option redirects users to remove the subscribed Alert together with the triggered alert.
The Show History option displays only for the triggered alerts.