Self-Service Visualization
  • What is a Report?
  • Creating a new Report
    • Accessing the Report Module
    • Create New Report
      • Creating a new Report with an Existing Data Store
        • Creating and Updating Instance
      • Creating a new Report by Uploading a File
        • Creating a new Report by Uploading a CSV File
        • Creating a new Report by Uploading an Excel File
      • Creating a new Report with Data Preparation
        • Create a Report with Data Preparation - Inside the Report UI
        • Create a Report with Data Preparation- Partly from Data Center
    • Designing a View
    • Saving Multiple Views
  • Design Canvas
    • Dimension Profiling
    • View Summary
    • Customized Category Color for Dimension
    • Series Properties
    • Create Calculated Field
      • Creating a Formula
        • Record Level Option
        • Summary Level Option
      • Creating Range
    • Order by and Limit
    • Adding a Slicer
  • Chart Gallery
    • Mixed chart
    • Area chart
    • Bar chart
    • Bubble chart
    • Column Stack chart
    • Line chart
    • Pie chart
    • Scattered Plot chart
    • TreeMap chart
    • Circumplex chart
    • Pareto chart
    • Semi Gauge
    • KPI Tile
    • KPI Tile: Comparative Tile
    • KPI Tile: Sparkline
    • Map
    • Data Grid
    • Metric Summary
    • Dissolution/Decomposition chart
    • Spider chart
    • Waterfall chart
    • Funnel chart
    • Inverted Funnel chart
    • Heat Map chart
    • Geo chart
    • Sankey chart
    • Word Cloud
  • Report Final Screen
    • Tab
    • Search
    • Create New ML View
    • Shared Views
    • Live Refresh
    • Export
      • Export Properties
    • Alert Center
    • Change Theme
    • Data Store Information
    • Options Assigned to a View
      • Analyse
        • Timeline Play
        • Data Drills
          • Drill Into
          • Drill Through
      • Edit
      • Duplicate
      • Remove
  • Applying Filters
    • View Specific Filter
      • Dimension-based View Filter
      • Measure-based View Filter
      • Date-based View Filter
    • Global Filter
      • Exclude from the Global Filter
      • Saving a Global Filter
      • Custom View Filter
      • LOV Settings
  • Interactions
Powered by GitBook
On this page
  1. Applying Filters
  2. Global Filter

LOV Settings

PreviousCustom View FilterNextInteractions

The user can enable the filter and lookup for specific dimensions via the Data Type Definition step for a Data Store. All the selected (enabled) dimensions list with the sub-values, while for the disabled ones, no sub-values appear. This operation applies to both Local and Global filters.

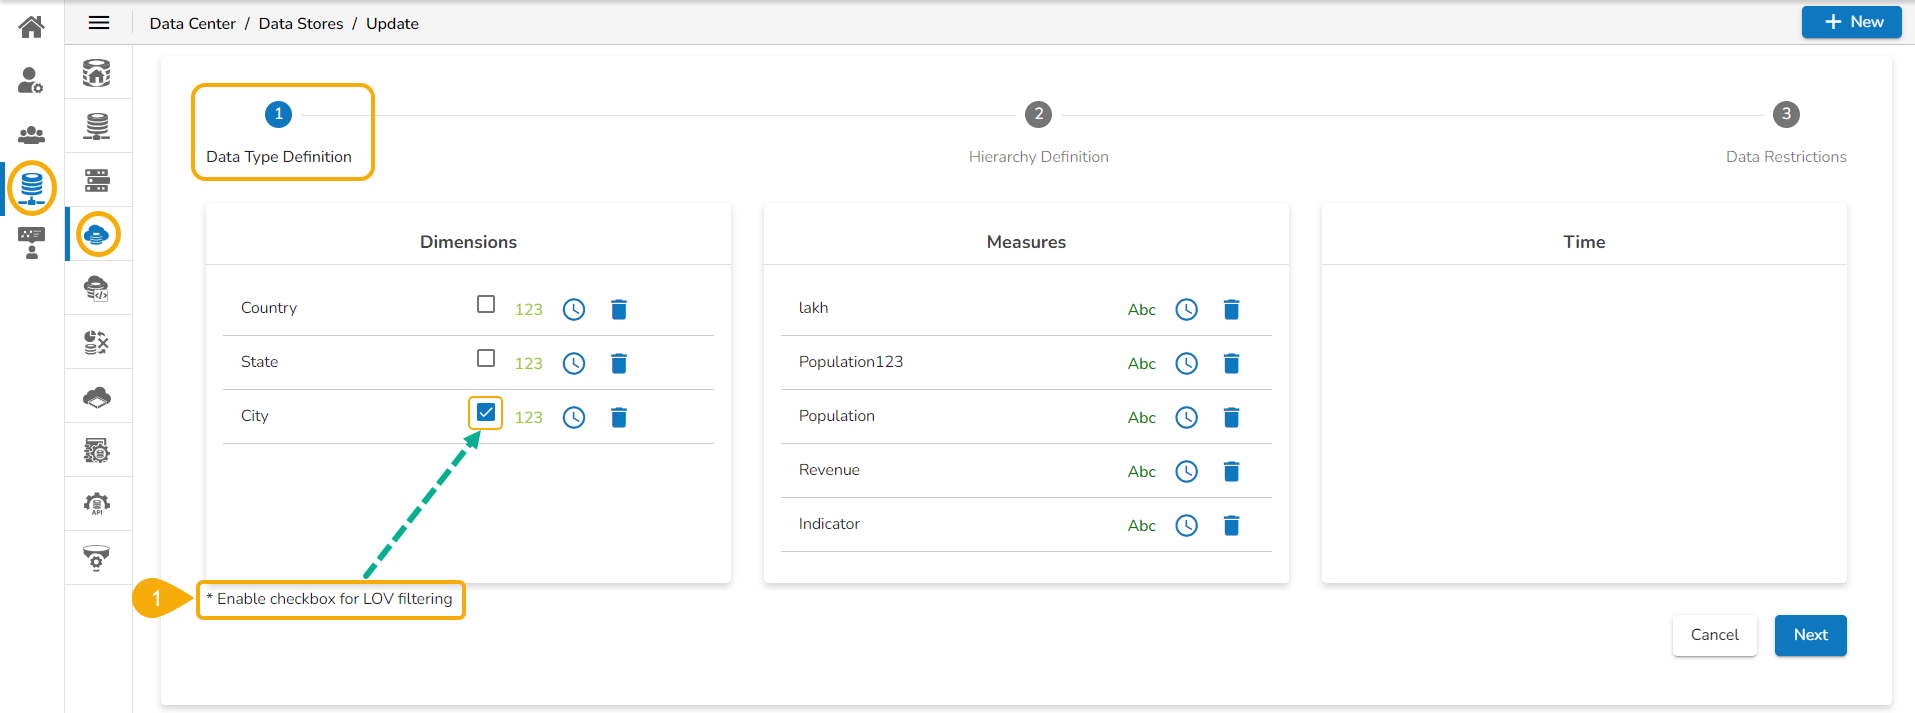
  • Navigate to the Data Type Definition page for a Data Store (the image displays the Data Type Definition page for the Data Store where Dimensions like gender, skills, and ename are enabled for the filter lookup function, but source, previous_organisation, and team are disabled from the filter lookup.

  • Create a report based on the same Data Store and save it with relevant views.

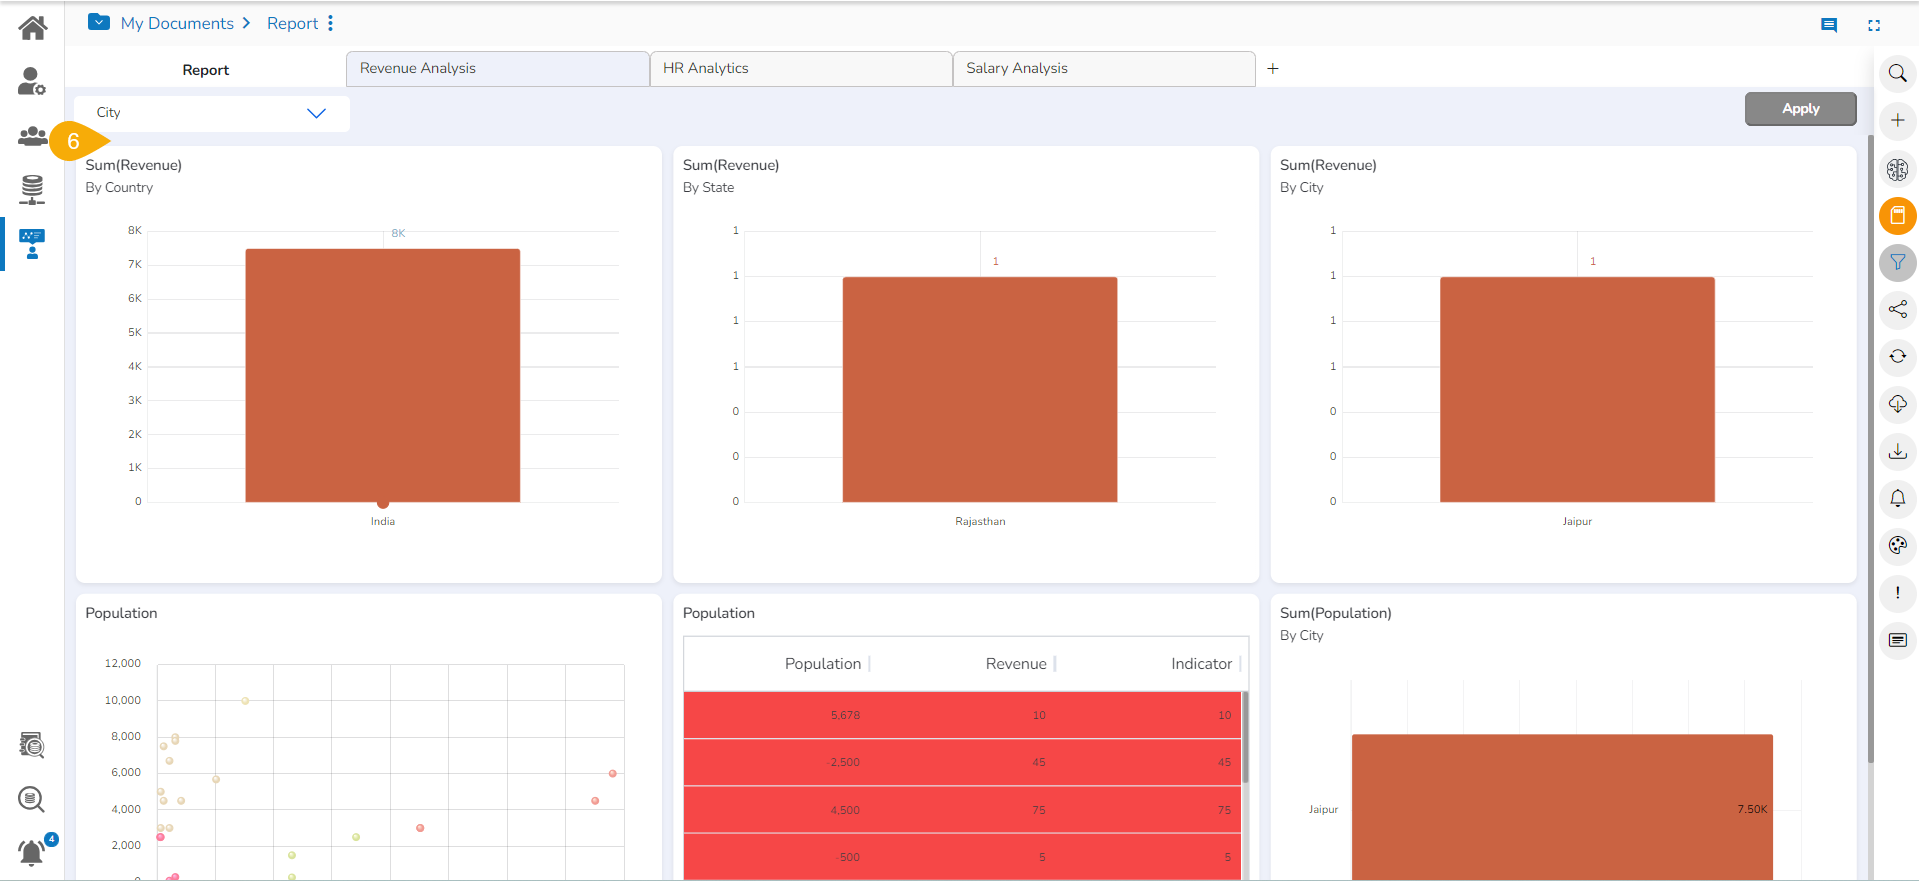
  • Access the global filter panel.

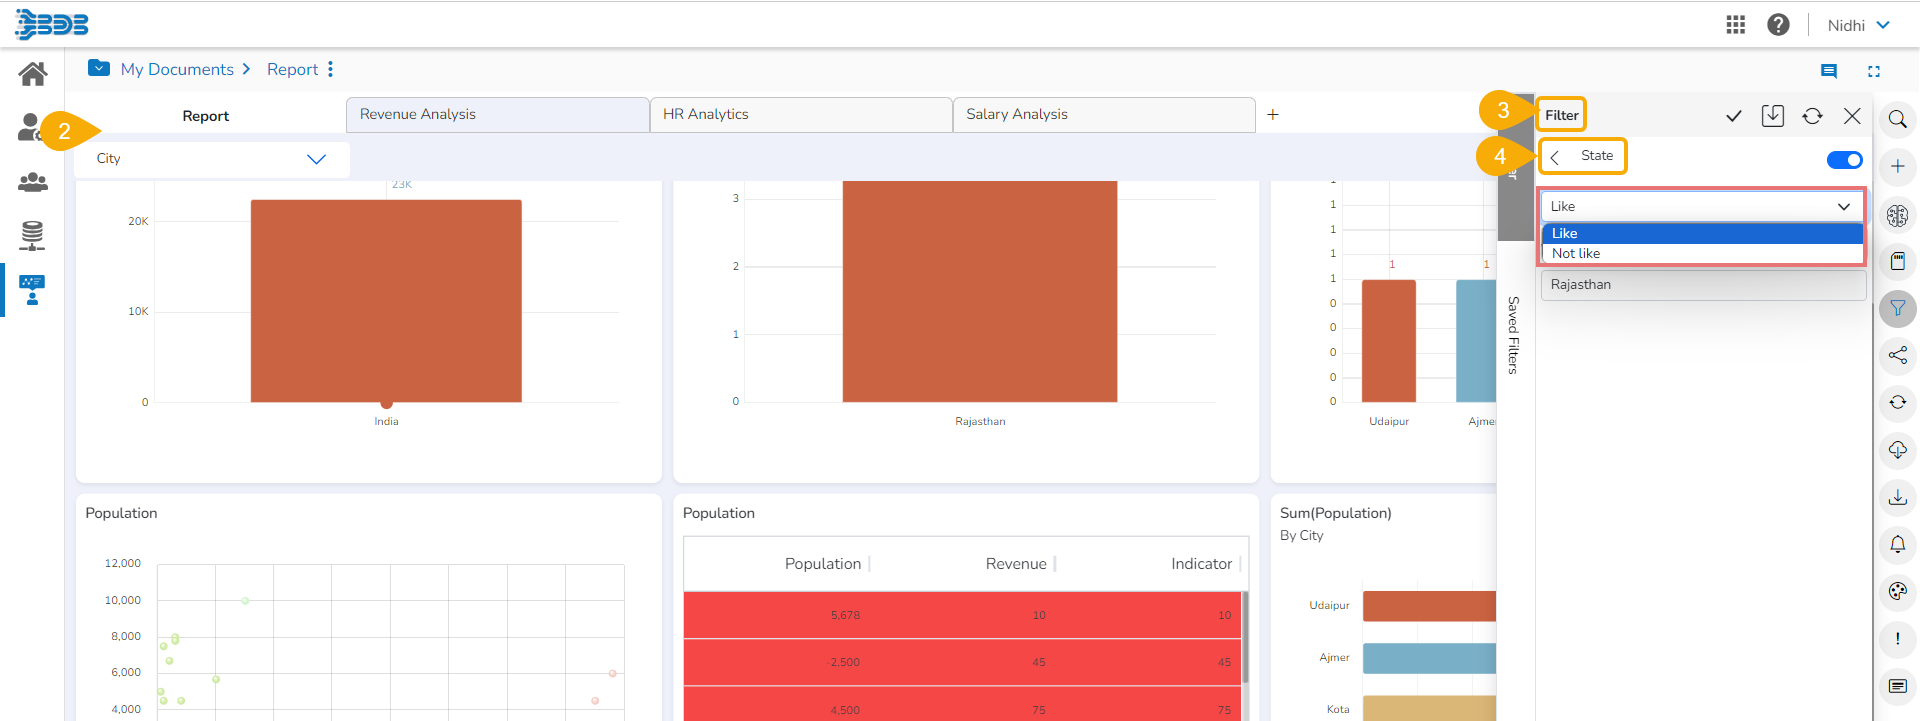
  • Select any of the disabled Dimension values (E.g., the State dimension is selected from the Filter panel in the following image).

    • The sub-values for the State dimension do not get displayed.

    • Only Like and Not Like options can be applied to the disabled dimensions.

  • Navigate to the View.

  • Open the Filter panel.

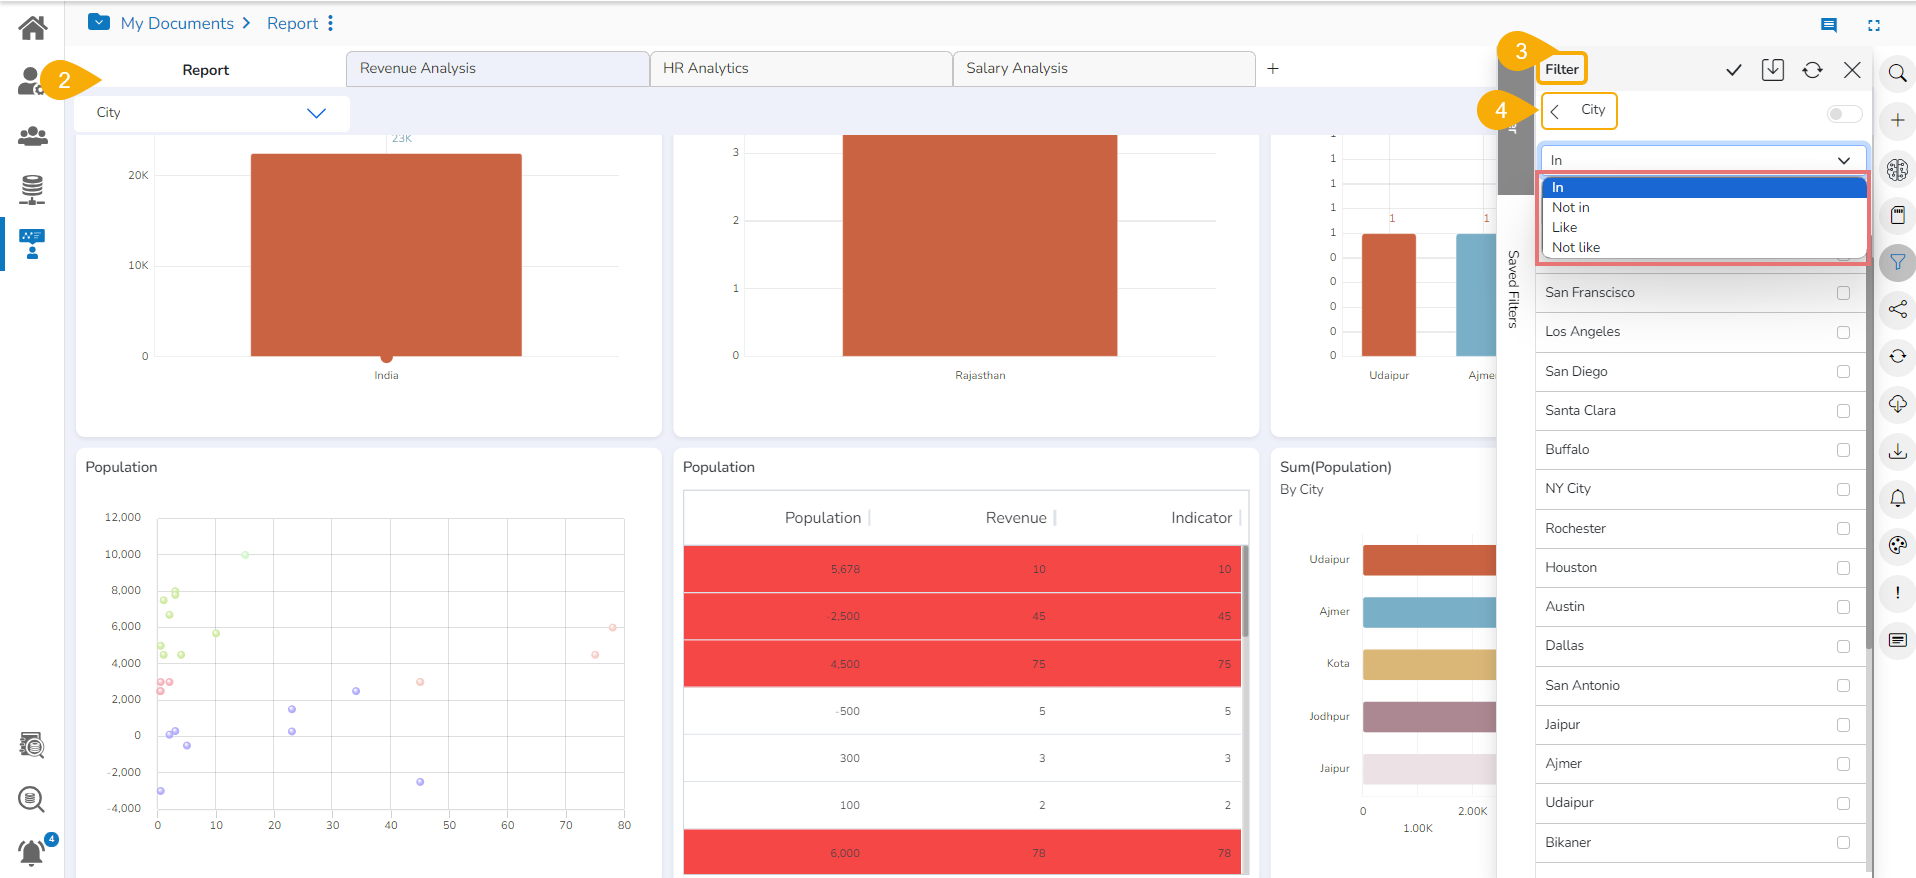
  • Select any of the enabled Dimension values (E.g., the City as Dimension value has been selected in the given image).

    • It displays all the filter operations In, Not In, Like, and Not Like options for the enabled dimension.

Please Note:

  • The disabled Dimension values from the LOV do not display the sub-values and there will be only Like and Not Like options available for the disabled dimension.

  • The enabled Dimension values from the LOV display the sub-values and there will be In, Not In, Like, and Not Like options available for the enabled dimension.

  • The LOV selection specification is applicable to View filter and Global Filter in the Report.

Applying Like & Not Like filter options

The user can successfully apply the Like or Not Like option.

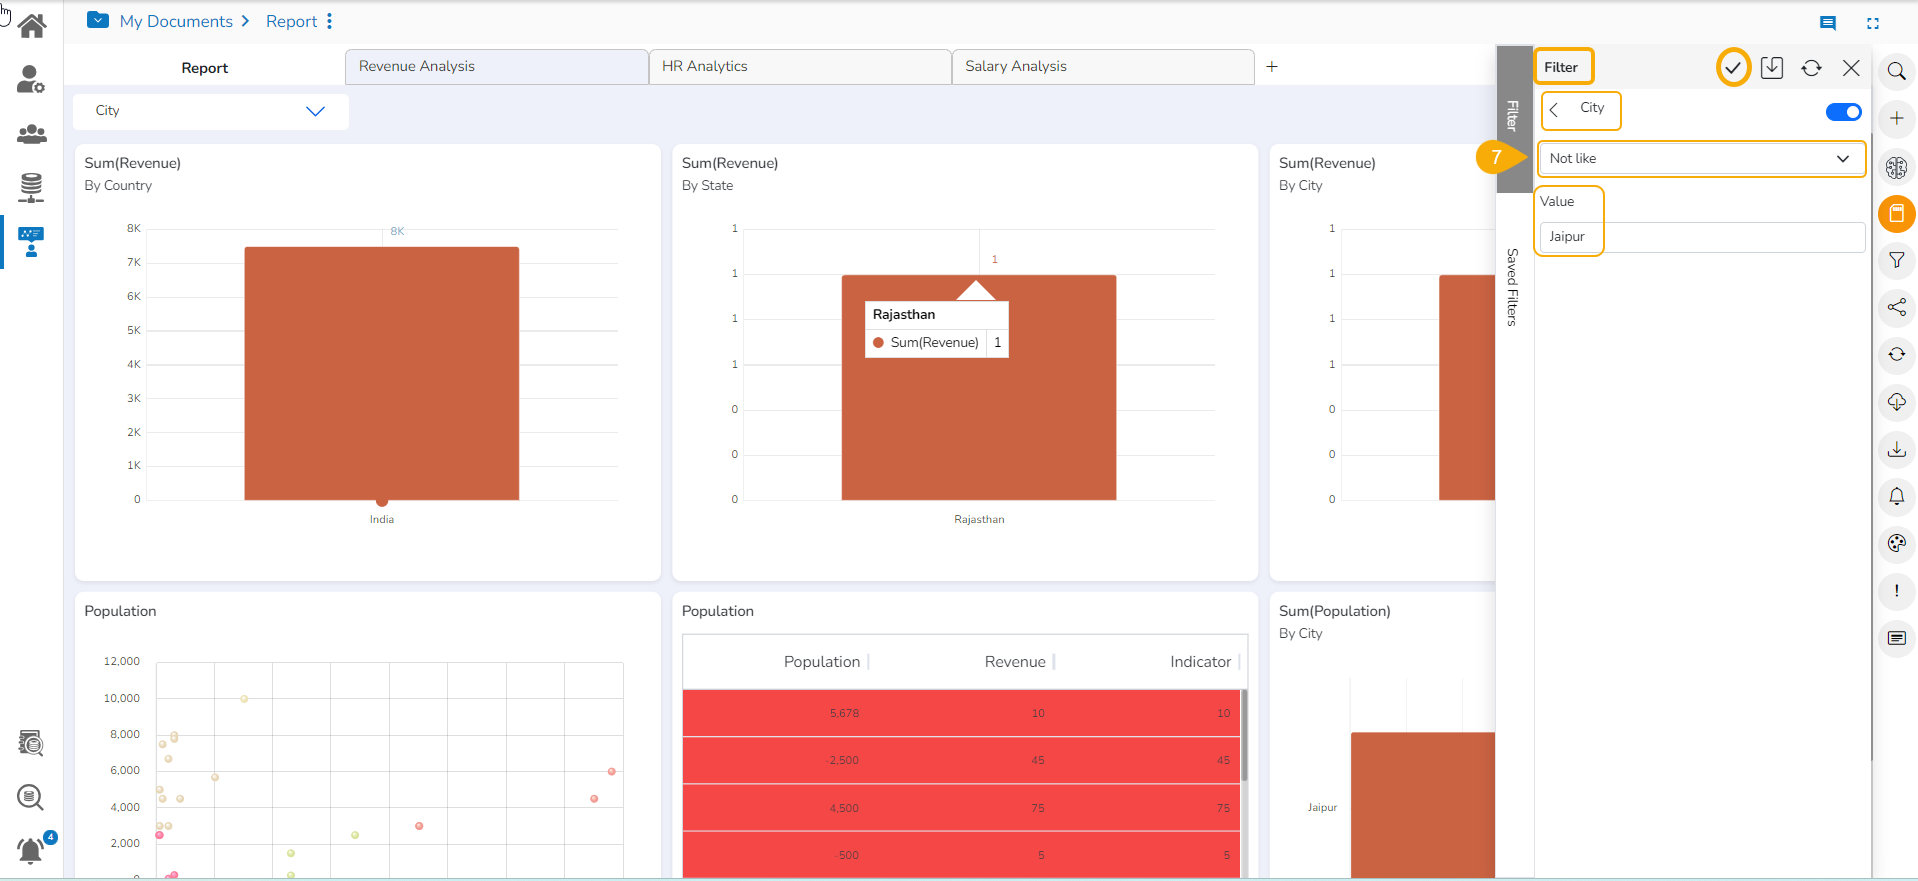
  • Open the Global Filter panel.

  • Select a dimension value.

  • Select an option out of or Not Like choices (E.g., Like option has been selected in this case).

  • Manually provide a sub-value to filter the Report (E.g., Jaipur is the selected sub-value from the City dimension).

  • Click the Apply icon.

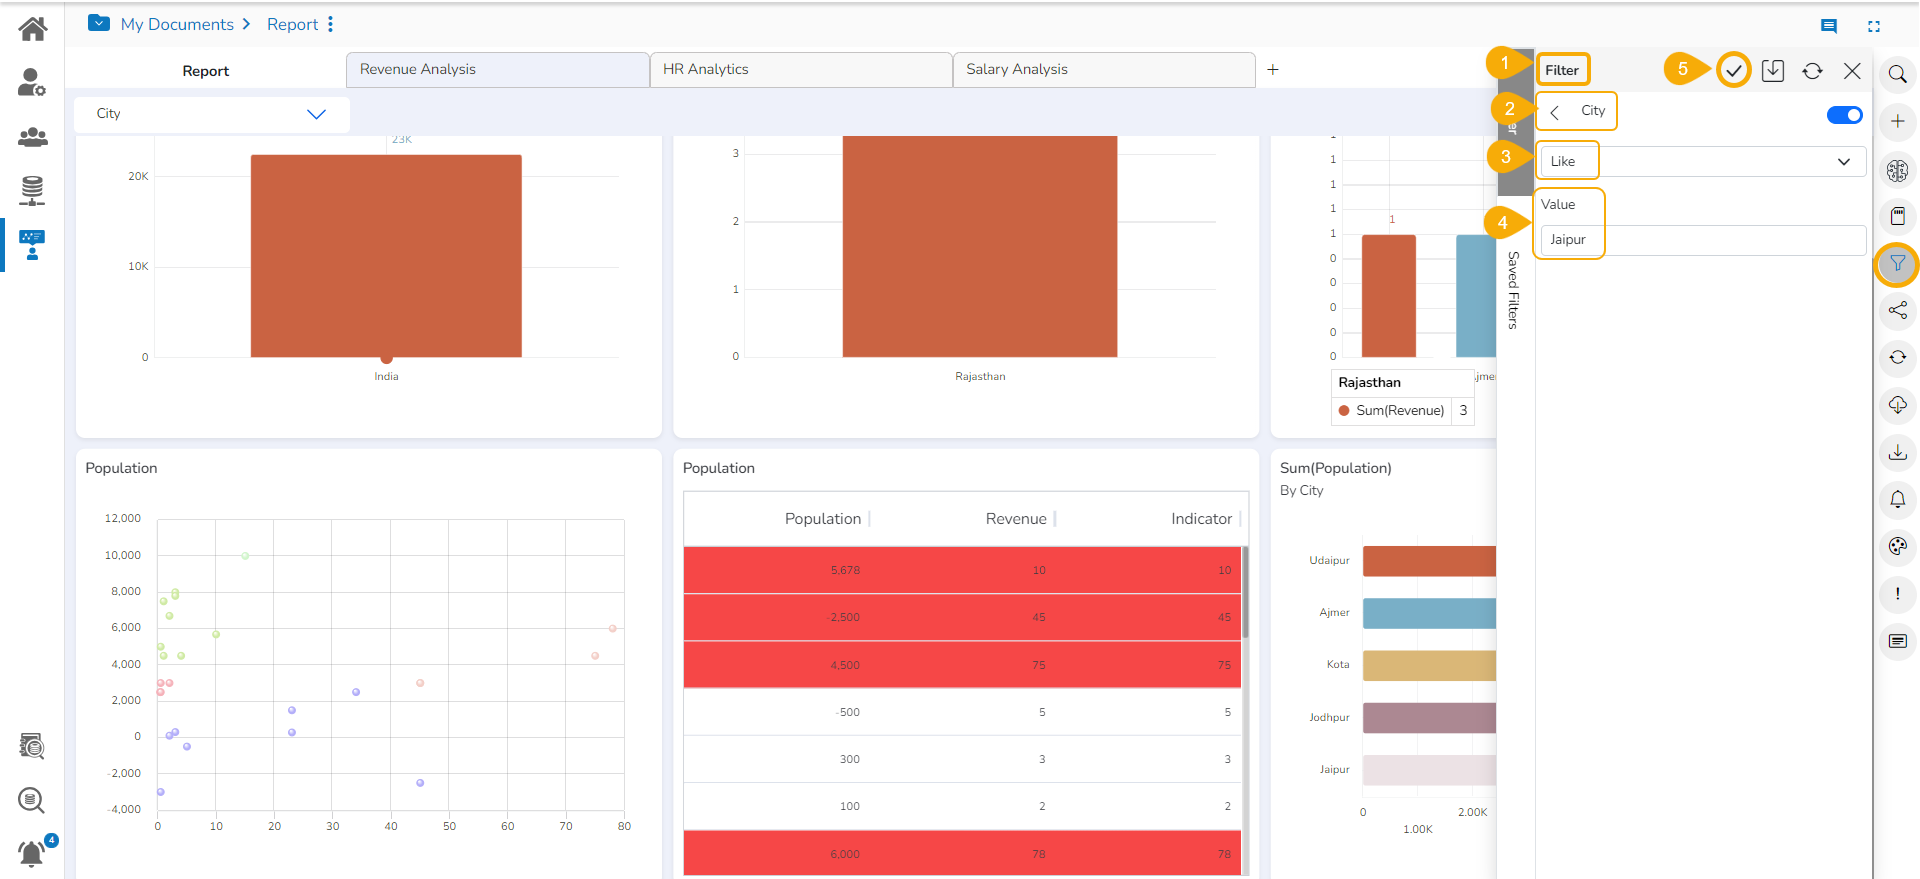
  • The Report Views get filtered by the selected sub-value.

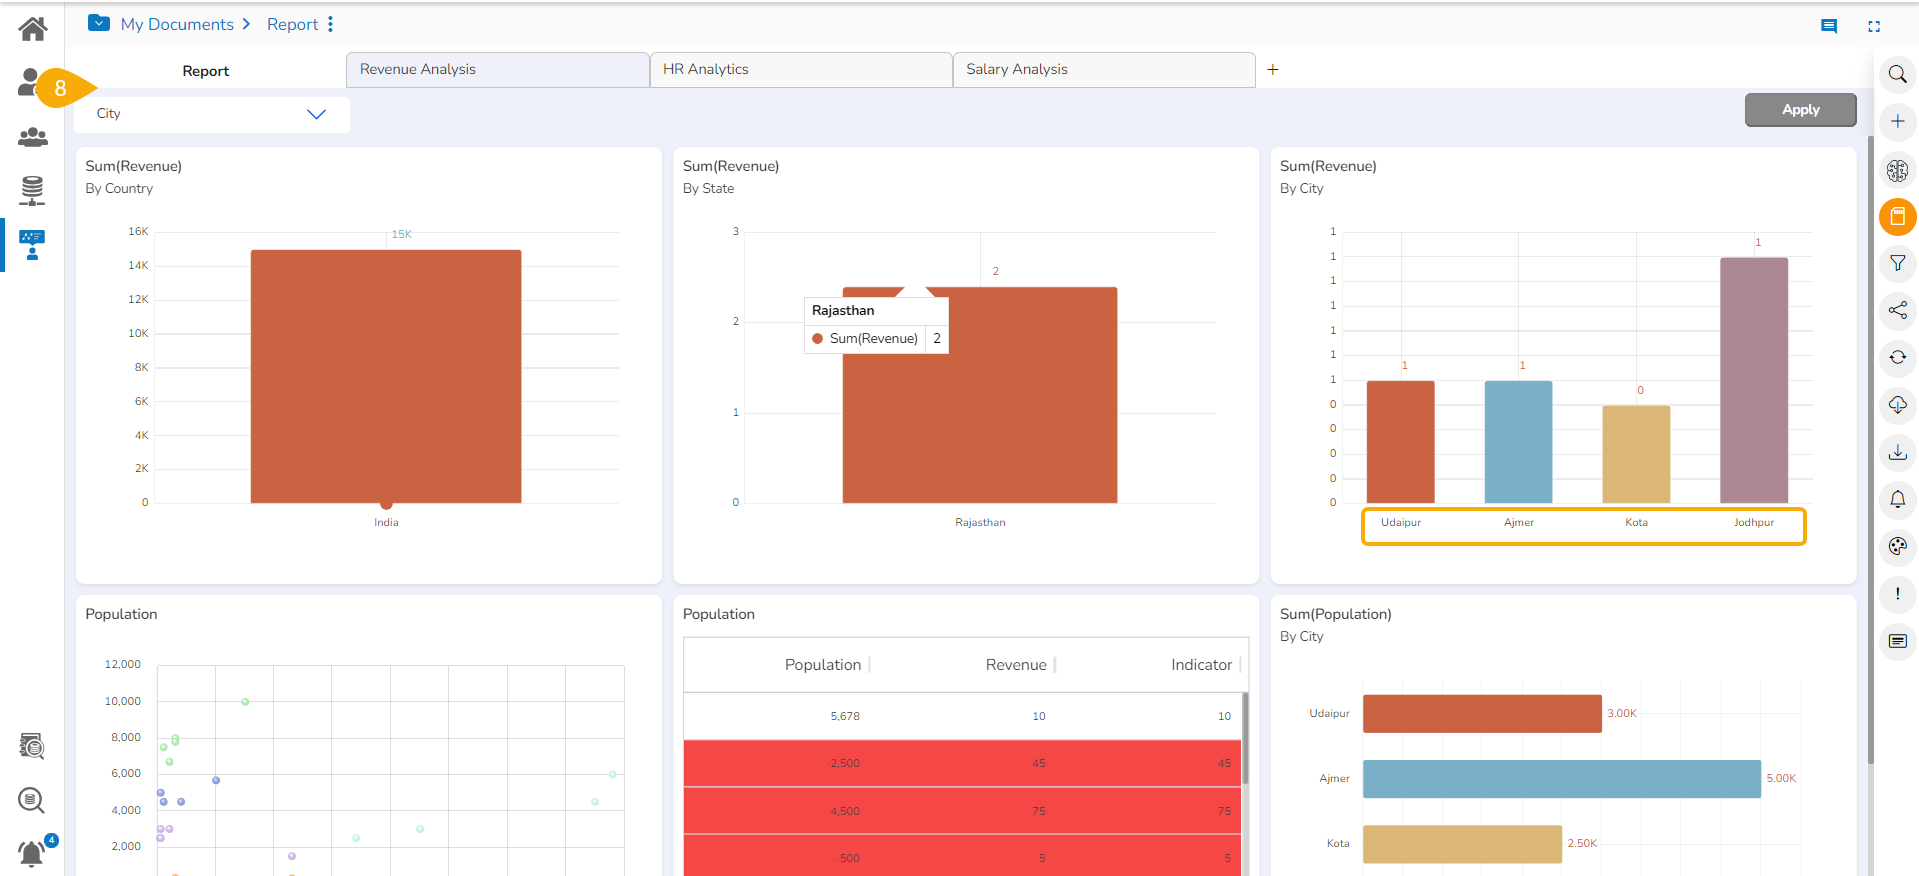
  • Select the Not Like as the filter operation for the same sub-value.

  • The concerned views get filtered, excluding the entered values (E.g., The Report displays filtered data with the values except the data of Jaipur city).

Please Note: The Like and Not Like operations are available in the View Filter panel as well.

Selecting LOV filtering
LOV disabled Dimension Value
LOV enabled Dimension Value
Applying Like option on a disabled value
The Report Views get filtered except the filter value selected as Not In option