Creating and Updating Instance
This section explains steps to create and update instance for a Data Store.
Creating Instance
Prerequisite: Please make sure that the Data Store Settings has been configured from the Admin module to access the Instance functionality for the Data Store inside a Report.
What is a Personalised Store?
The Data Store for which the user can set the TIme To Live (TTL) limit using the Story interface is considered a Personlised Data Store or Personalised Store.
What is the limit for TTL? What is the maximum limit for TTL?
The Time to Live (TTL) for the data will be of 1-30 days. The maximum limit provided for the TTL is 30 days.
Check out the given walk-through on how to create an instance for an existing datastore under the Personalised category.
The Create Instance option is used to load the data for the first time from the datastore into Elastic, MongoDB, ClickHouse server as the configuration done in the Admin Module for the Datastore Settings.
Navigate to the Data Store list inside a Create New Report dialog box.
The Select Data Store page opens listing all the available Data Stores.
Select the Personalized Data Store Category.
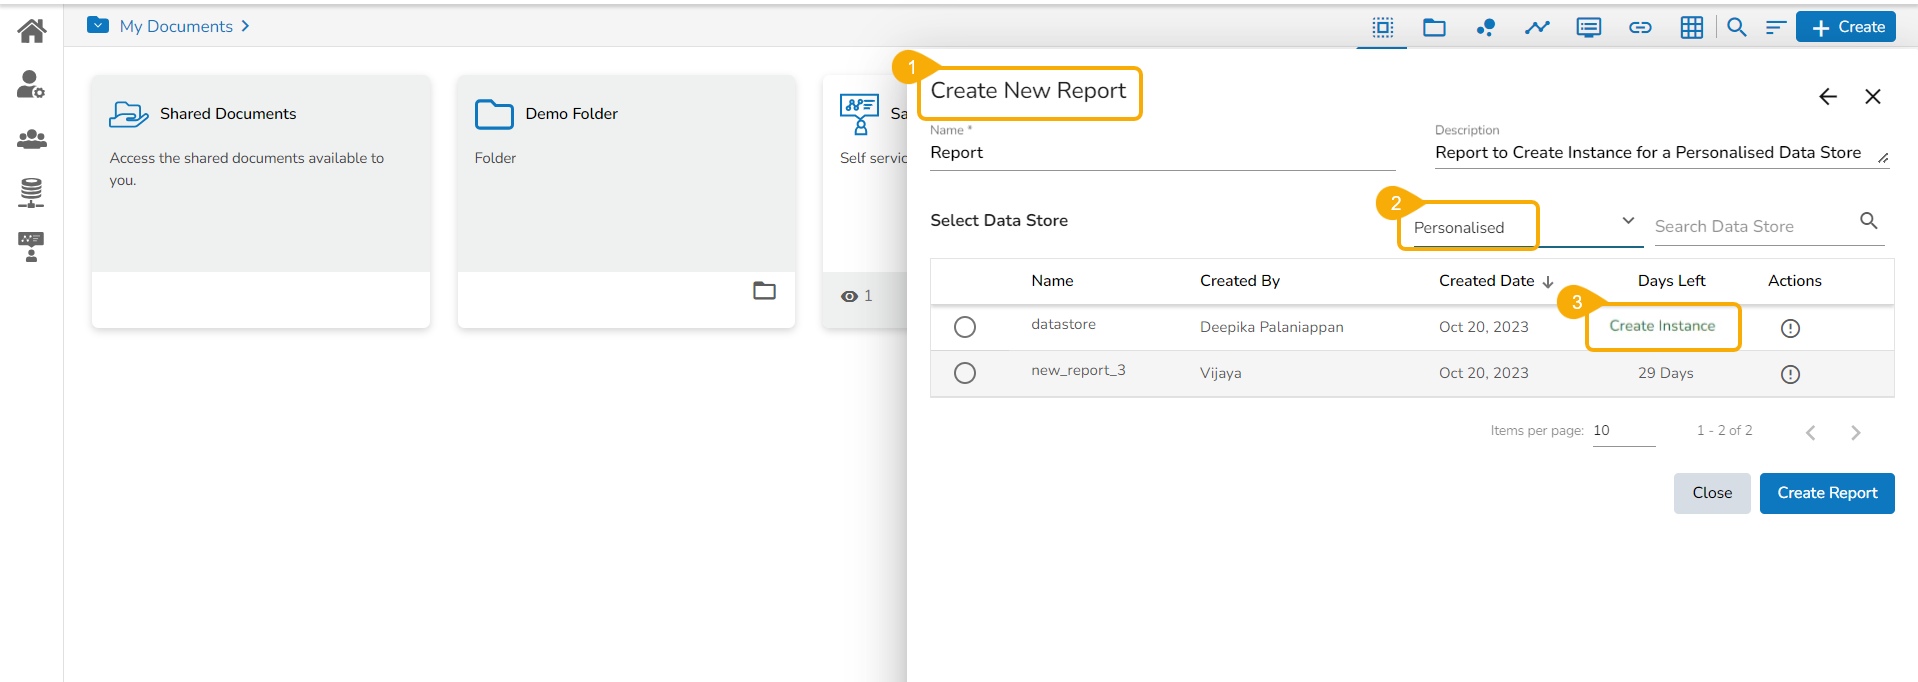
Search for a Data Store in the given search bar.
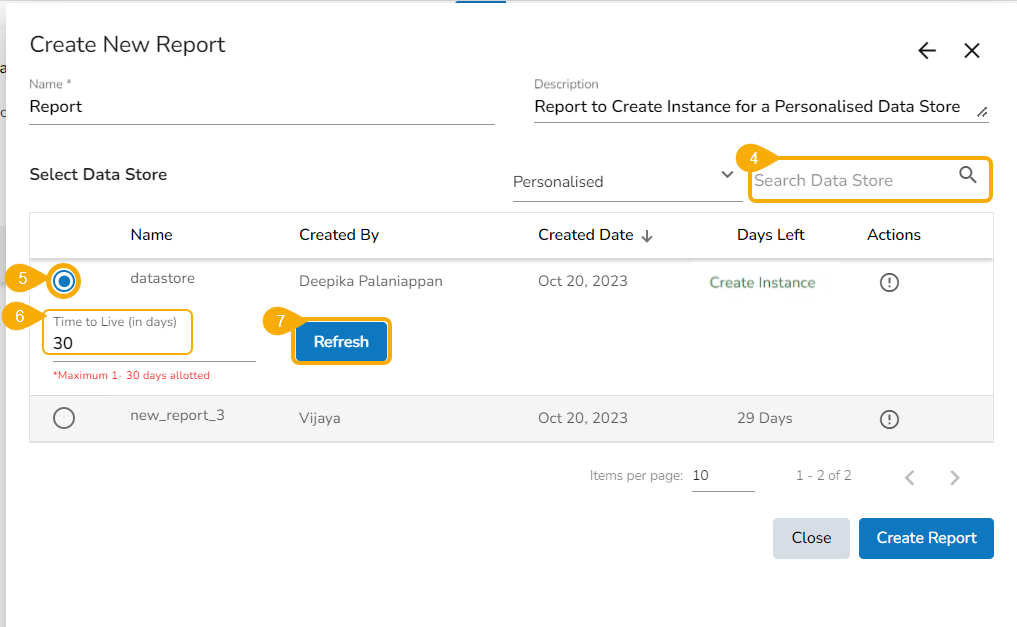
Select a Data Store by using the checkbox.
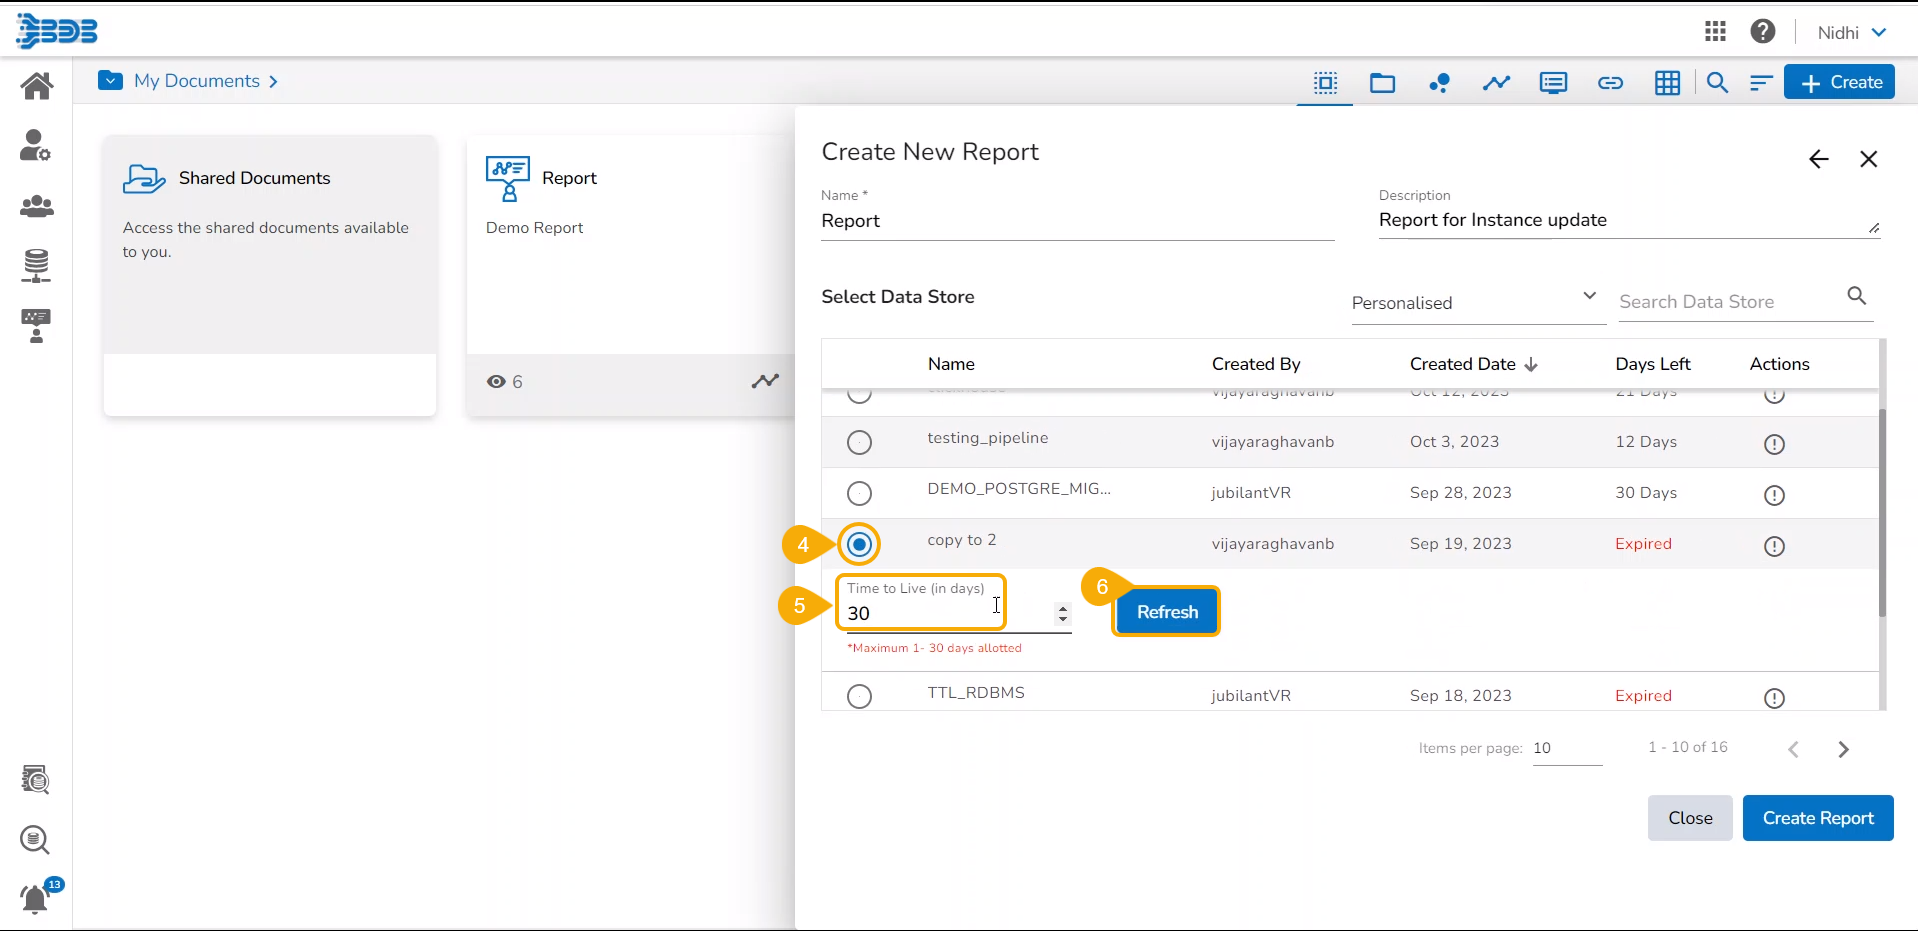
Click the Data Store to open the Time To Live (in days) option. Provide the no. of days for the selected Data Store to create new instance.
Click the Refresh option.
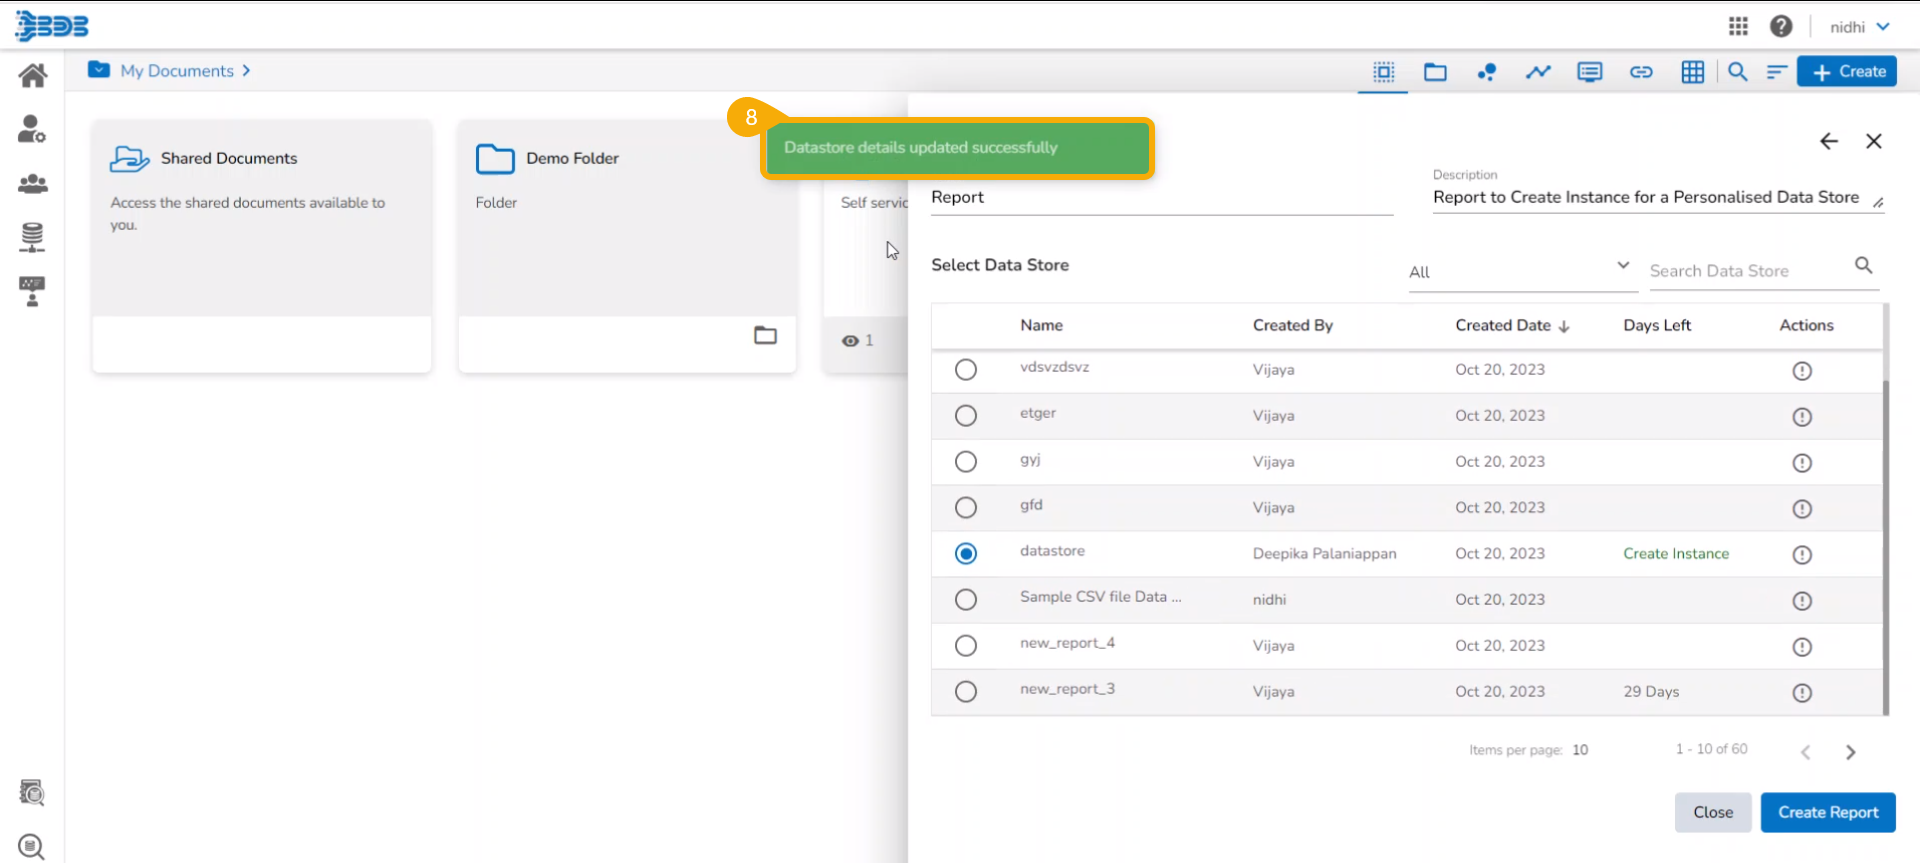
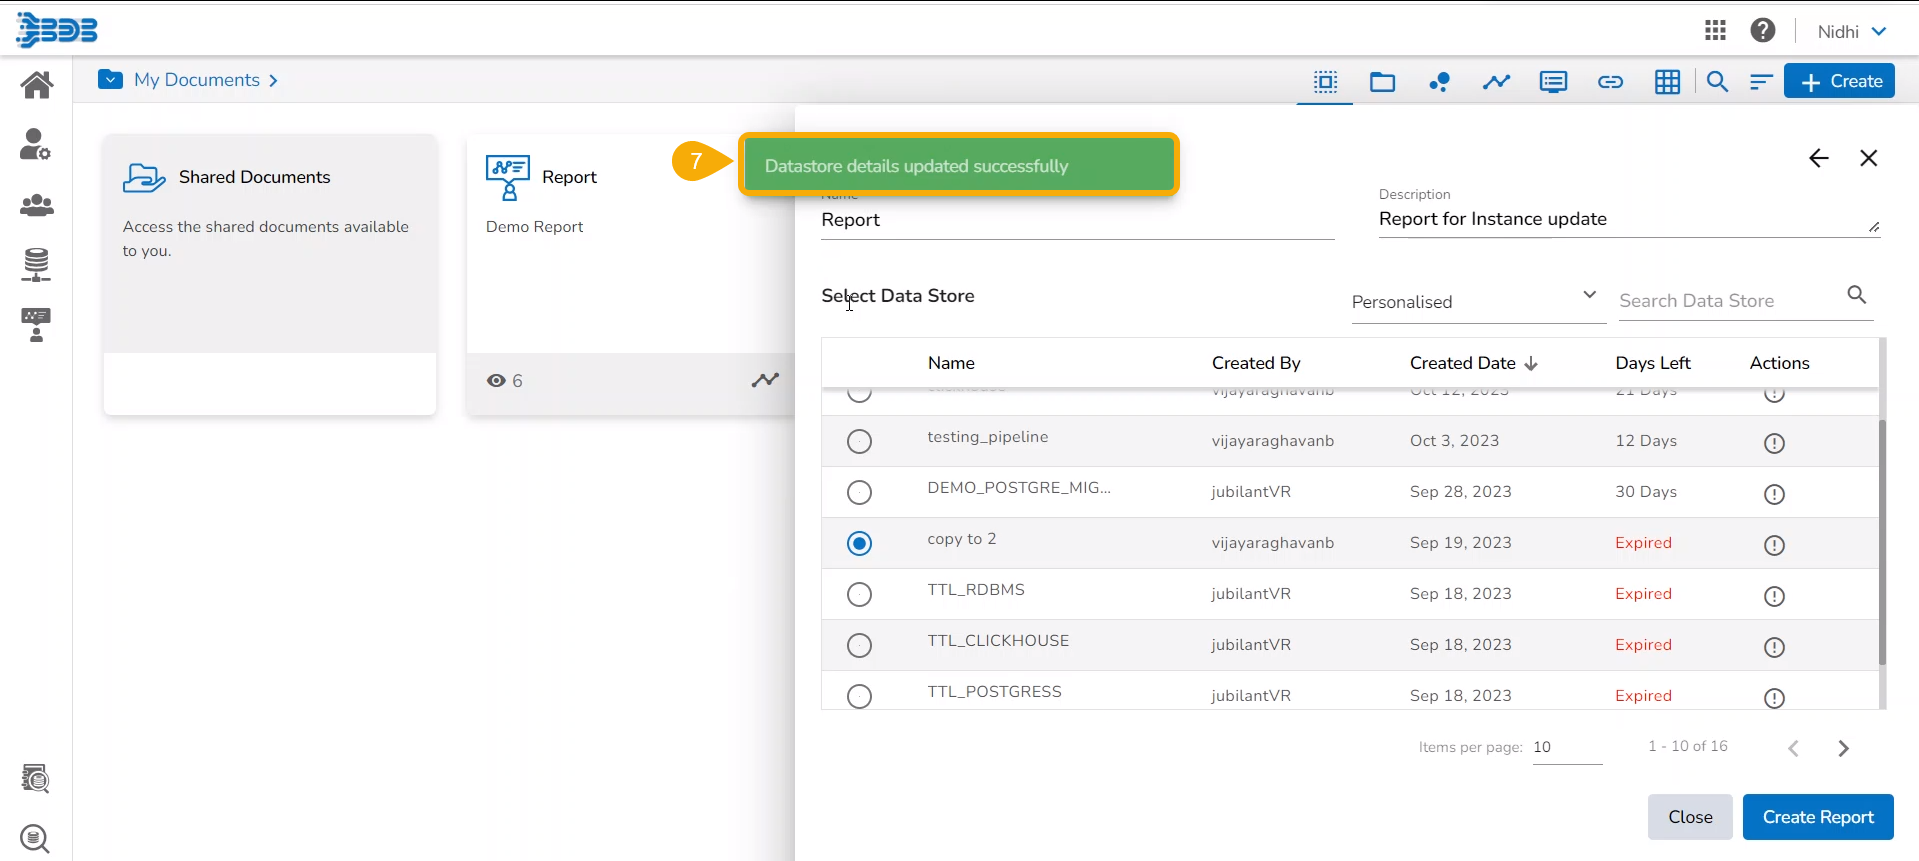
A confirmation message appears to update the Data Store details.
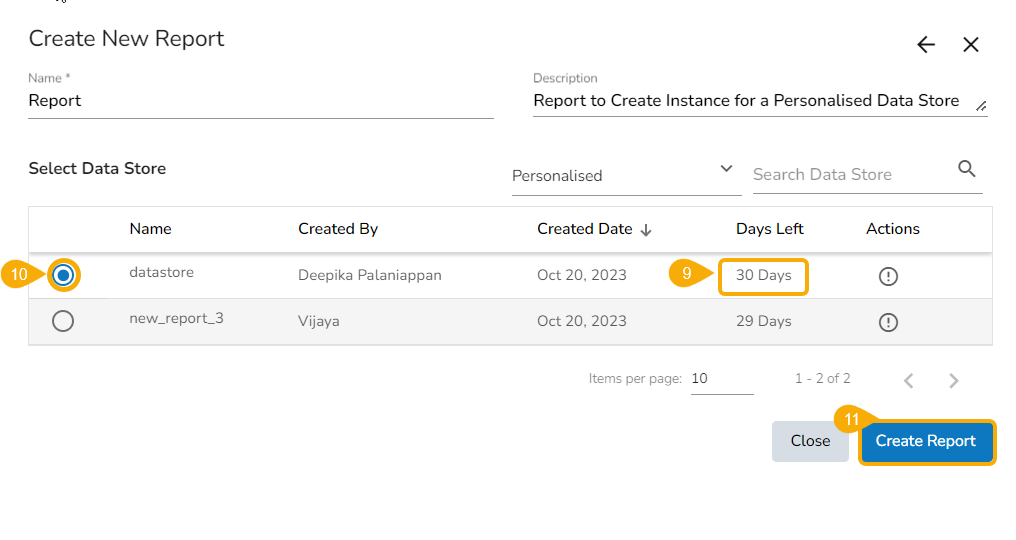
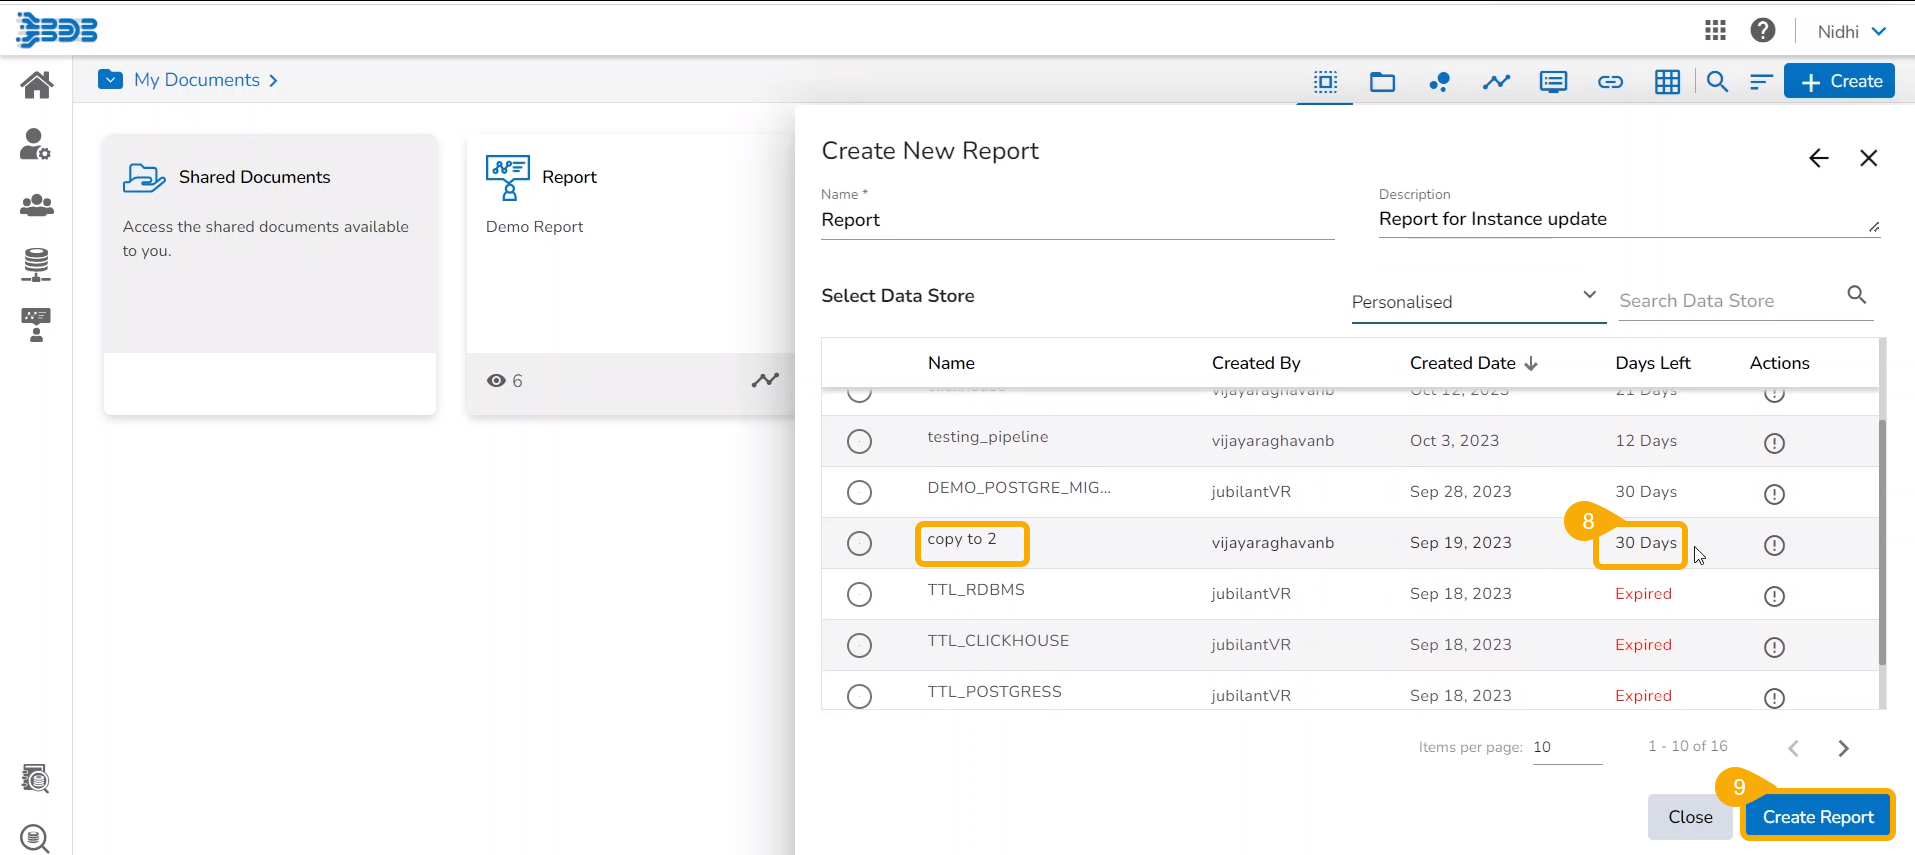
The concerned Data Store starts displaying the Days Left option based on the provided no. of days while setting the TTL.
Select the Data Store by using the check box.
Click the Create Report option to proceed with the View creation.
Updating Instance (Under Progress)
The permitted Time to Live limit for a Data Store is only 30 days (maximum). If it goes above that, data will not be present in the Report
. Hence, the user can manually update the instance. The Days Left column will highlight such condition as flashing Expire status in the red color. Click the user gets redirected to update the instance for the selected Data Store so the data will be refreshed again in the ES or MongoDB.
Check out the given walk-through on how to update instance for a Personalised Data Store.
Navigate to the Create New Report page.
Filter the Data Store list with Personalised category.
Select a Data Store from the Personalised category that has been expired.
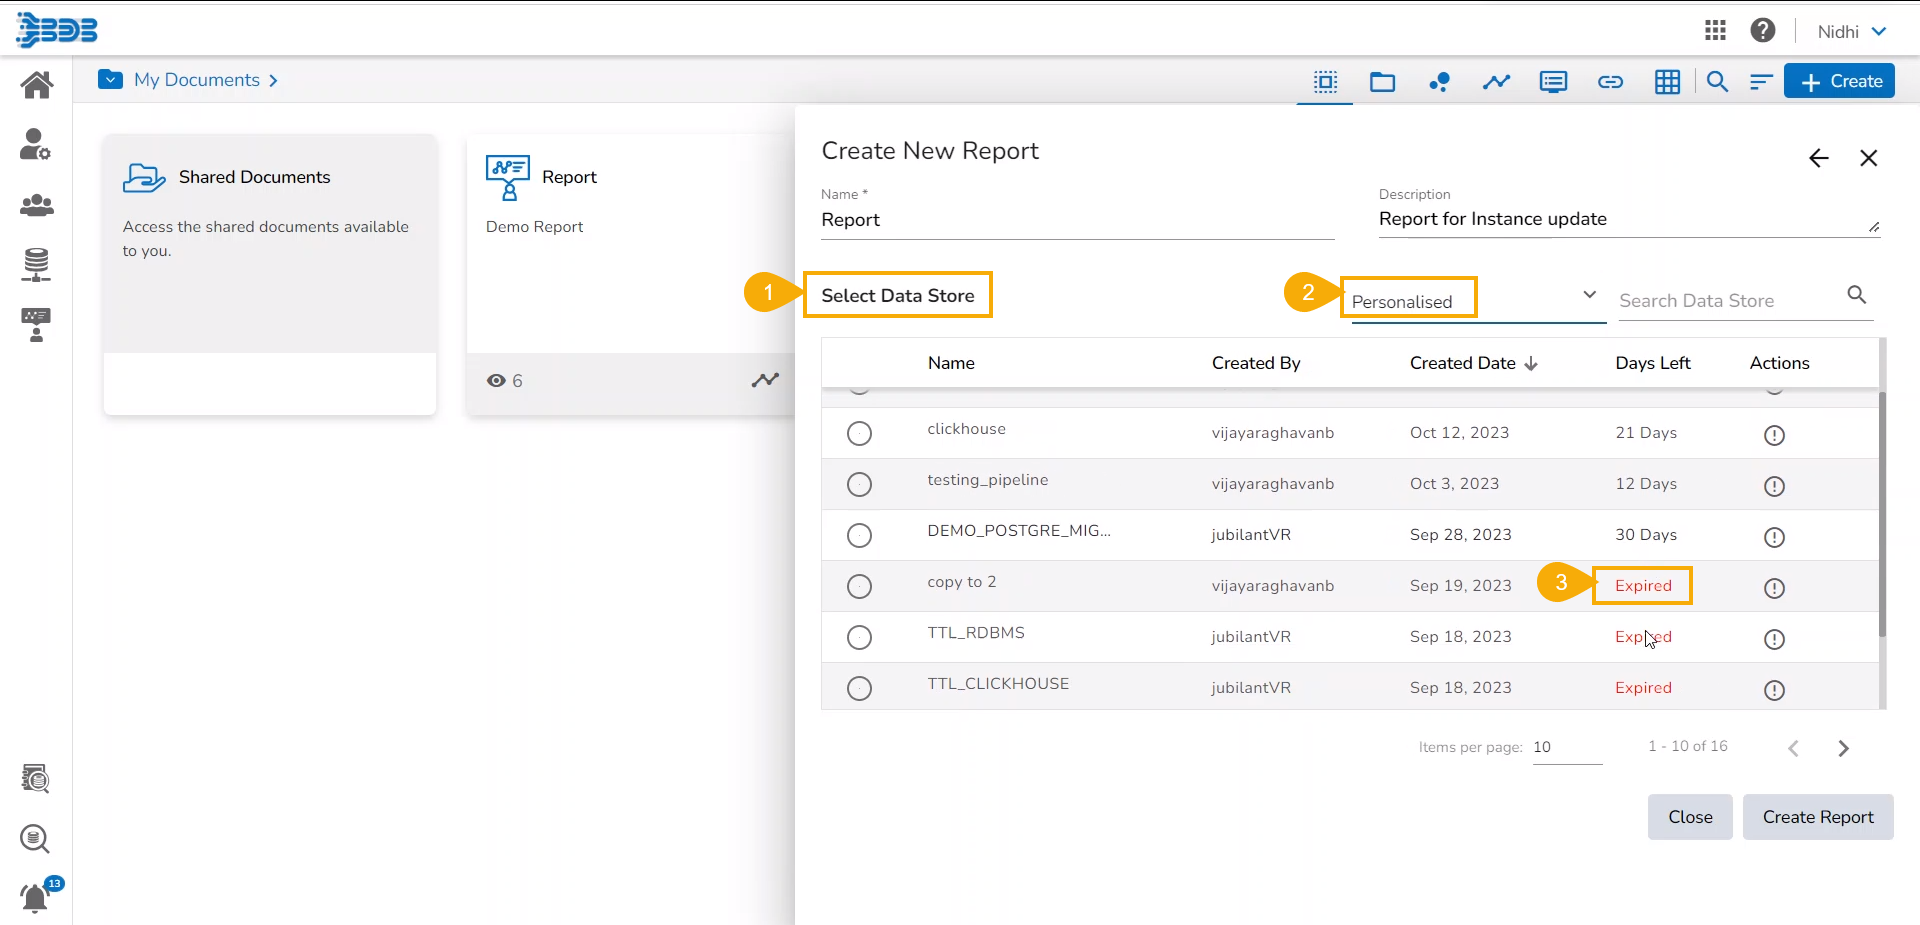
Select the Data Store by using the checkbox provided next to the Data Store.
Click on the Datastore to open the Time to Live (TTL) option. Mention no. of days (up to 30 days is allowed for TTL).
Click the Refresh option.
A notification message appears to inform about the successful update of the Data Store.
The Data Store gets refreshed, and the inserted no. of days get reflected under the Days Left column.
Click the Create Report option to start with View creation part of the Report.
Please Note: The user can distinguish between Datastores:
Distinguish between instances and scheduler-based data stores.
Distinguish between the Active and Expired instances.
The Expired Data Stores are mentioned with the Expired Status.