Data Sheets are used to capturing various process, mechanical, electrical, technical, and control requirements for equipment and instruments. The sheets incorporate information about the selected components, usually with input from multiple users.
Best Situation to use Data Sheet Grid
To collect information from various users. To bring the collected information from the various users to one place. To search, filter, and compare the collected data.
Default Data Sheet Chart Image
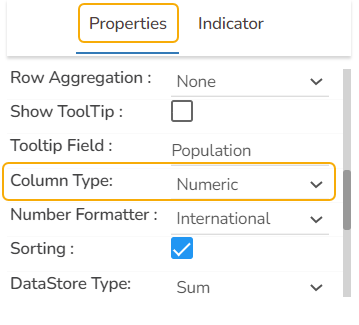
Properties of the Data Sheet component:
The user can change the height, width, top, left.
The user can change the background color of the chart, can get the border for the chart and can change the border color, can get the reflection of the chart by enabling the shadow option can also change the color and increase & decrease the transparency of the shadow
The user can change Title Name, Font color, Font size, Font style, etc.
The user can enable the subtitle to display the second title. The user can change the Name, Font color, Font size, Font style for the subtitle.
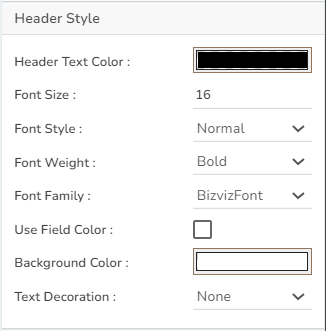
The user can change the header text color, font size, font style, and background color.
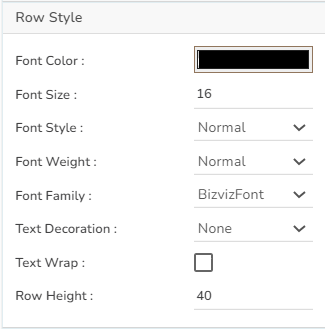
The user can change the font size, font color, text decoration, enable the text wrap, and increase the row height.
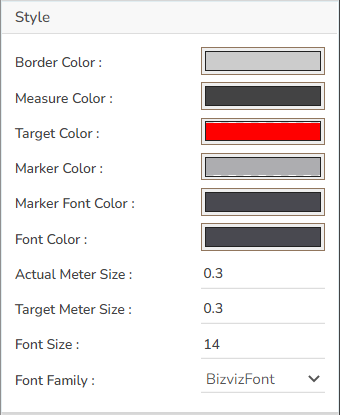
The user can change the grid colors.
Data Sheet variants by changing the Properties