# Mixed Chart
{% hint style="success" %}
*Check out the below given walk-through on how to use the Mixed chart component in Designer module.*
{% endhint %}
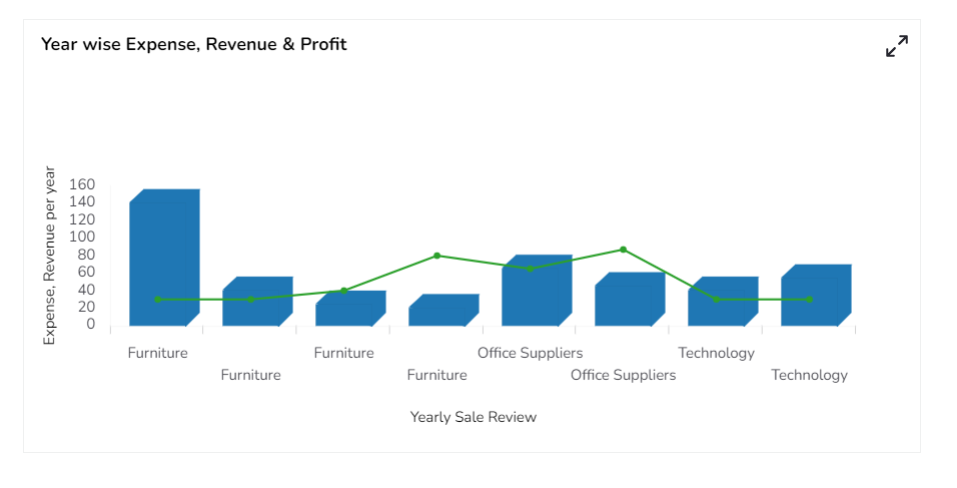
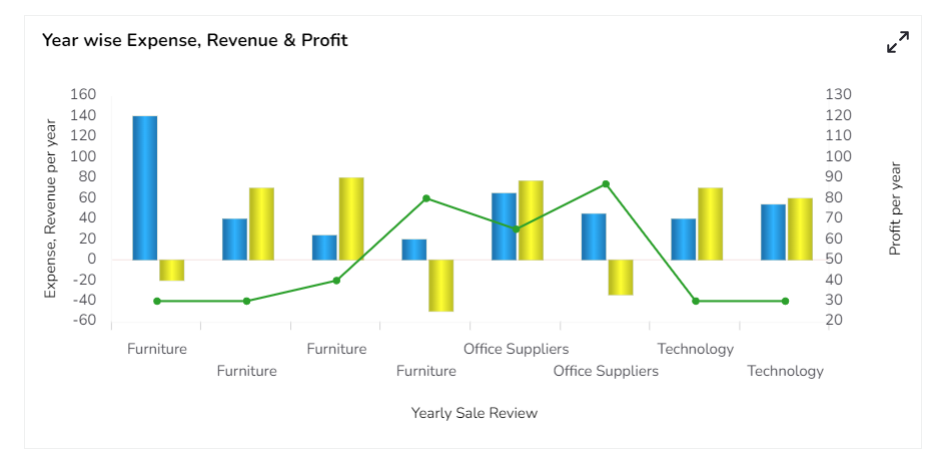
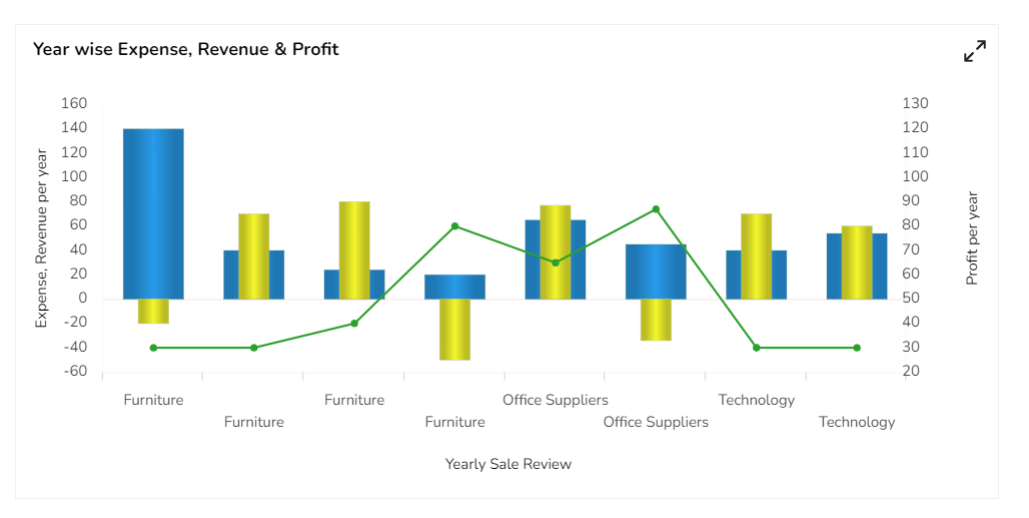
The mixed chart is a combination of line-chart and column chart. It can plot 3- series of data on the chart. Mainly used to emphasize a different series of information on the chart.
## **Best Situations to Use a Mixed Chart**
To compare multiple categories Example: To analyze the company's budget v/s revenue.
### **Variations of this chart**
* **Use stacked Column charts:** Where multiple categories can be clubbed together on top of each other which makes addressing multiple questions easier.
* **Use columns side by side:** Where comparison between multiple categories becomes easier instead of toggle between charts and data.
* **Add color for quick insight:** Where displaying columns with colors will make users pay quick attention to important tasks.
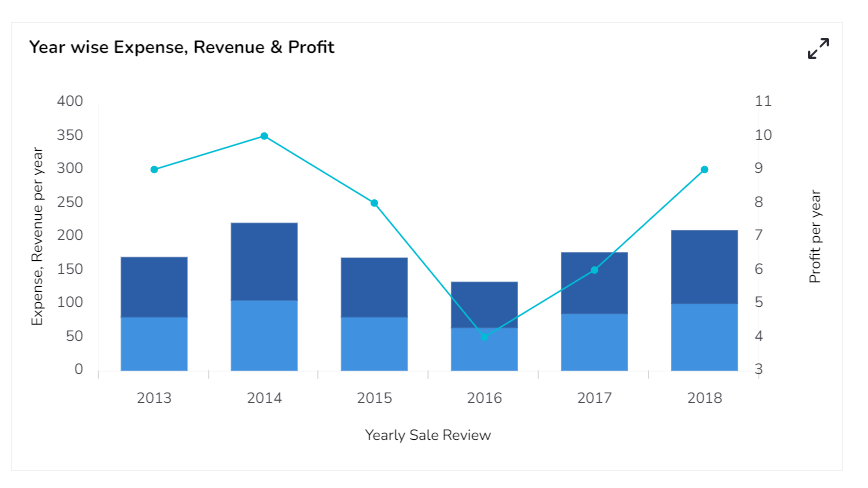
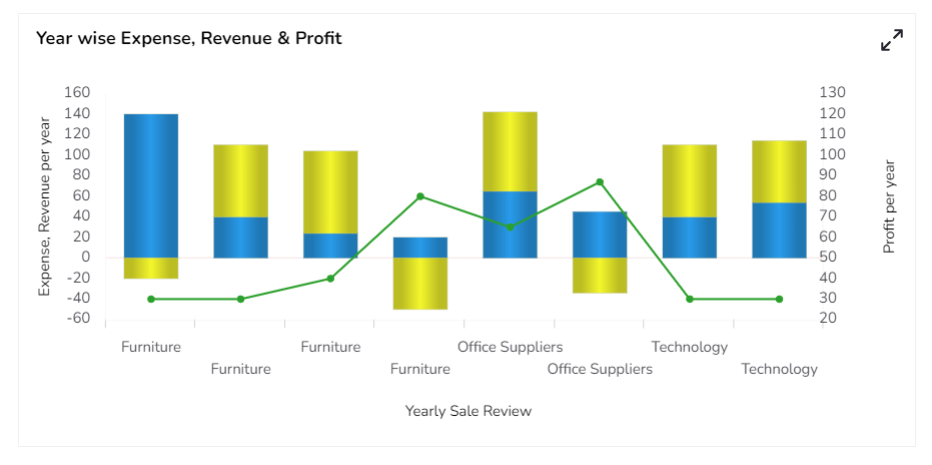
## **Default Mixed Chart Image**
## **Properties of the Mixed chart**
### **Axis Setup**
The user can enable the Auto axis, the Base Zero value, Horizontal & Vertical marker line, zero marker line and can change the color of lines, increase or decrease the color Transparency by opacity.
### **Background**
The user can change the background color of the chart, can get the border for the chart, and can change the border color, can get the reflection of the chart by enabling the shadow option can also change the color and increase & decrease the transparency of the shadow.
### **Export Options**
The Export Options also helps to provide heading, subheading, file name. The user can also select an option for ***Global Export Type***.

The user can enable the ***Enable Context Menu*** from the preview section to download the reports in different formats.
Accessing Export Context menu in the Preview mode
### **Formatter**
The user can change Y-axis values in units to %, T, Lacs, M, etc. Precision if we want the value in decimal format. Currency if we want the value in INR, Pound, USD. Position of the currency if it's in prefix and currency in Rupee then the sign will be seen in left side if it's in suffix then it will be seen in right-side. Number Formatter if we want it in Indian or international.
### **General**
The user can change the height, width, top, left, chart type, column type & Line form. In this case, we have changed the chart type stacked, base type to plain & line form to segment.

**Legend**
The user can enable the internal legend if we want to show and can change the font size, color, style, etc.
**Second Axis**
The user can enable the second axis if we want to show any serial value according to the second axis.

**Subtitle**
The user can enable the subtitle to display the second title. The user can change the Name, Font color, size, style for the subtitle.
**Title**
The user can change Title Name, Font color, size, style, etc.

**Tooltip**
The user can show the description of the series can use the tooltip by enabling it.
**X-Axis**
The user can change the axis name, Font color, Font size, Enable the axis line, and the axis color.

**Y-Axis**
The user can change the axis name, Font color, Font size, Enable the axis line, and the axis color.

**Dataset Series Properties**
The user can change the color of each bar by selecting any of the series. There is an option to change the column type as well. Select either Line or Column options.
## **Properties Tab from the Dataset Pallet**

### **Modified Properties Tab from the Dataset Pallet:**

## **Variants of the Mixed chart by changing the Properties**
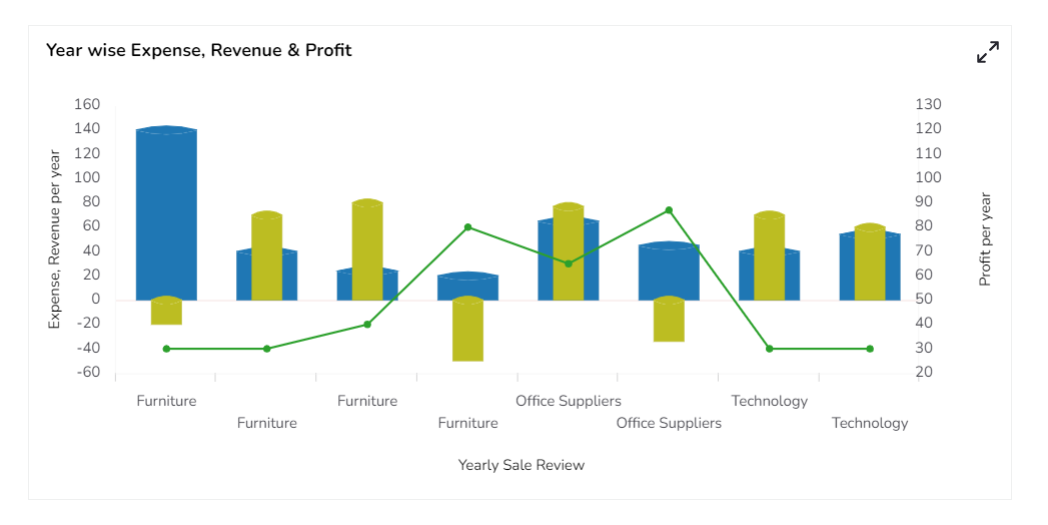
### **Various Stacked Chart & Segment Line**
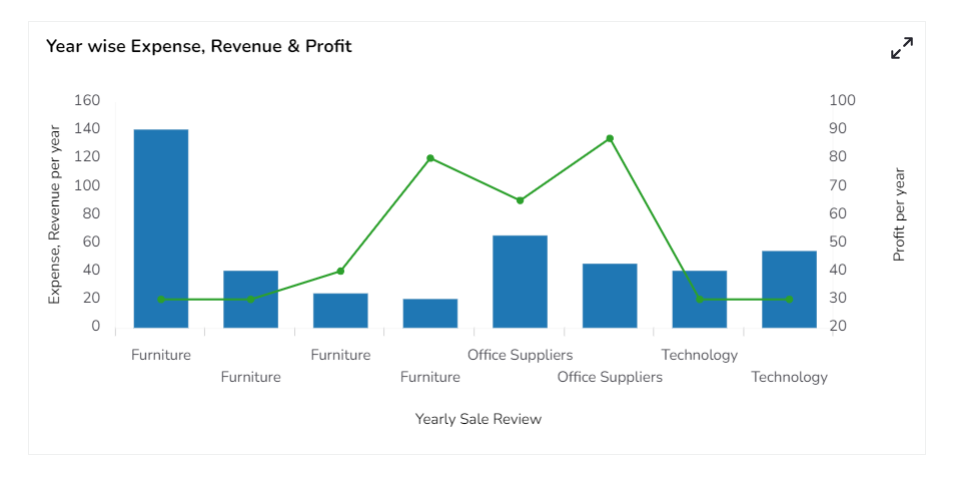
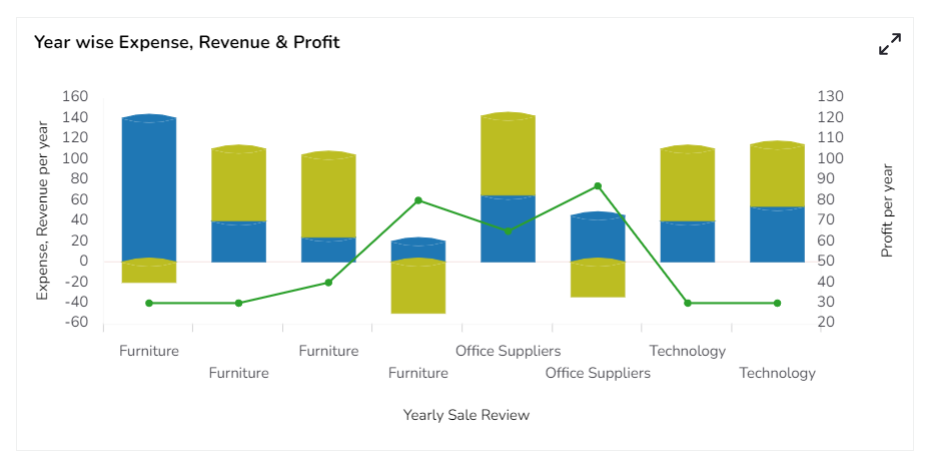
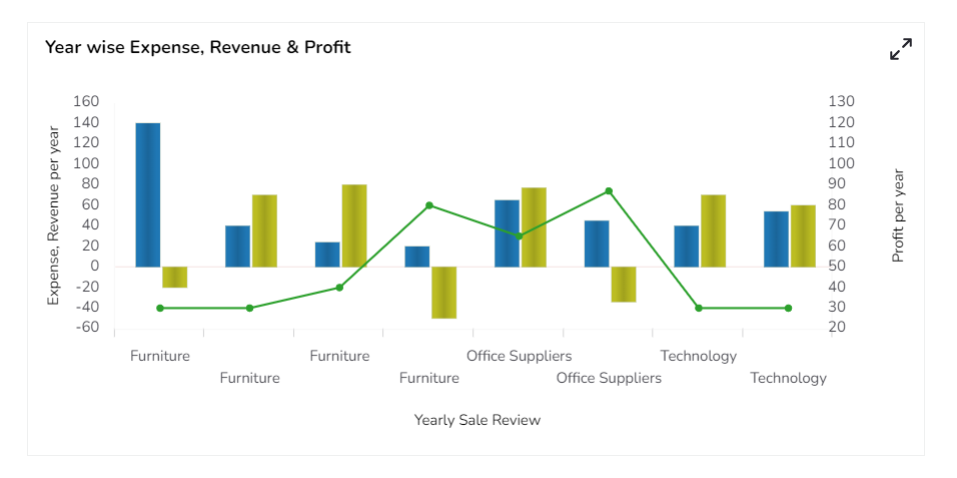
#### **Mixed Chart with Plain base Stacked Chart & Segment line**
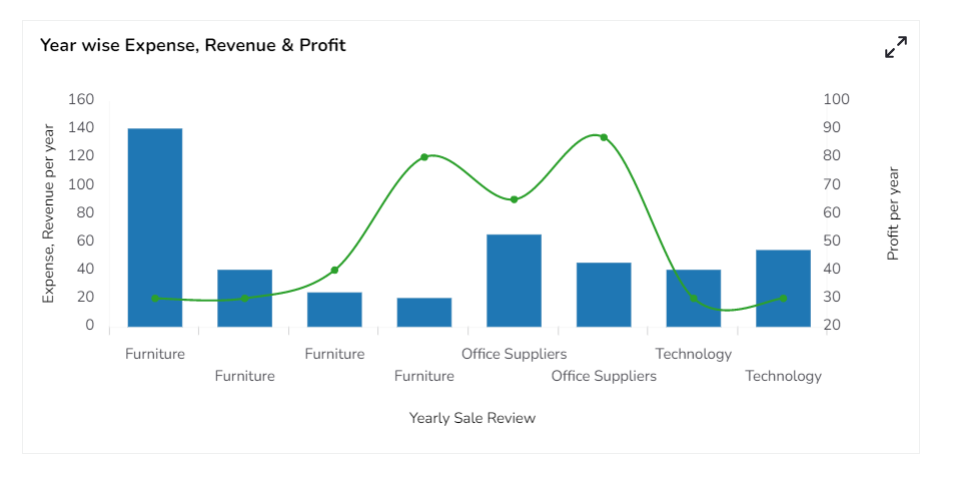
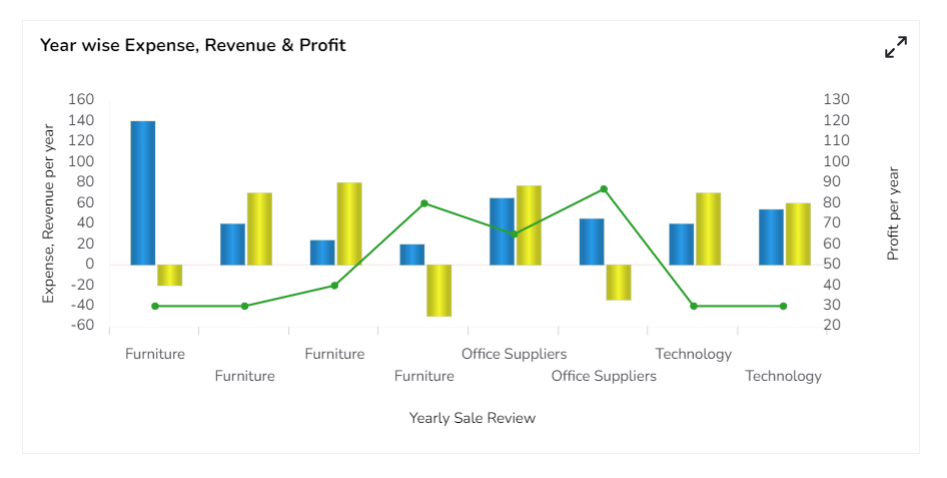
#### **Mixed Chart with Plain base Stacked Chart & Curve line**
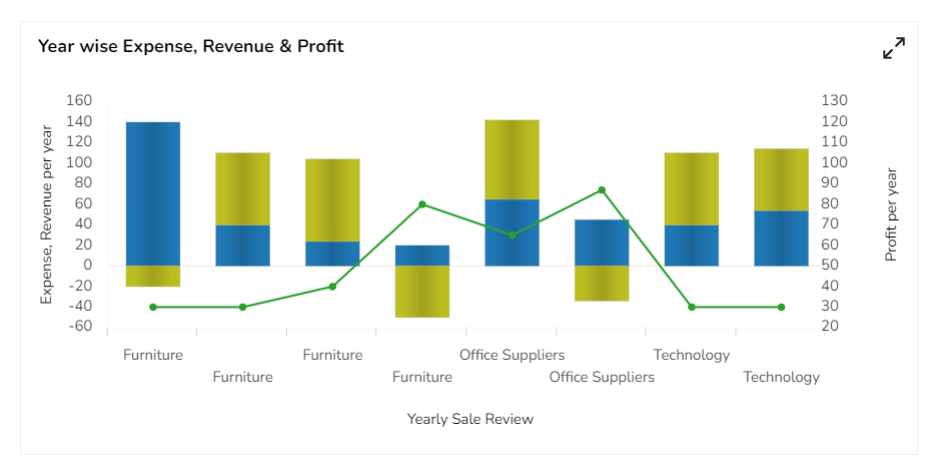
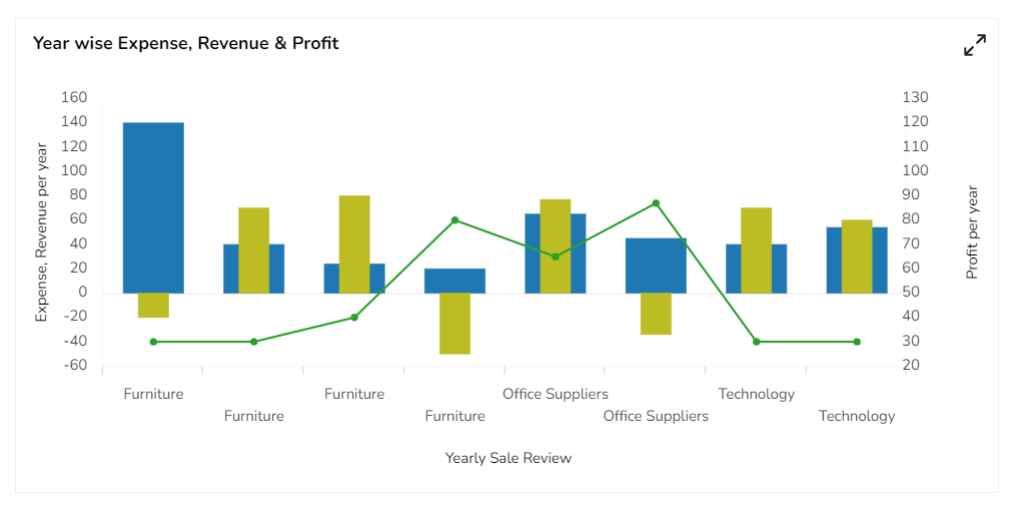
#### **Mixed Chart with Rectangle base Stacked Chart & Segment line**
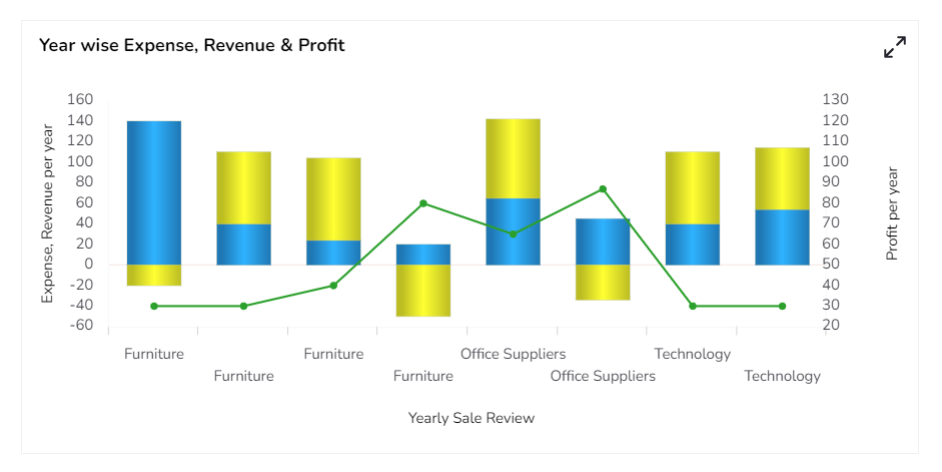
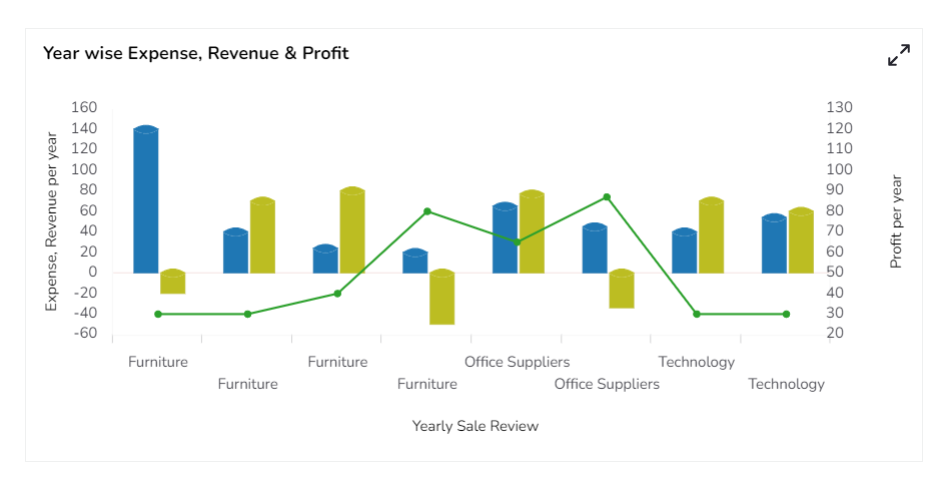
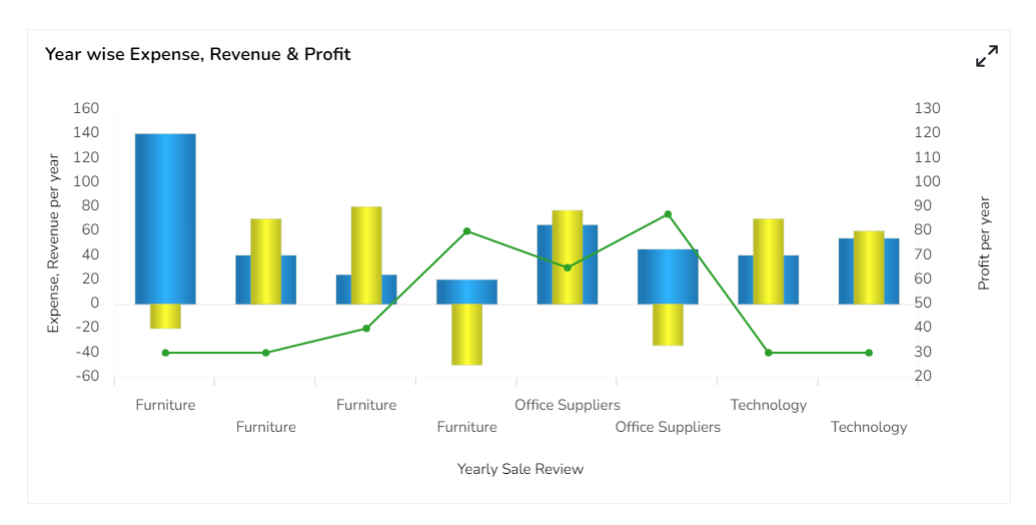
#### **Mixed Chart with Cylinder base Stacked Chart & Segment line**
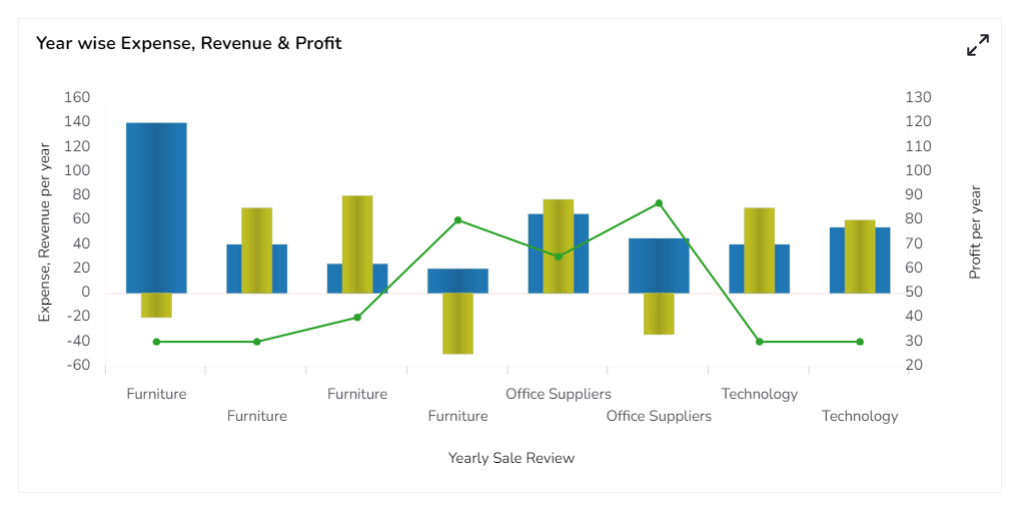
#### **Mixed Chart with Gradient1 base Stacked Chart & Segment line**
#### **Mixed Chart with Gradient2 base Stacked Chart & Segment line**
#### **Mixed Chart with Gradient3 base Stacked Chart & Segment line**
### **Clustered Chart & Segment Line**
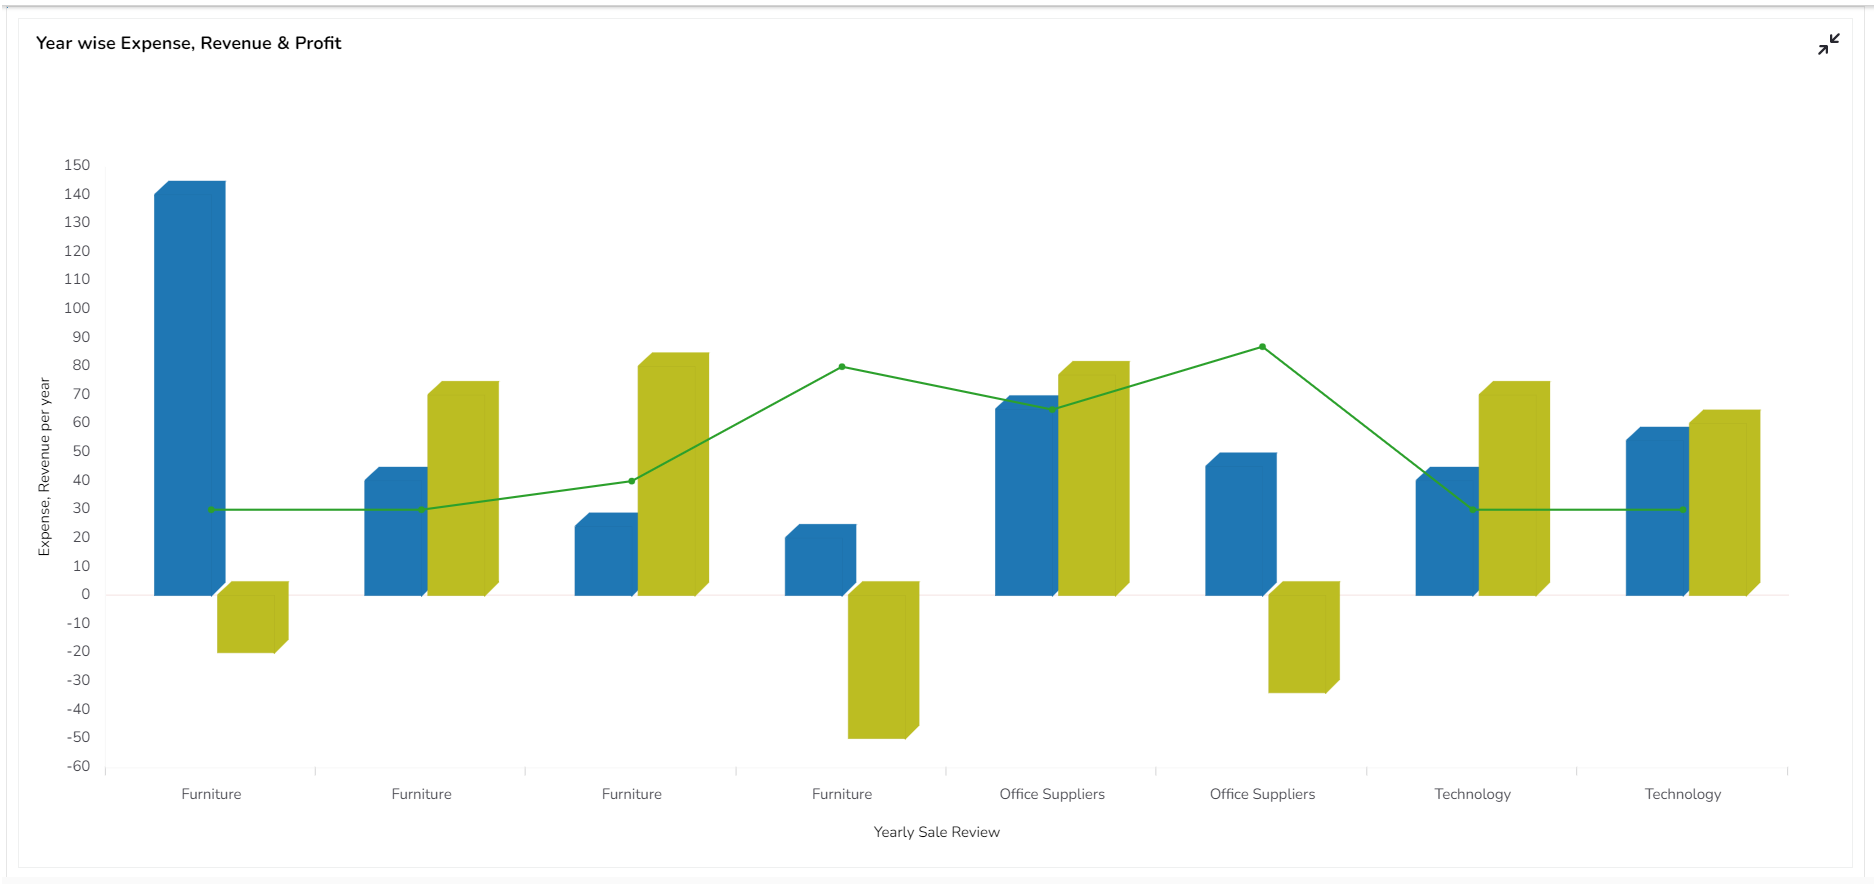
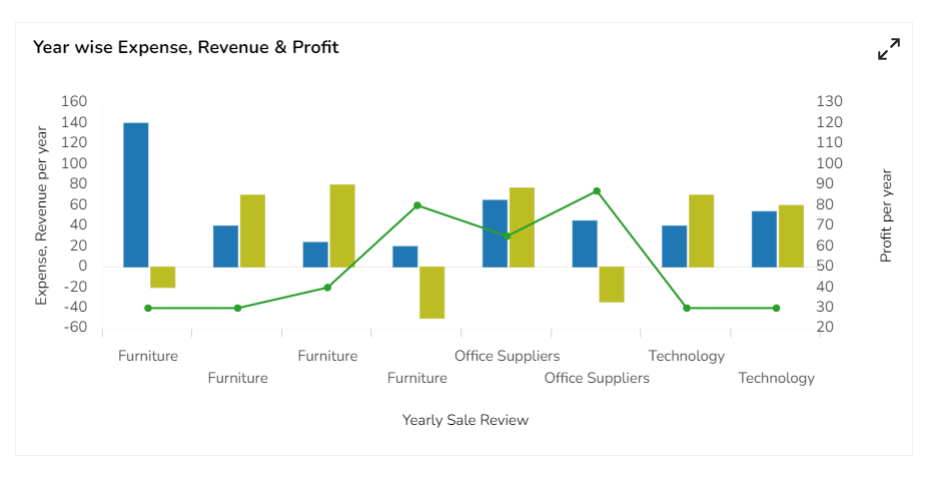
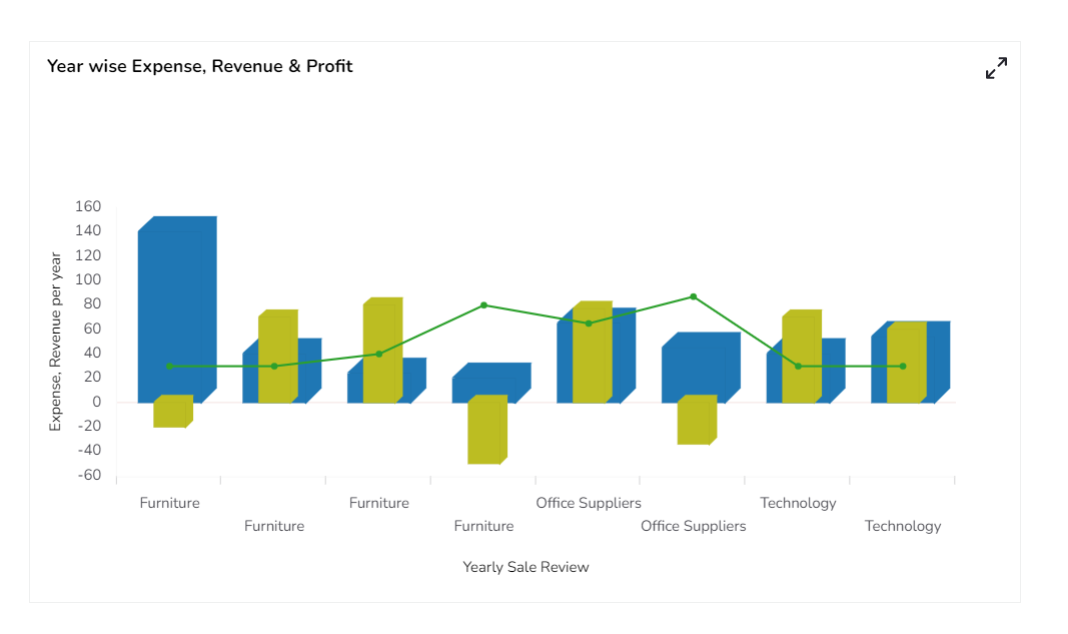
#### **Mixed Chart with Rectangle base Clustered Chart & Segment line**
#### **Mixed Chart with Cylinder base Clustered Chart & Segment line**
#### **Mixed Chart with Pain base Clustered Chart & Segment line**
#### **Mixed Chart with Gradient1 base Clustered Chart & Segment line**
#### **Mixed Chart with Gradient2 base Clustered Chart & Segment line**
#### **Mixed Chart with Gradient3 base Clustered Chart & Segment line**
### **Overlaid Chart & Segment Line**
#### **Mixed Chart with Rectangle base Overlaid Chart & Segment line**
#### **Mixed Chart with Cylinder base Overlaid Chart & Segment line**
#### **Mixed Chart with Plain base Overlaid Chart & Segment line**
#### **Mixed Chart with Gradient1 base Overlaid Chart & Segment line**
#### **Mixed Chart with Gradient2 base Overlaid Chart & Segment line**
#### **Mixed Chart with Gradient3 base Overlaid Chart & Segment line**
### **100% Chart & Segment Line**
#### **Mixed Chart with Rectangle base 100% Chart & Segment line**
#### **Mixed Chart with Cylinder base 100% Chart & Segment line**
#### **Mixed Chart with Plain base 100% Chart & Segment line**
#### **Mixed Chart with Gradient1 base 100% Chart & Segment line**
#### **Mixed Chart with Gradient2 base 100% Chart & Segment line**
#### **Mixed Chart with Gradient3 base 100% Chart & Segment line**
## Sample Data
Download the given sample data and map it as mentioned below to plot your ***Mixed*** chart.
Use the ***Year*** column as ***Category*** field, and ***other*** columns as ***Series** to plot data.*
{% file src="/files/uxccMBcAPczGROaVVIQx" %}
---
# Agent Instructions: Querying This Documentation
If you need additional information that is not directly available in this page, you can query the documentation dynamically by asking a question.
Perform an HTTP GET request on the current page URL with the `ask` query parameter:
```
GET https://docs.bdb.ai/governed-dashboards-5/charts-gallery/charts/mixed-chart.md?ask=
```
The question should be specific, self-contained, and written in natural language.
The response will contain a direct answer to the question and relevant excerpts and sources from the documentation.
Use this mechanism when the answer is not explicitly present in the current page, you need clarification or additional context, or you want to retrieve related documentation sections.