# Data Label

{% hint style="success" %}
*Check out the walk-through given below on how to configure Data Label in the charting components in the Designer.*
{% endhint %}

<figure><img src="https://859511478-files.gitbook.io/~/files/v0/b/gitbook-x-prod.appspot.com/o/spaces%2FGDmsjfjJBNqow7Fo97cO%2Fuploads%2FBmVEYToaBkrP8fKpRIf6%2FData%20label%20for%20charts.gif?alt=media&#x26;token=6c312c54-064b-40d4-b0ef-9623ed355515" alt=""><figcaption></figcaption></figure>

* Drag and drop a chart component (as Column chart has been displayed in the given image).
* Associate category and series fields to the chart.

<figure><img src="https://859511478-files.gitbook.io/~/files/v0/b/gitbook-x-prod.appspot.com/o/spaces%2FGDmsjfjJBNqow7Fo97cO%2Fuploads%2FdNYvhJexMn93RsVMnaLo%2Fimage.png?alt=media&#x26;token=35f11f6f-ce5e-4696-8cc3-e9bd6c145d73" alt=""><figcaption></figcaption></figure>

* Select a field from the ***Series*** section.
* Navigate to the ***Properties*** of the selected series field.
* Select the ***Data label*** icon.

![](https://859511478-files.gitbook.io/~/files/v0/b/gitbook-x-prod.appspot.com/o/spaces%2FGDmsjfjJBNqow7Fo97cO%2Fuploads%2F1k7toXdS9NQzVH9BRc3F%2Fimage.png?alt=media\&token=61b2ee84-9912-47c8-95fe-79de8f530178)

* Enable the **Show Data** label from the ***Data Label Properties*** dialog box.
* Click the ***Save*** option.

&#x20;     ![](https://content.gitbook.com/content/nyOeUTaPuBluyvesHVm9/blobs/0t0k4oLHvEF92KshzrNZ/image.png)​

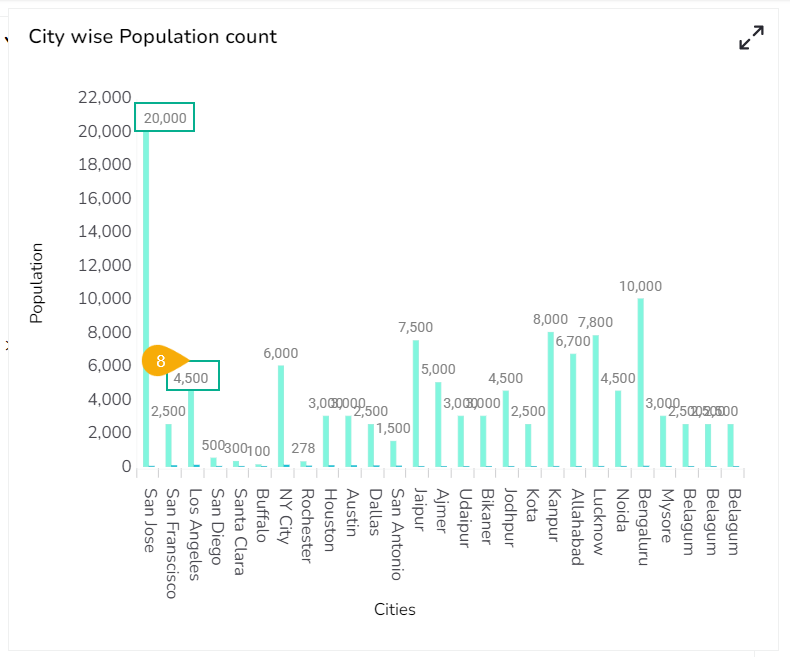
* The configured ***Data Label*** properties will be displayed.

<figure><img src="https://content.gitbook.com/content/nyOeUTaPuBluyvesHVm9/blobs/ugMt4FQ6ECtqAbuVDOec/image.png" alt=""><figcaption><p>The Data Labels get displayed </p></figcaption></figure>

### Hiding Data Label

The user can enable the ***Hide Data Label*** option from the ***Dataset Properties.***

* Access the Data Label properties fields.
* Enable the ***Hide Data Label*** field.
* Provide a specific value for which the Data Label should be hidden.
* Click the ***Save*** option.

&#x20;      ![](https://content.gitbook.com/content/nyOeUTaPuBluyvesHVm9/blobs/2fAmFK6v4a2MDxszxRbe/image.png)

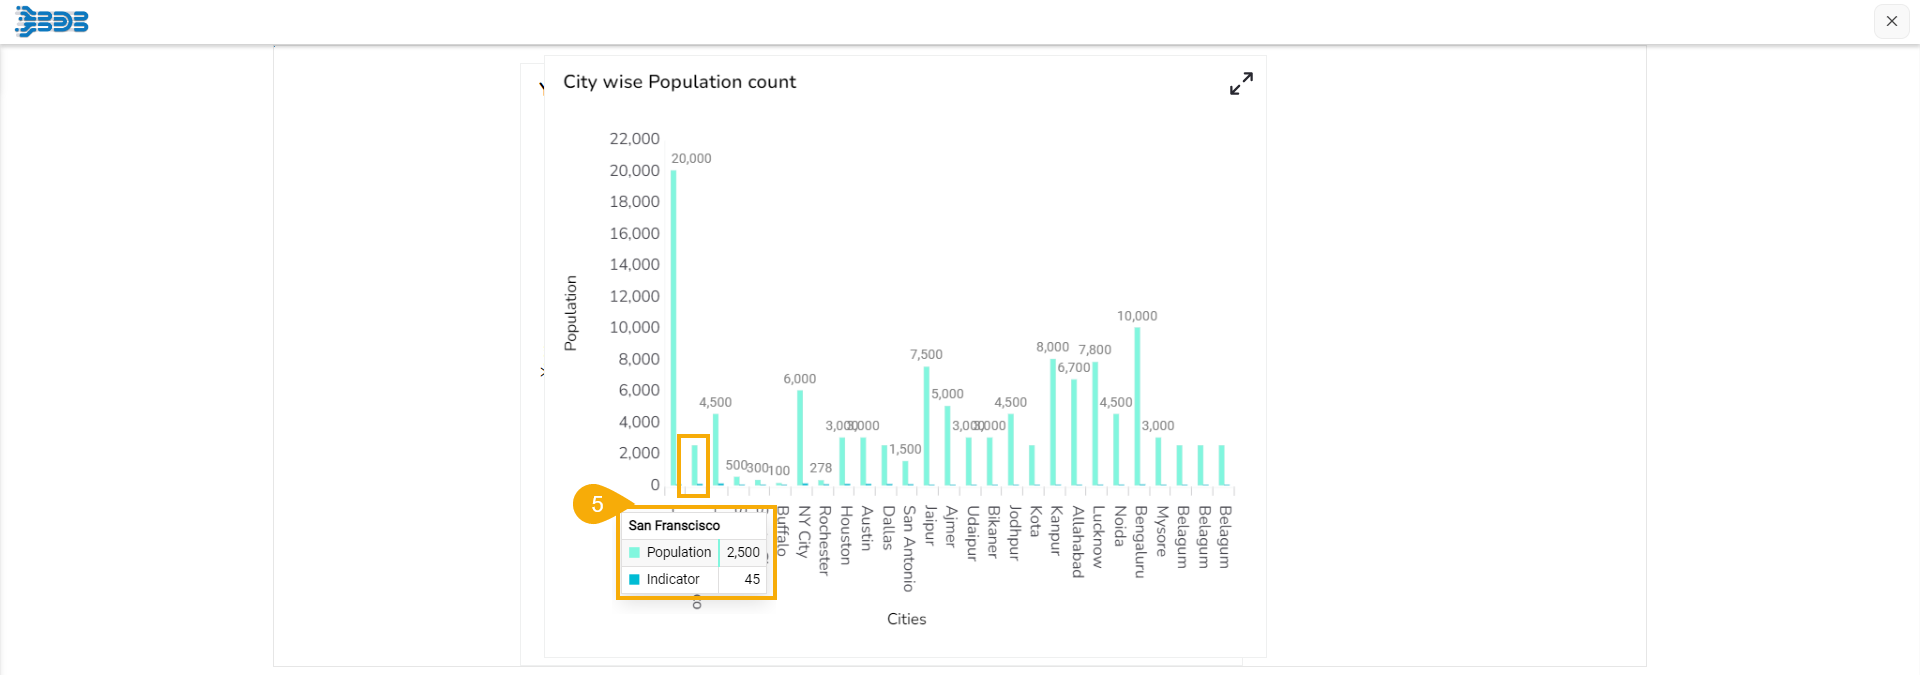
* The Data Label gets hidden for the selected value in the chart preview.&#x20;
  * E.g., No Data Label appears for the column displaying 2500 value as displayed in the given image.      &#x20;

<figure><img src="https://content.gitbook.com/content/nyOeUTaPuBluyvesHVm9/blobs/uHKKD05oLsmteHSsPz0D/image.png" alt=""><figcaption><p>Hiding Data Label</p></figcaption></figure>

<figure><img src="https://content.gitbook.com/content/nyOeUTaPuBluyvesHVm9/blobs/lEsorqD9QjtKQJPa8Ffp/Chart%20-%20Hide%20Data%20Label%20option.gif" alt=""><figcaption><p><em>Hiding Data Label in a Bar chart</em> </p></figcaption></figure>

{% hint style="info" %}
*<mark style="color:green;">Please Note:</mark> The **Hide Data Label**  field has been provided to hide the data label when the values are not needed to be shown (i.e., as the value 2 is hidden in the given walk-through).*
{% endhint %}
