# Custom Charts
* The custom component in the designer will enable the user to add any third-party visual components to the dashboard. Which consumes data from all the available designer connectors.
* This component enables the dashboard capability to import any custom component from any third-party library which can consume data from designer connectors and interact with other dashboard components.
* Custom components have properties to configure JS and CSS source files. Dataset can be taken from the connector and a way to set these data and fields.
* Tooltip and Drill events can be captured and implemented the same as designer charts.
## Configuration Steps
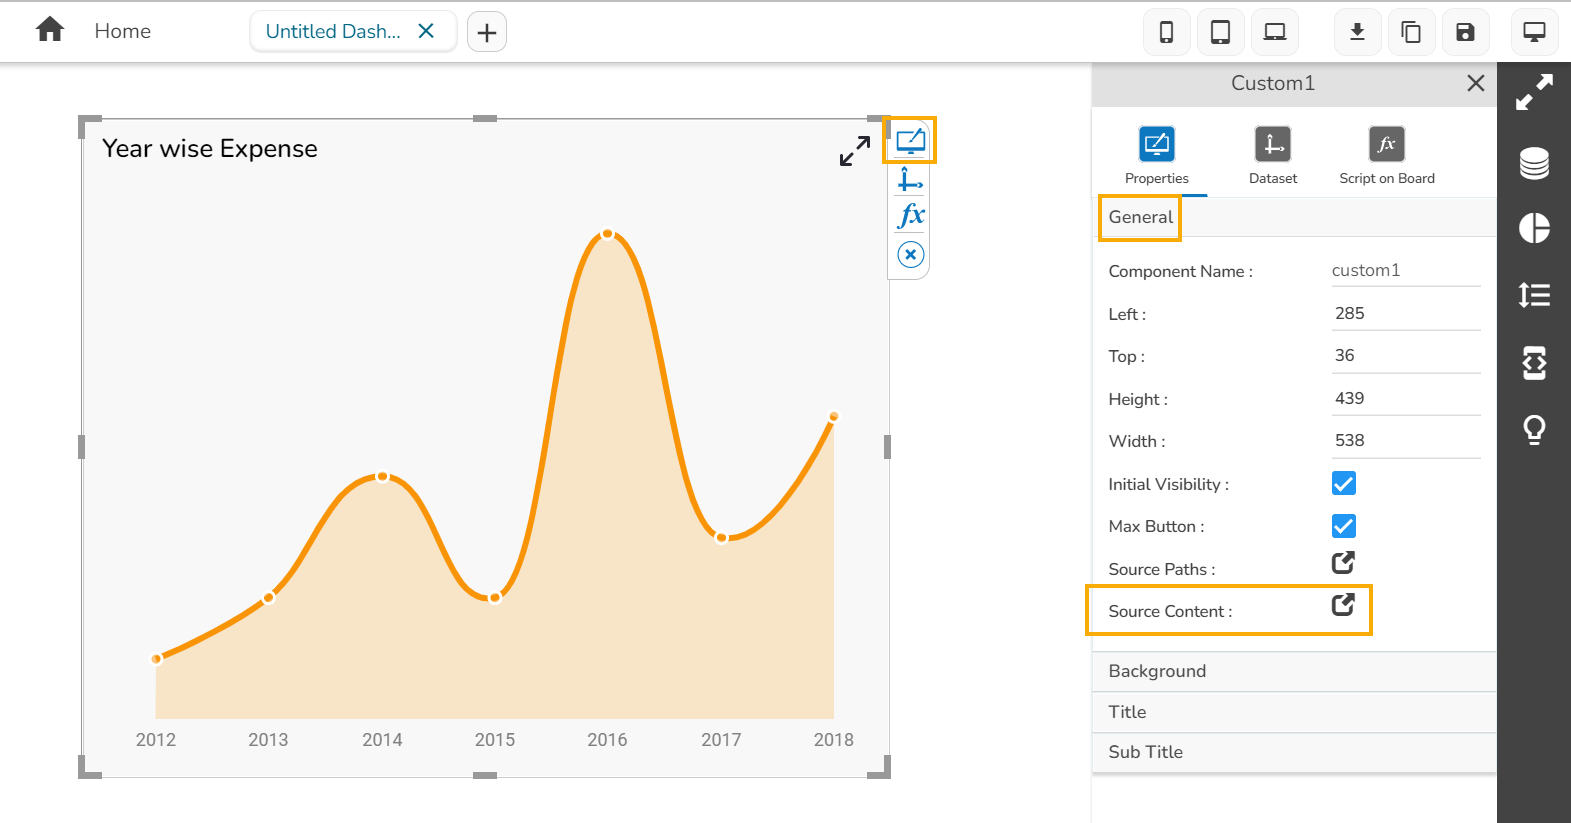
* Drag and drop a ***Custom*** chart to the designer canvas.
* Click the the ***Property*** palette icon.
* Navigate to the **General** section.
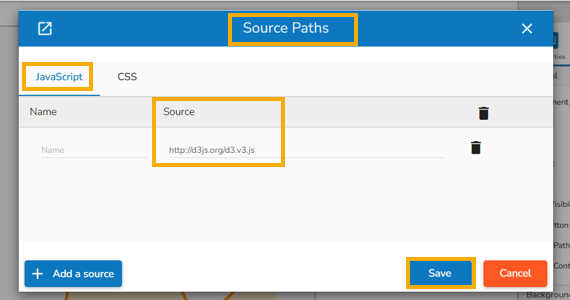
* Click on the ***Source Path*** icon.
* The Source Path and add the paths of JavaScript and CSS source files required for this chart.
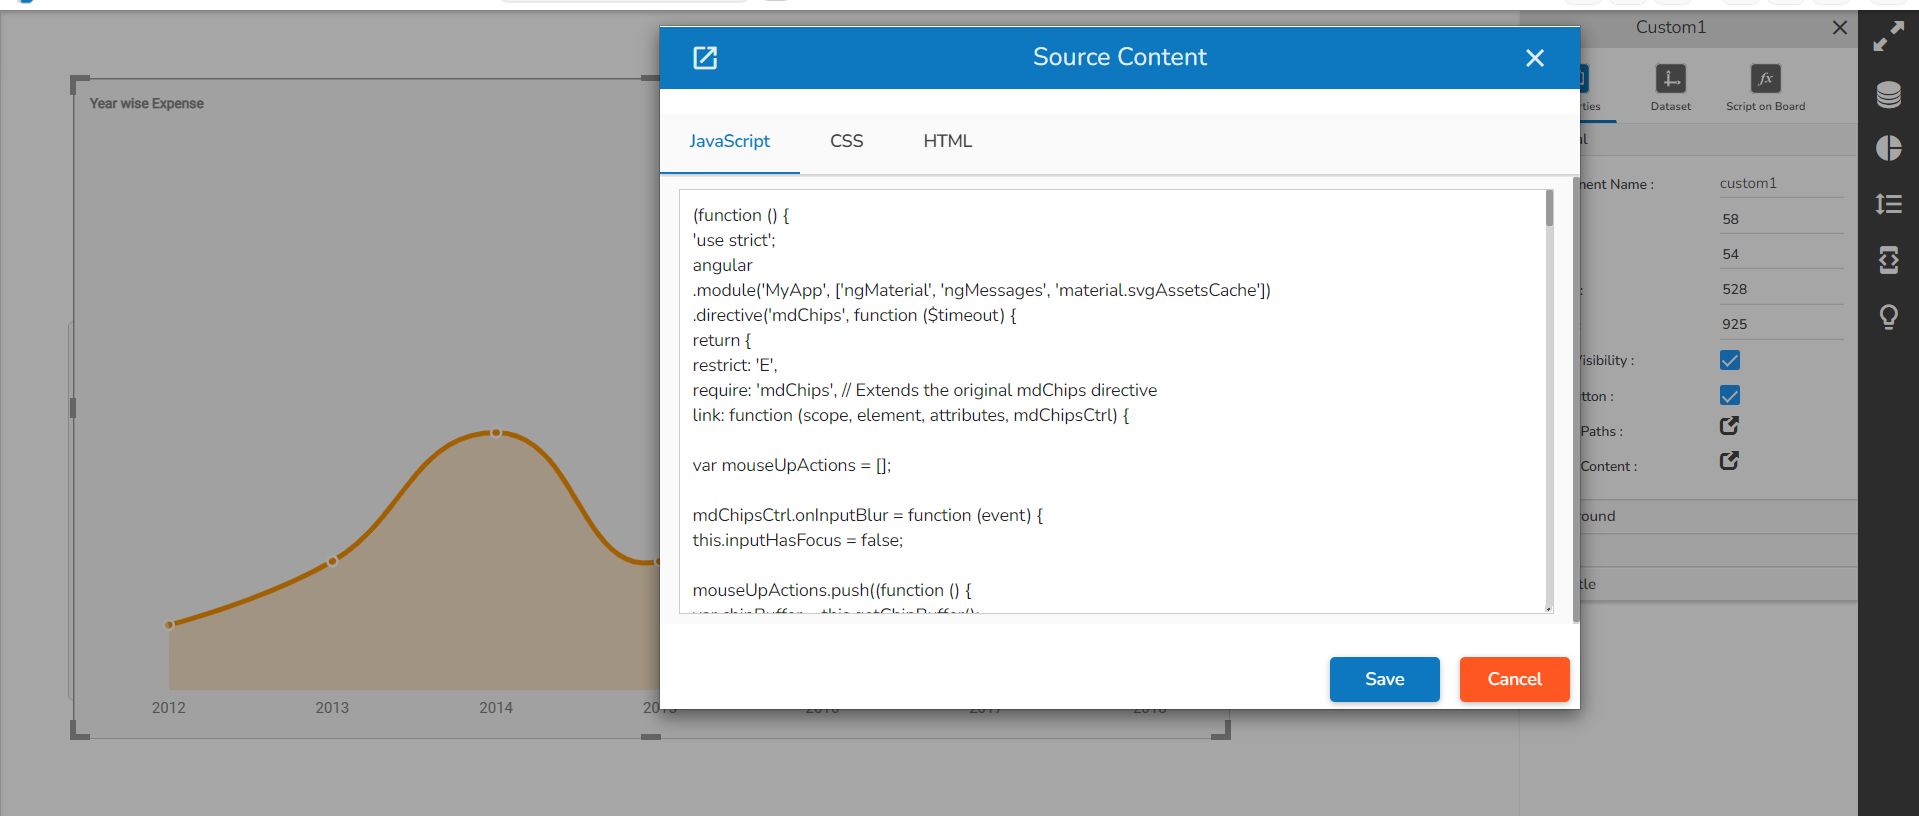
* Click on the ***Source Content*** icon from the General properties section.
* In the HTML tab, add the HTML elements where the chart will be rendered or if additional HTML elements are required.
* Click on the CSS tab and add the required styles for the formatting of the chart’s elements. Click on the JS tab, add the script configuration code required for this chart and configure the callback of the event, etc.
* To access the properties set from the property palette in the custom chart configuration, we should use the ***bizvizchart*** as a reference.
* The ***bizvizchart*** gets treated as a reference to the ***Custom Chart*** object which is part of the dashboard.
* Using this reference, we can access the data and other properties in the chart configuration.
* ***Examples***: bizvizchart.getData(), bizvizchart.getFields(), bizvizchart.getWidth(), bizvizchart.getHeight() are the methods.
* The ***bizvizchart.chartJson*** give them access to the entire configuration JSON done from the property palette.