# Drill Through
{% hint style="success" %}
*Check out the walk-through given below on how to configure the Drill Through functionality among the multiple charting components in the Designer.*
{% endhint %}
## Creating Data Source Connections for Charts
* Click on the ***Data source*** icon provided on the right side of the canvas, and view the data connectivity options (ex: CSV, Excel, etc.,) for a dashboard.
* Click on the icon to create a new connection. E.g., Excel Data Connection.
Please Note: *Since we wish to perform drill-down analysis where we can select a piece of the Pie chart and the column chart will change to reflect that, we need to create two data sources (i.e. Bar and Column)*
**Fill in the following details:**
1. **Name:** Name the connection
2. **Browse:** Navigate to the Excel file that you wish to use as a data source.
3. **Sheet Name**: Select the sheet you wish to use from the Excel file you have selected.
4. **Load at Start:** Enabling this option refreshes the data source before opening the charts.
* Click on the ***Charts*** icon provided on the right side of the canvas. A list of available components will be displayed. Drag and drop the ***Column chart*** component onto the canvas.
* Connect the Column chart component to an existing data connection:
* Click on the Dataset at appears next to the chart.
* Select a connection from the ***Available Connections*** dropdown menu (ex: Column)
* Drag and drop the fields to their respective series and categories.
* Connect the Bar chart to an existing data connection:
* Click on the Dataset at appears next to the chart.
* Select a connection from the ***Available Connections*** dropdown (E.g., Bar)
* Drag and drop the fields to their respective series and categories.
## Enabling Drilldown Option
* Apply the following actions:
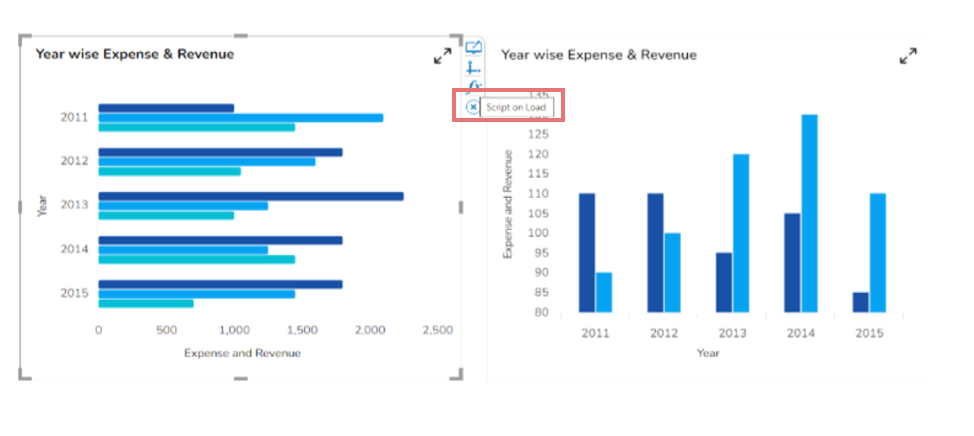
* Click on the ***Script on Load*** tab.
* Apply the ***Auto Reload*** function.
* Click on the ***Data Connectors*** icon provided on the right side of the canvas. Select the ***Column*** data source which is listed under the ***Excel*** data source. Select the ***Condition*** tab and in the ***Conditions text area***, type the field name which you wish to use to filter data.
* Select the condition from the dropdown list and enable the ***Action*** checkbox (as shown in the above image).
* Click on the ***Preview*** button to perform a drill-down analysis.