Self-Service Visualization
  • What is a Report?
  • Creating a new Report
    • Accessing the Report Module
    • Create New Report
      • Creating a new Report with an Existing Data Store
        • Creating and Updating Instance
      • Creating a new Report by Uploading a File
        • Creating a new Report by Uploading a CSV File
        • Creating a new Report by Uploading an Excel File
      • Creating a new Report with Data Preparation
        • Create a Report with Data Preparation - Inside the Report UI
        • Create a Report with Data Preparation- Partly from the Data Center
    • Designing a View
    • Saving Multiple Views
  • Design Canvas
    • Dimension Profiling
    • View Measure Summary
    • Customize Category Color
    • Series Properties
    • Create Calculated Field
      • Creating a Formula
        • Record Level Formula
        • Summary Level Formula
      • Creating Range
    • Order by and Limit
    • Adding a Slicer
  • Chart Gallery
    • Mixed chart
    • Area chart
    • Bar chart
    • Bubble chart
    • Column Stack chart
    • Line chart
    • Pie chart
    • Scattered Plot chart
    • TreeMap chart
    • Circumplex chart
    • Pareto chart
    • Semi Gauge
    • KPI Tile
    • KPI Tile: Comparative Tile
    • KPI Tile: Sparkline
    • Map
    • Data Grid
    • Metric Summary
    • Dissolution/Decomposition chart
    • Spider chart
    • Waterfall chart
    • Funnel chart
    • Inverted Funnel chart
    • Heat Map chart
    • Geo chart
    • Sankey chart
    • Word Cloud
    • Candlestick chart
    • Benchmark Analysis
  • Report Final Screen
    • Tab
    • Search
    • Create a New ML View
    • Shared Views
    • Live Refresh
    • Export
      • Export Properties
    • Change Theme
    • Data Store Information
    • Options Assigned to a View
      • Analyse
        • Timeline Play
        • Data Drills
          • Drill Into
          • Drill Through
      • Editing a saved View
      • Duplicate
      • Remove
  • Applying Filters
    • View Specific Filter
      • Dimension-based View Filter
      • Measure-based View Filter
      • Date-based View Filter
    • Global Filter
      • Exclude from the Global Filter
      • Saving a Global Filter
      • Custom View Filter
      • LOV Settings
  • Interactions
Powered by GitBook
On this page
Export as PDF
  1. Report Final Screen

Tab

The Tab UI helps to add more details in tabular format to a Report.

PreviousReport Final ScreenNextSearch

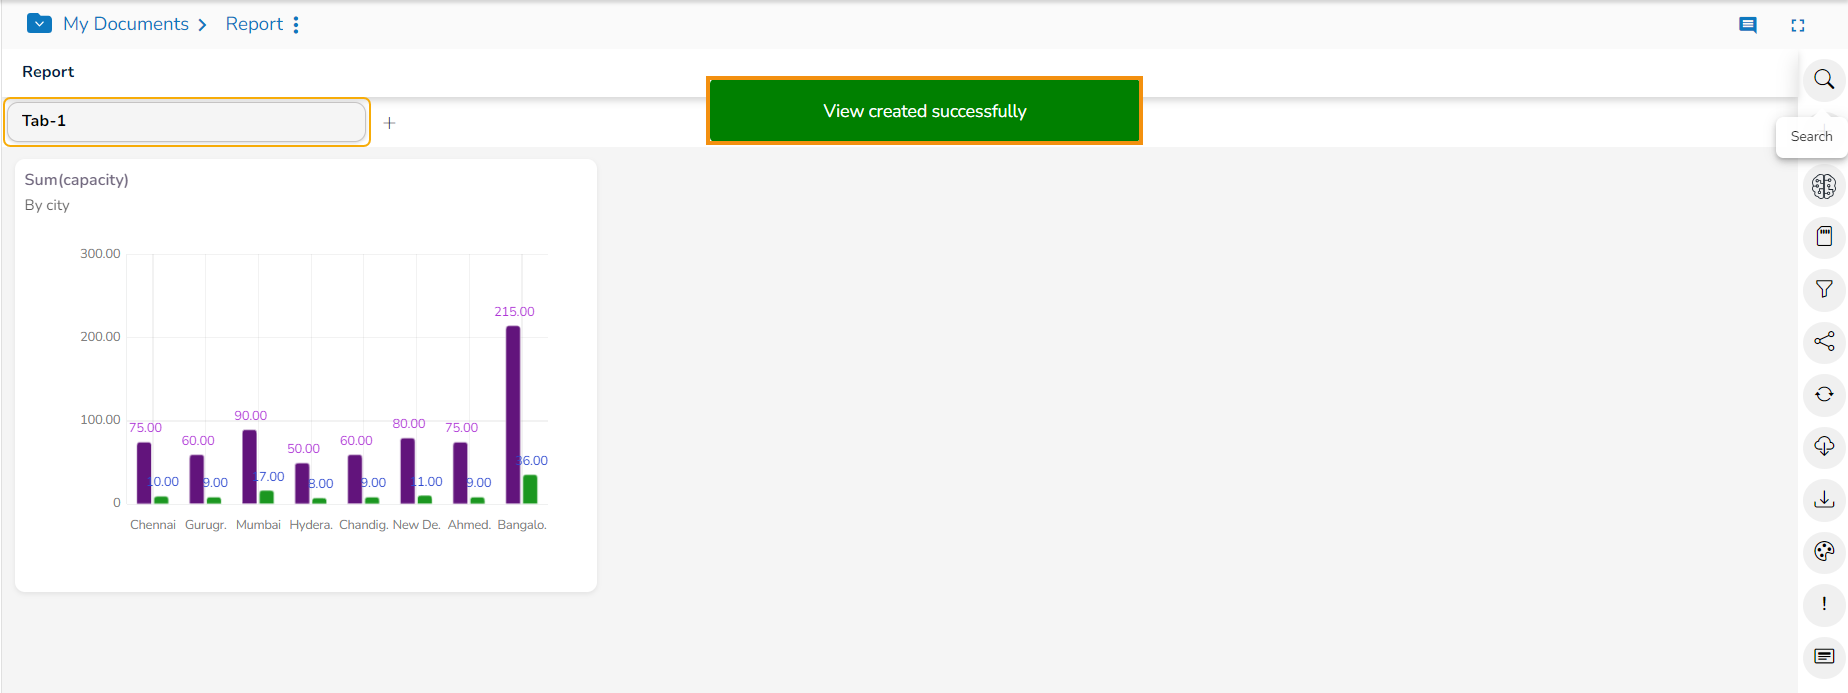
Please Note: By saving the first View to the Report final screen a Tab gets created by default. The user can create up to 5 tabs in a Report.

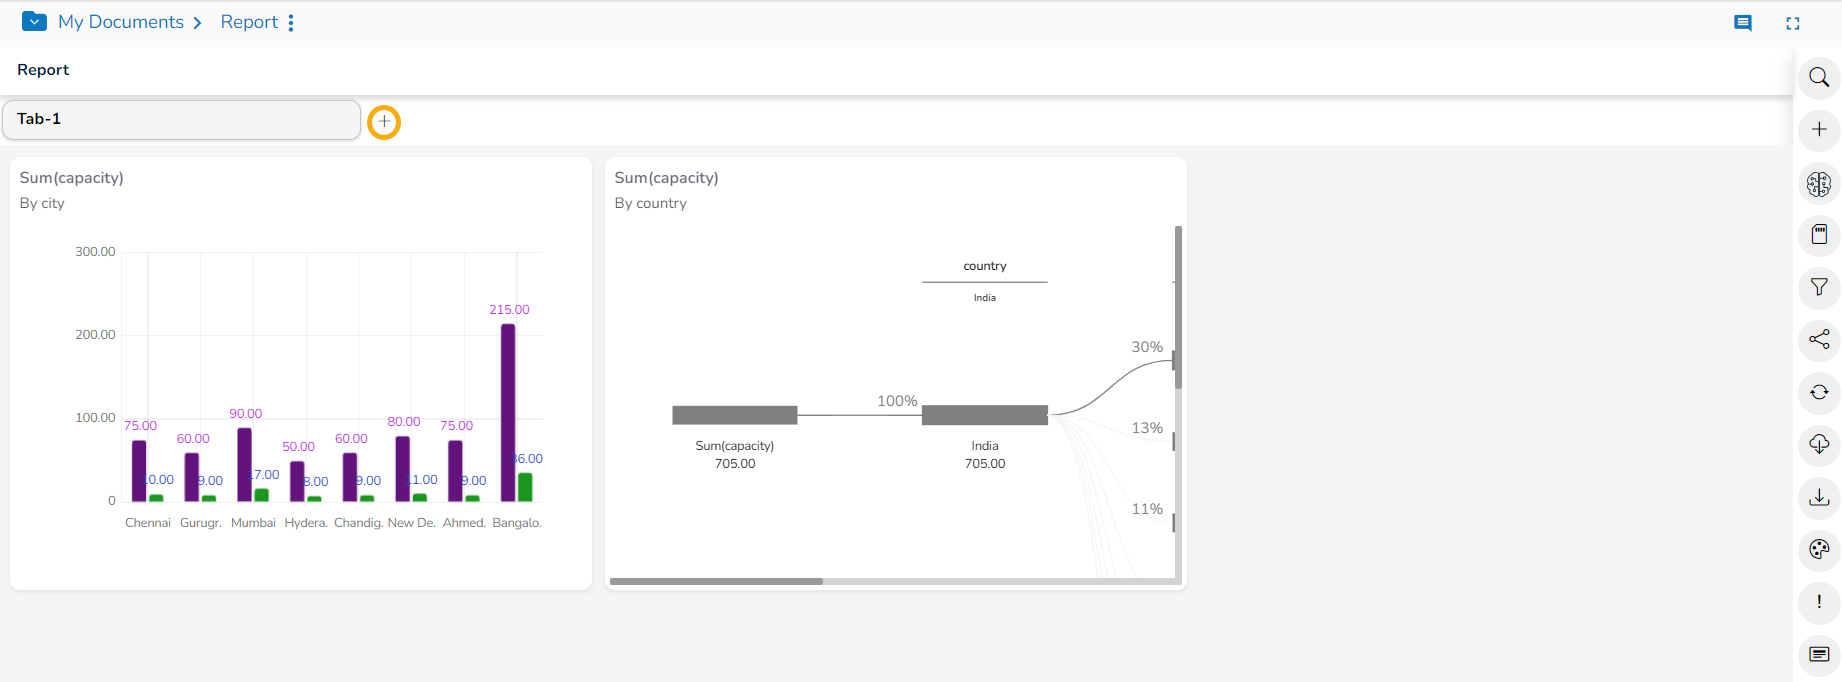
  • The first Tab gets created by default when the user creates the first View and Saves it.

  • The user can use the Create View icon.

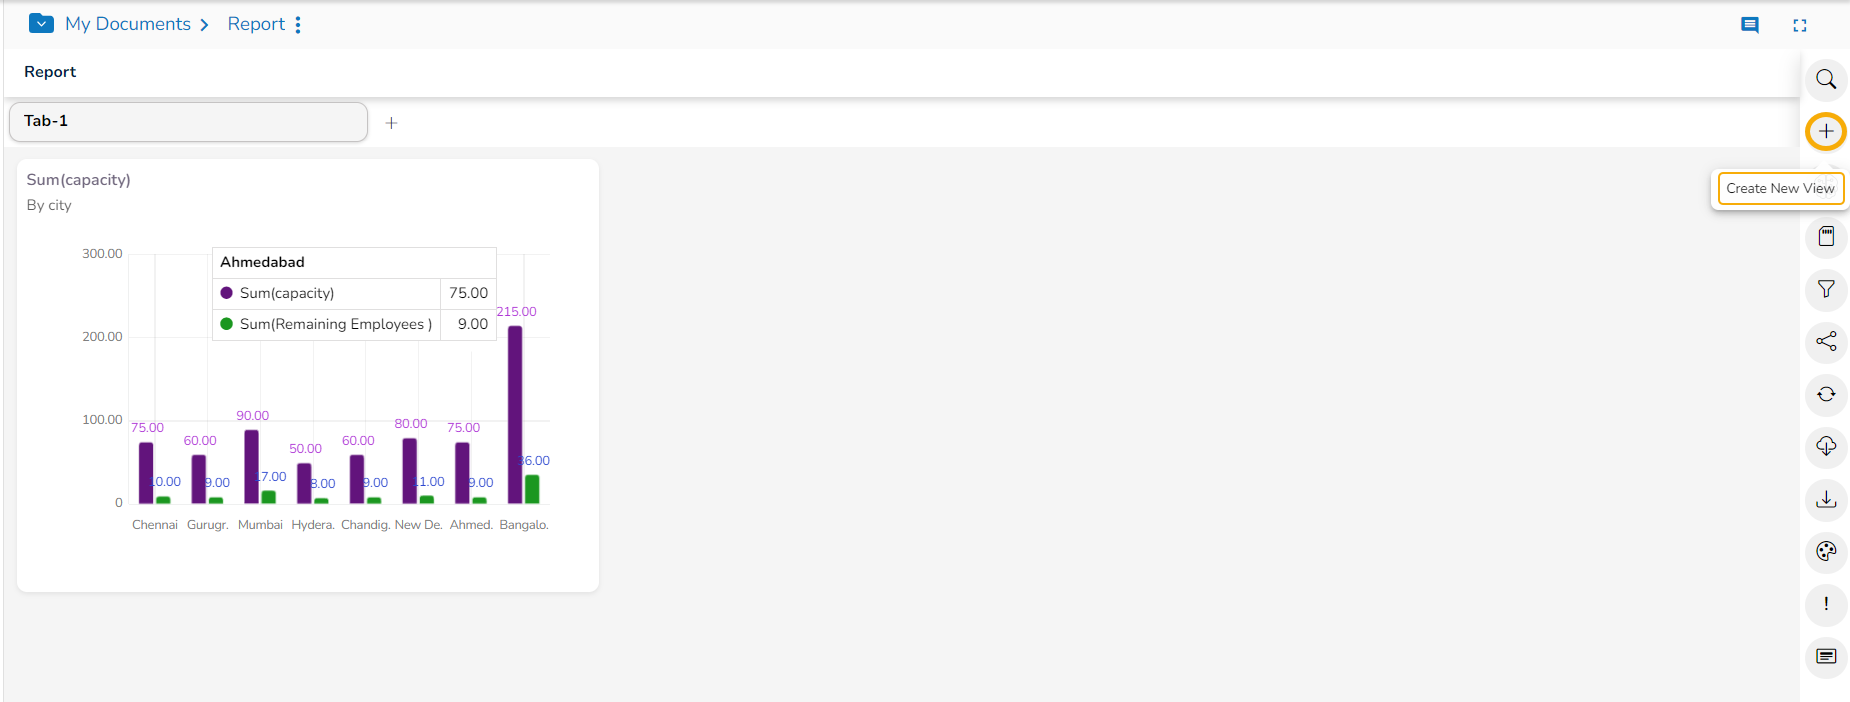
  • The user will be redirected to the Design Workspace to create another View.

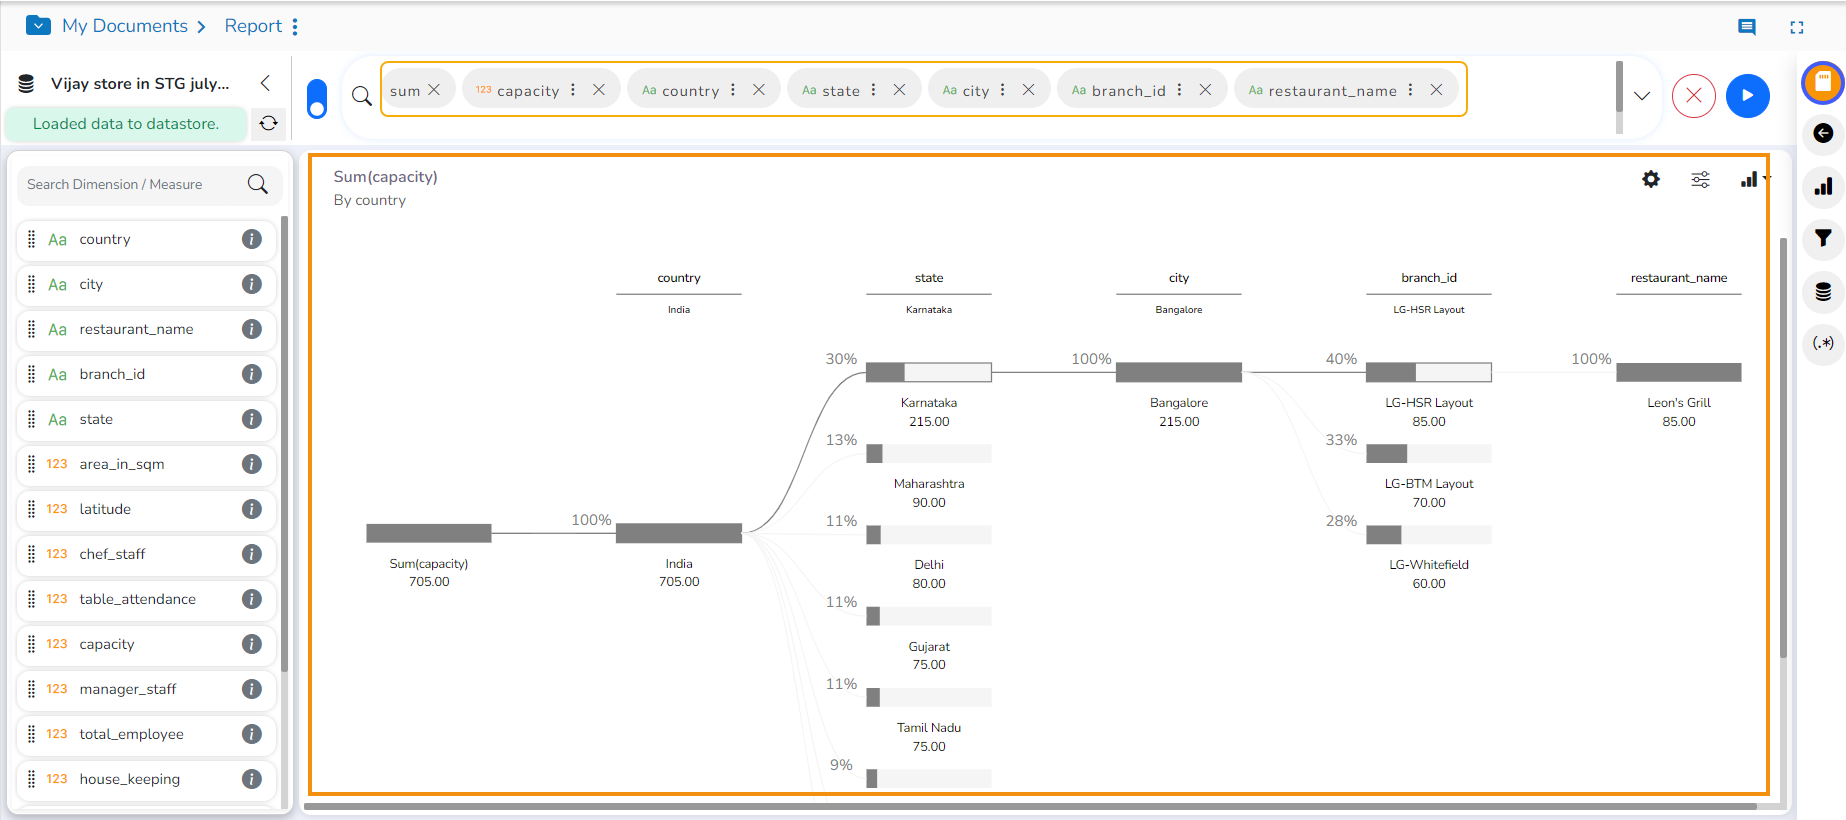
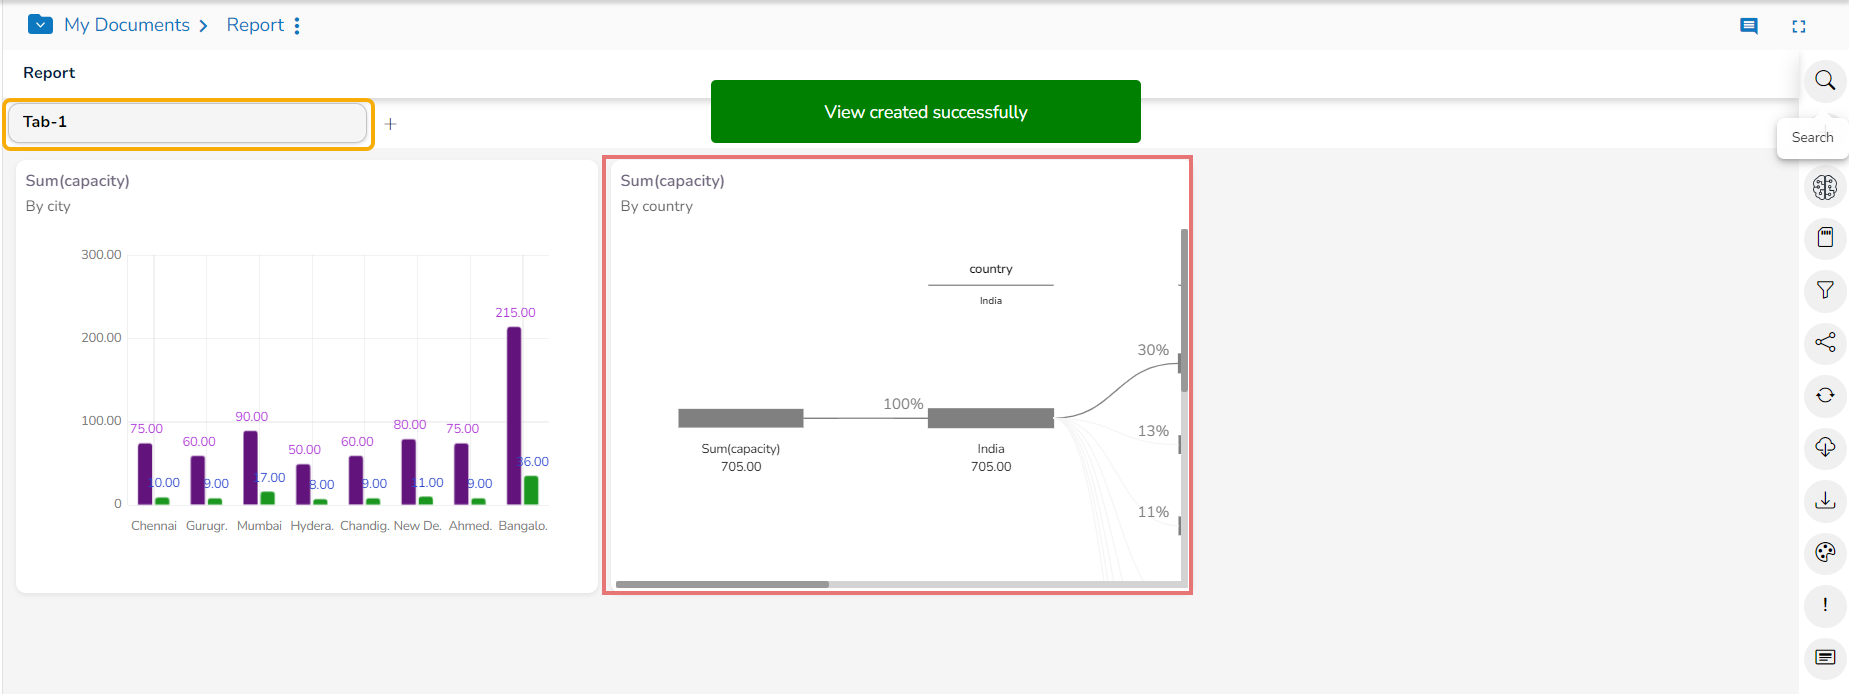
The View will be added to the Tab 1 by default.

  • Click the Add icon.

  • A new tab gets added, provide a name for the newly added tab.

  • Click the checkmark icon.

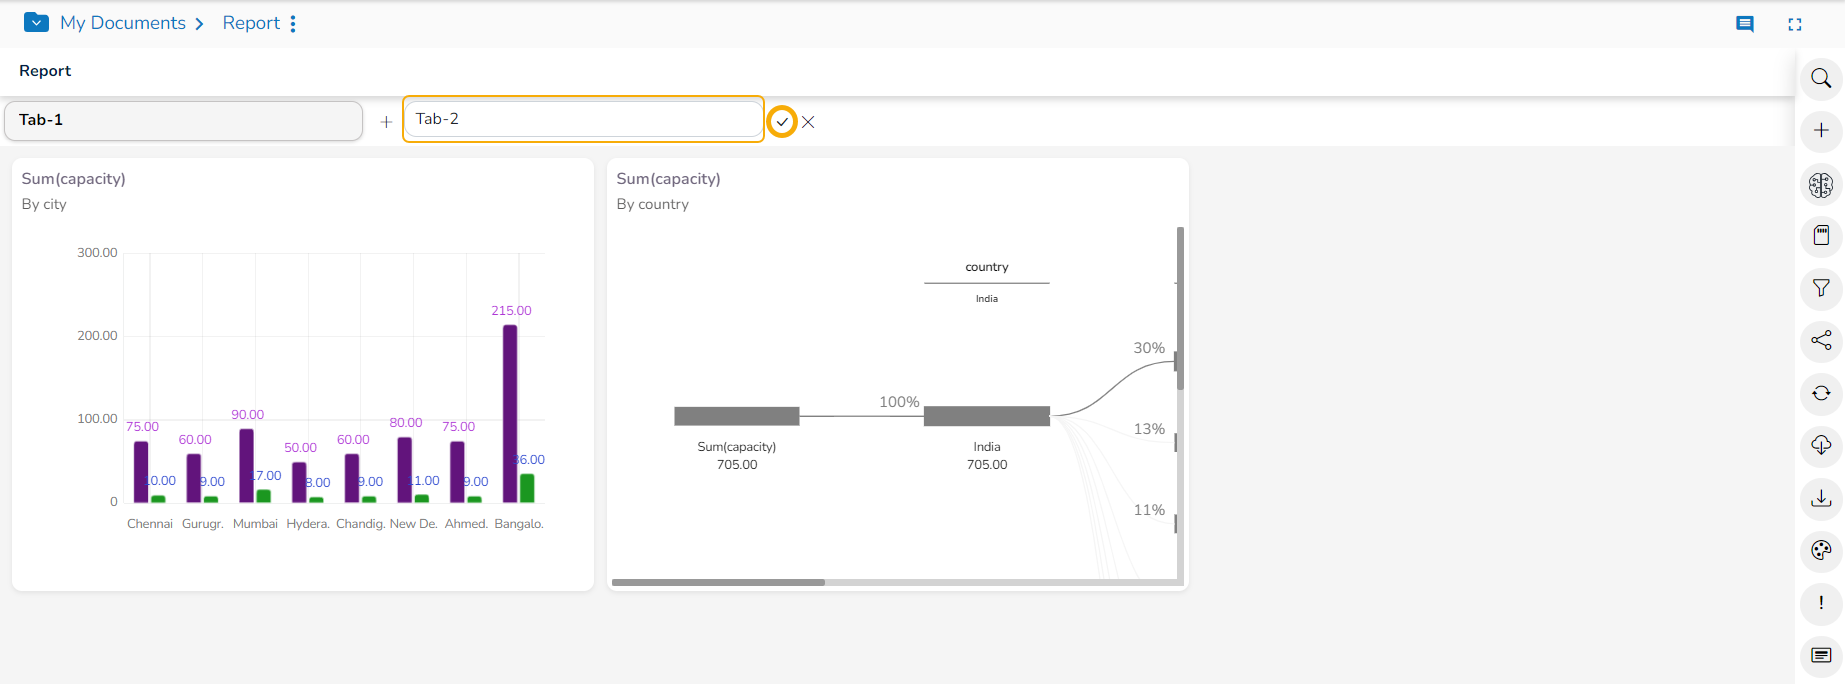
  • The Tab name gets saved.

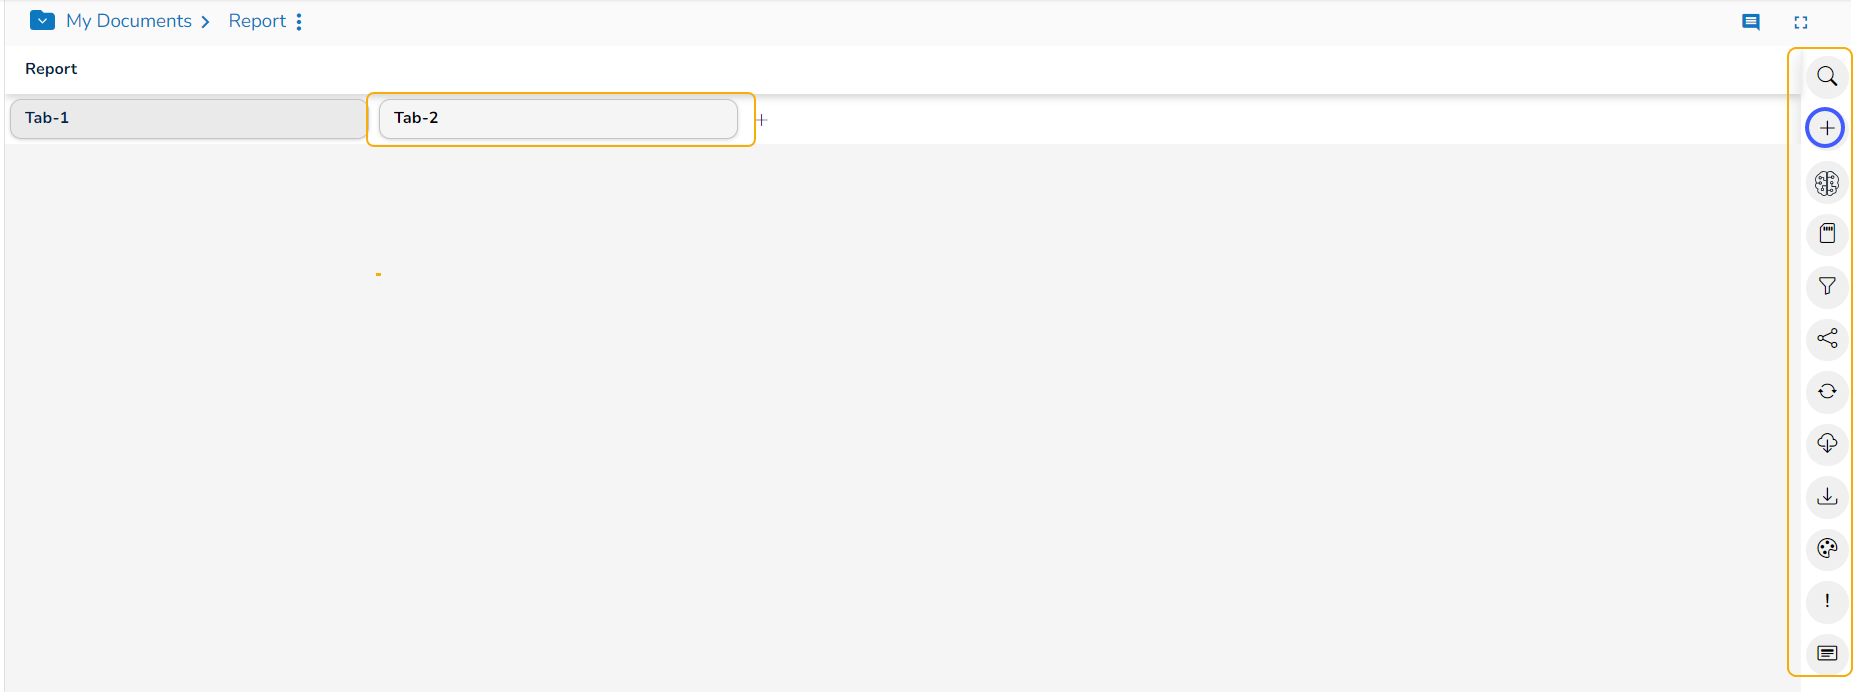
  • The user can use a click to open the second tab.

  • The second tab opens listing all the attributed options.

  • Click the Create View option to create a View for the second tab.

Please Note: The user can follow the same steps (as mentioned above for the default tab) to insert more Views to the second tab.

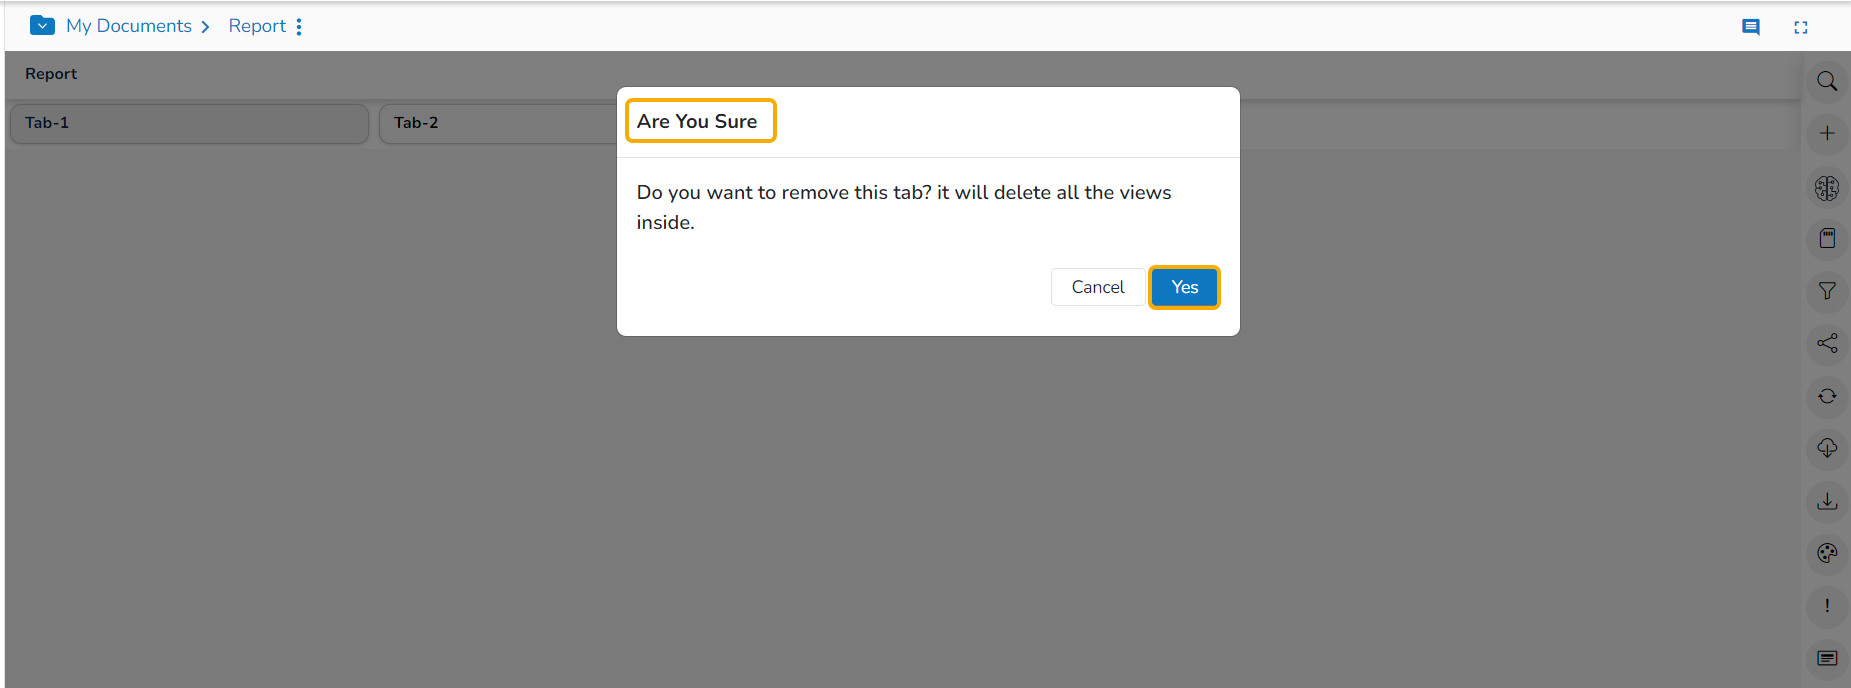
  • Click the Close icon from the tab to remove it from the Report.

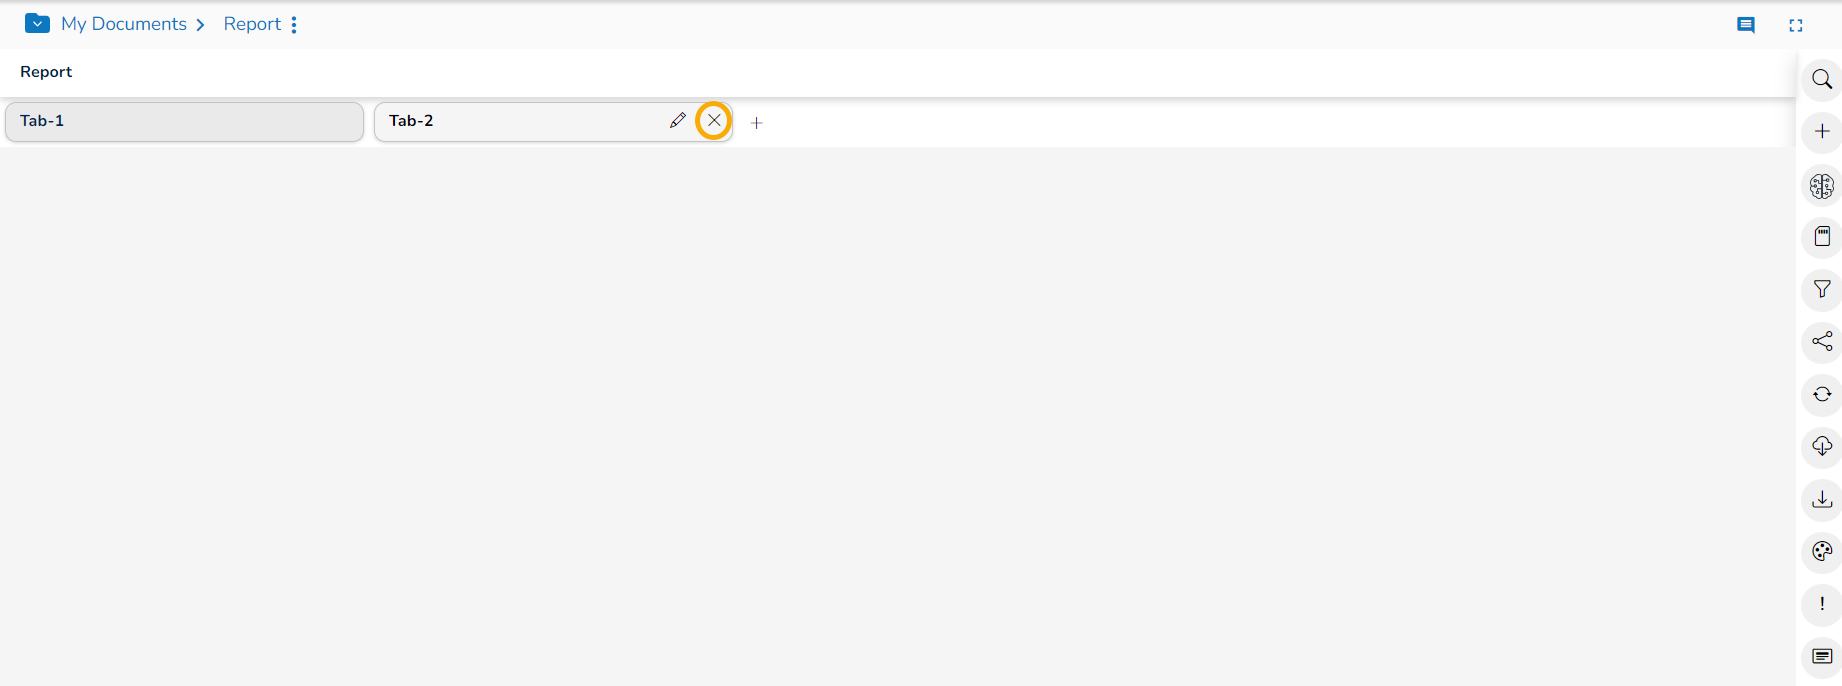
  • A dialog box opens to ensure the action.

  • Click the Yes option to remove the concerned tab.

  • The selected tab will be removed from the Report.