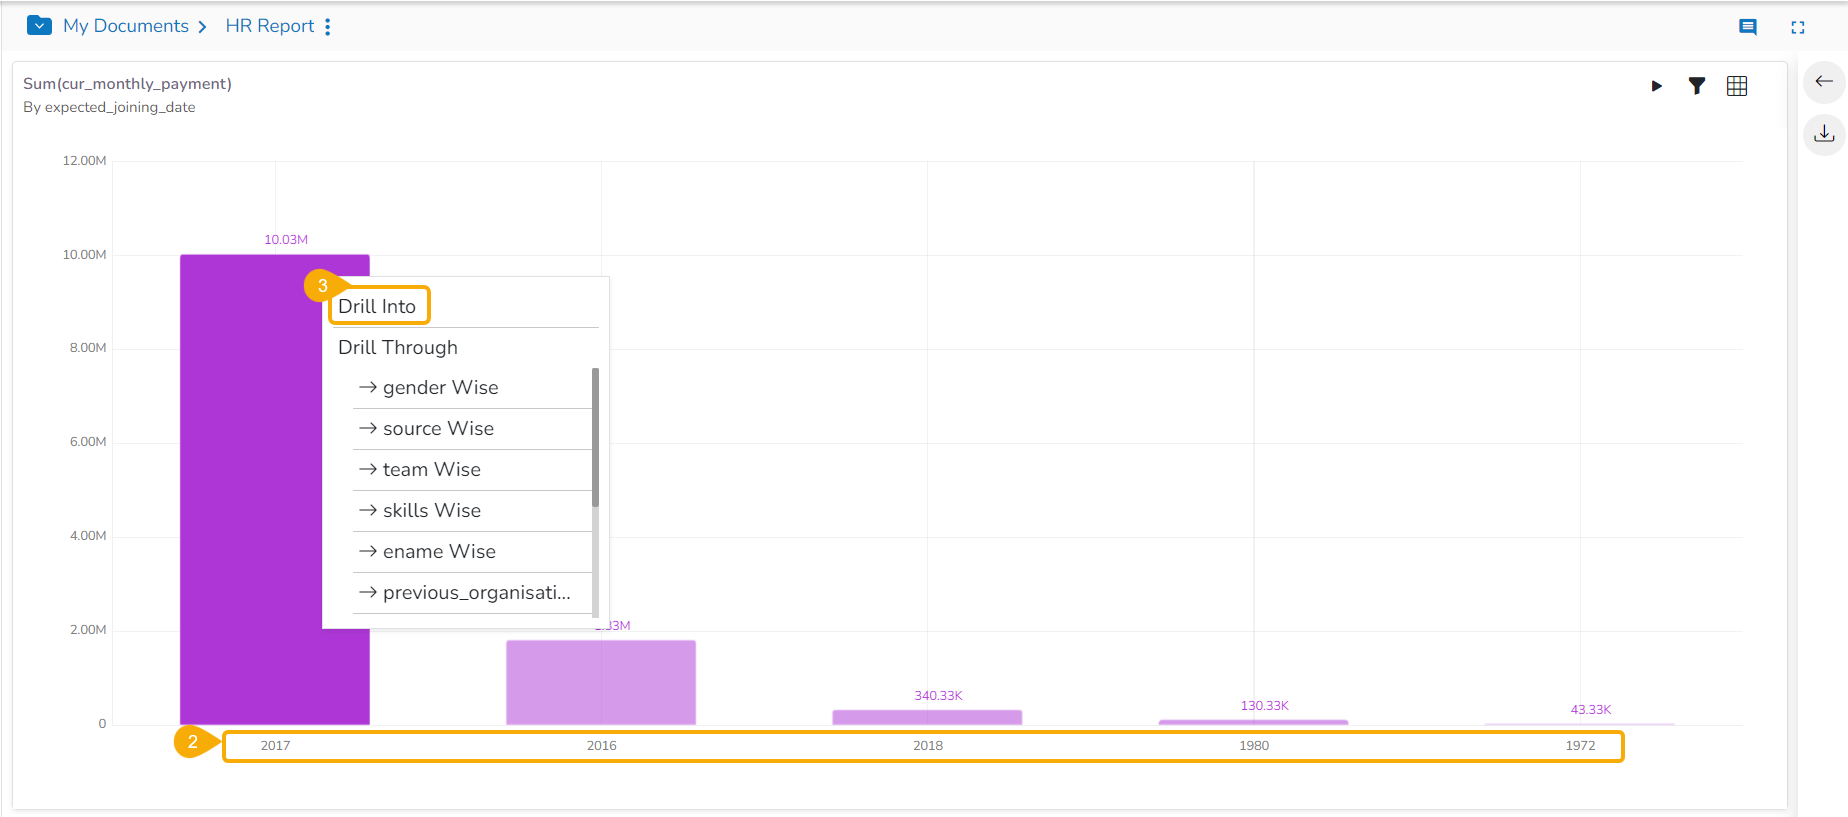
Drill Into
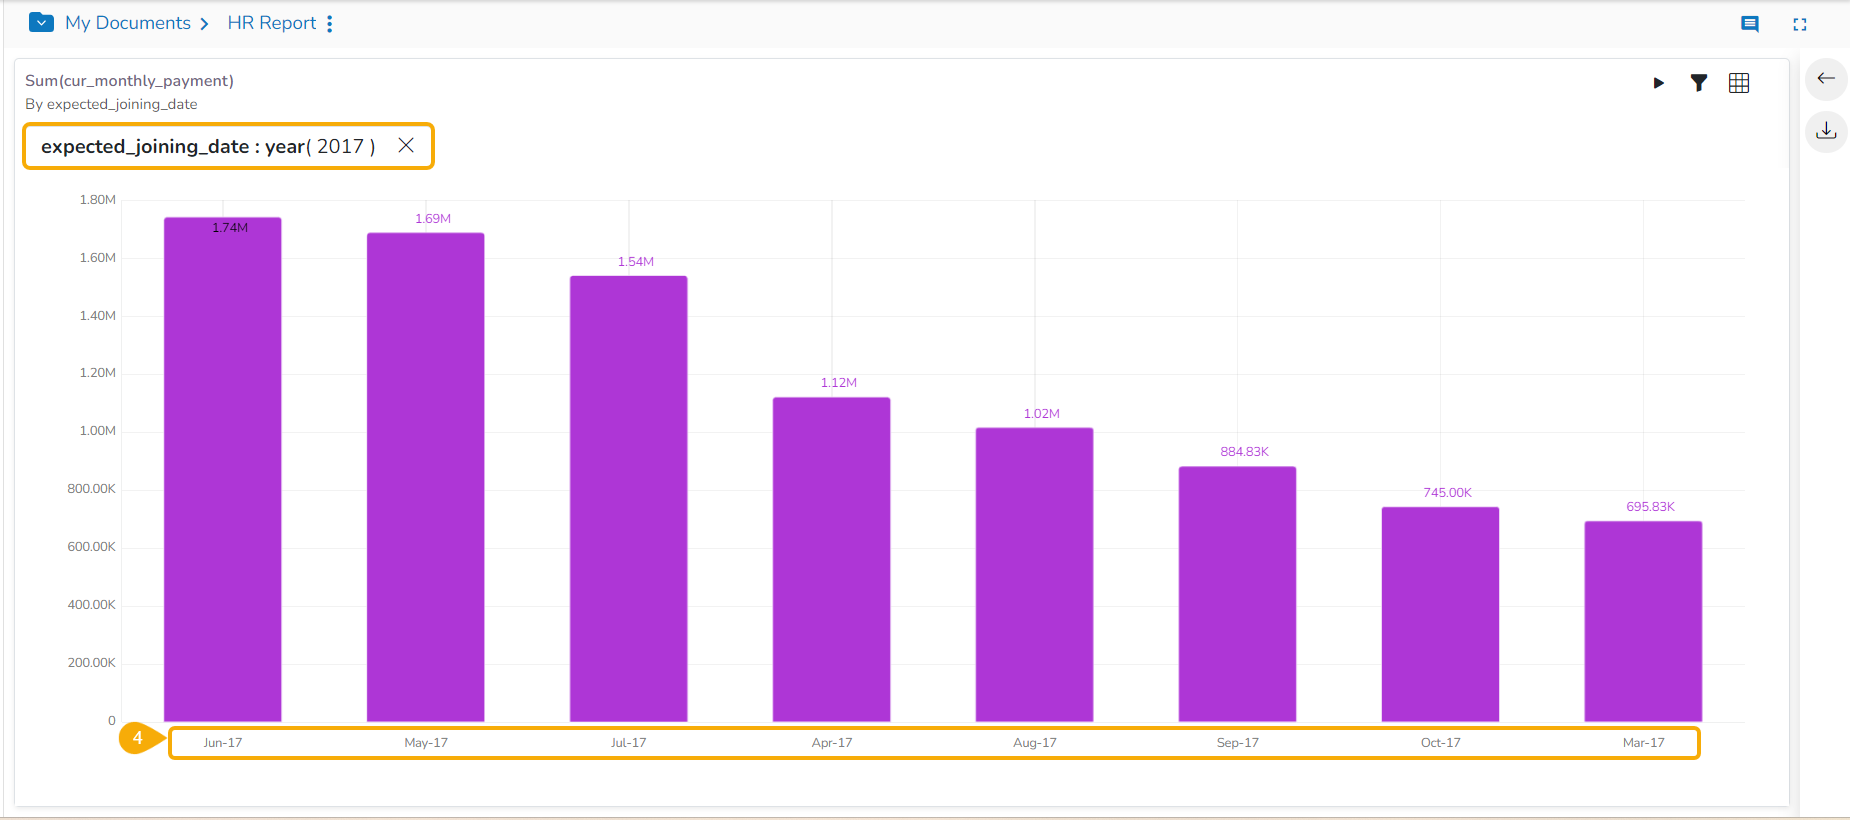
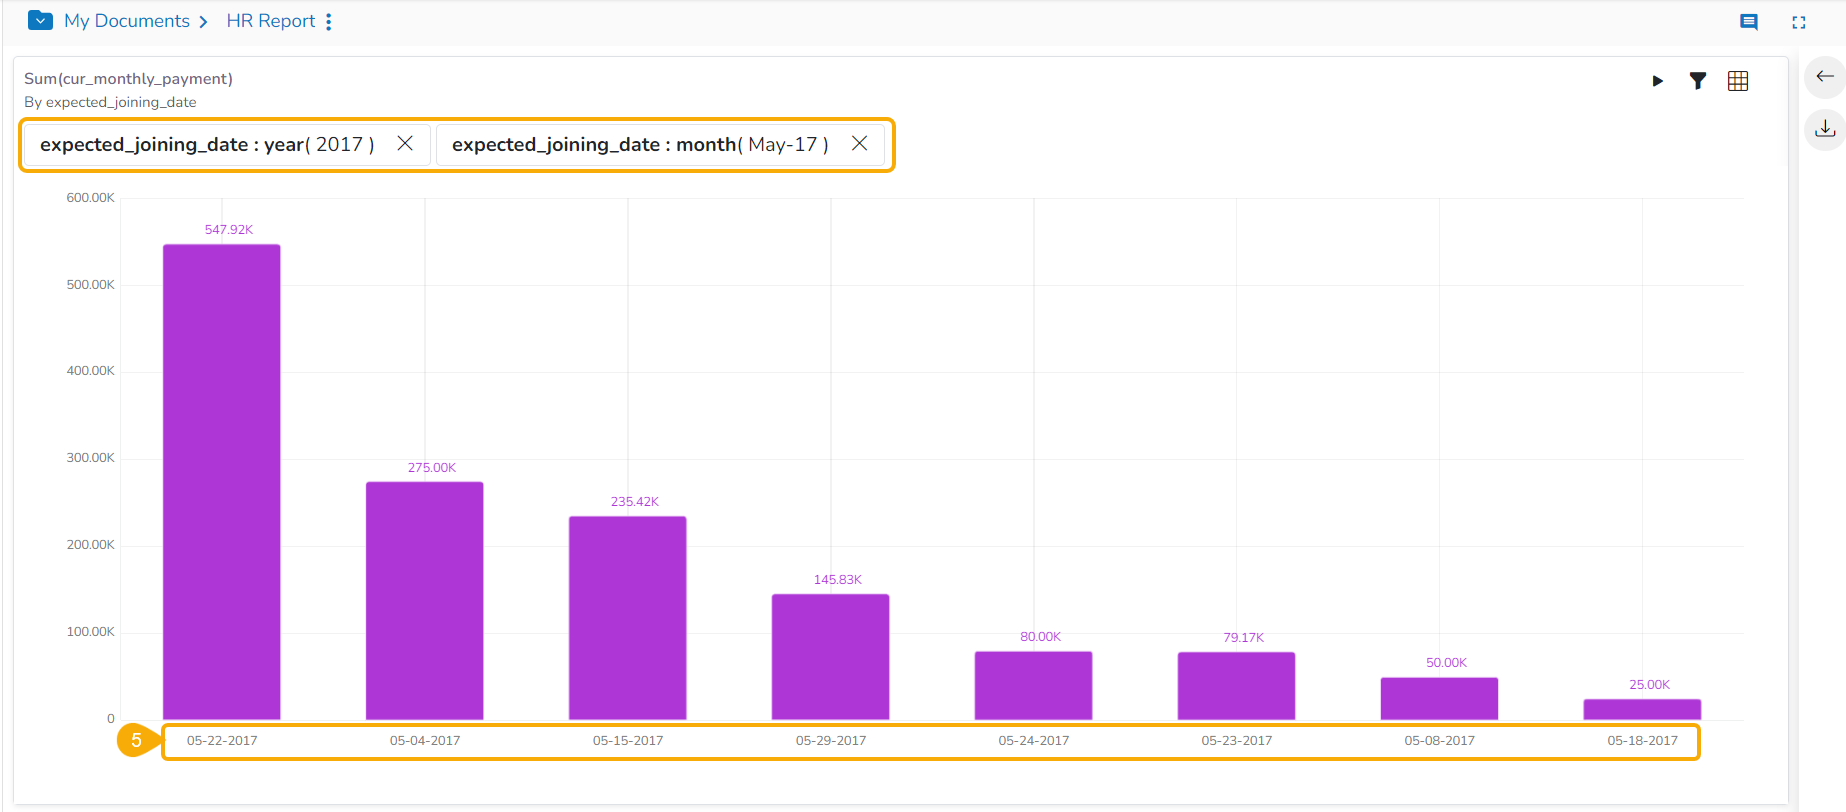
This data drill allows the user to penetrate into deeper granularity level of the time dimension.
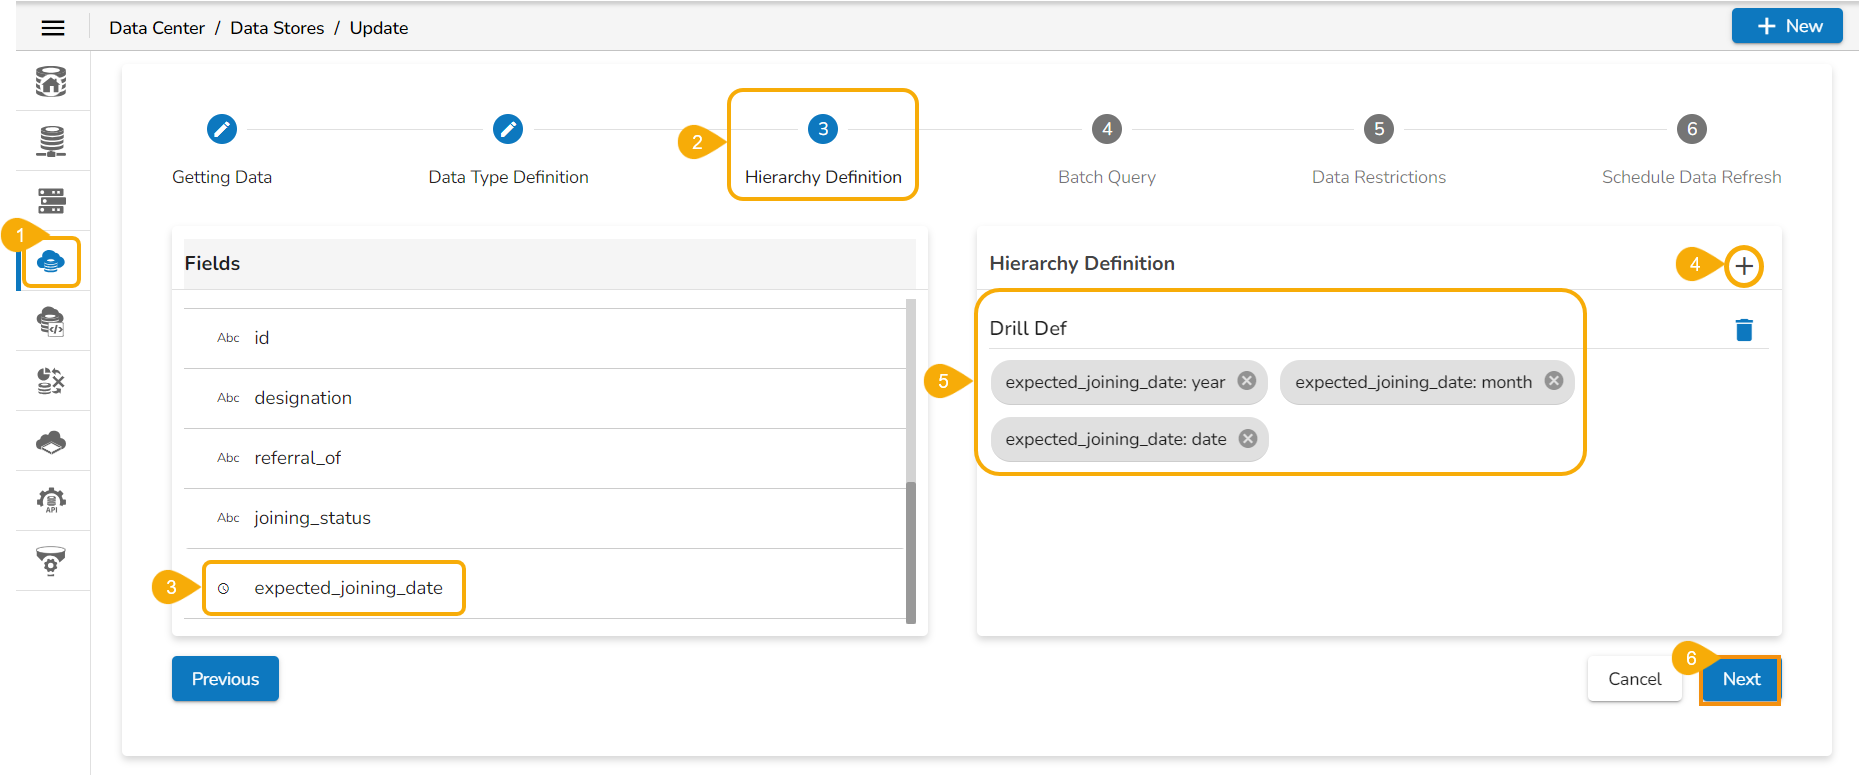
Defining the Hierarchy Drill for a Date Dimension
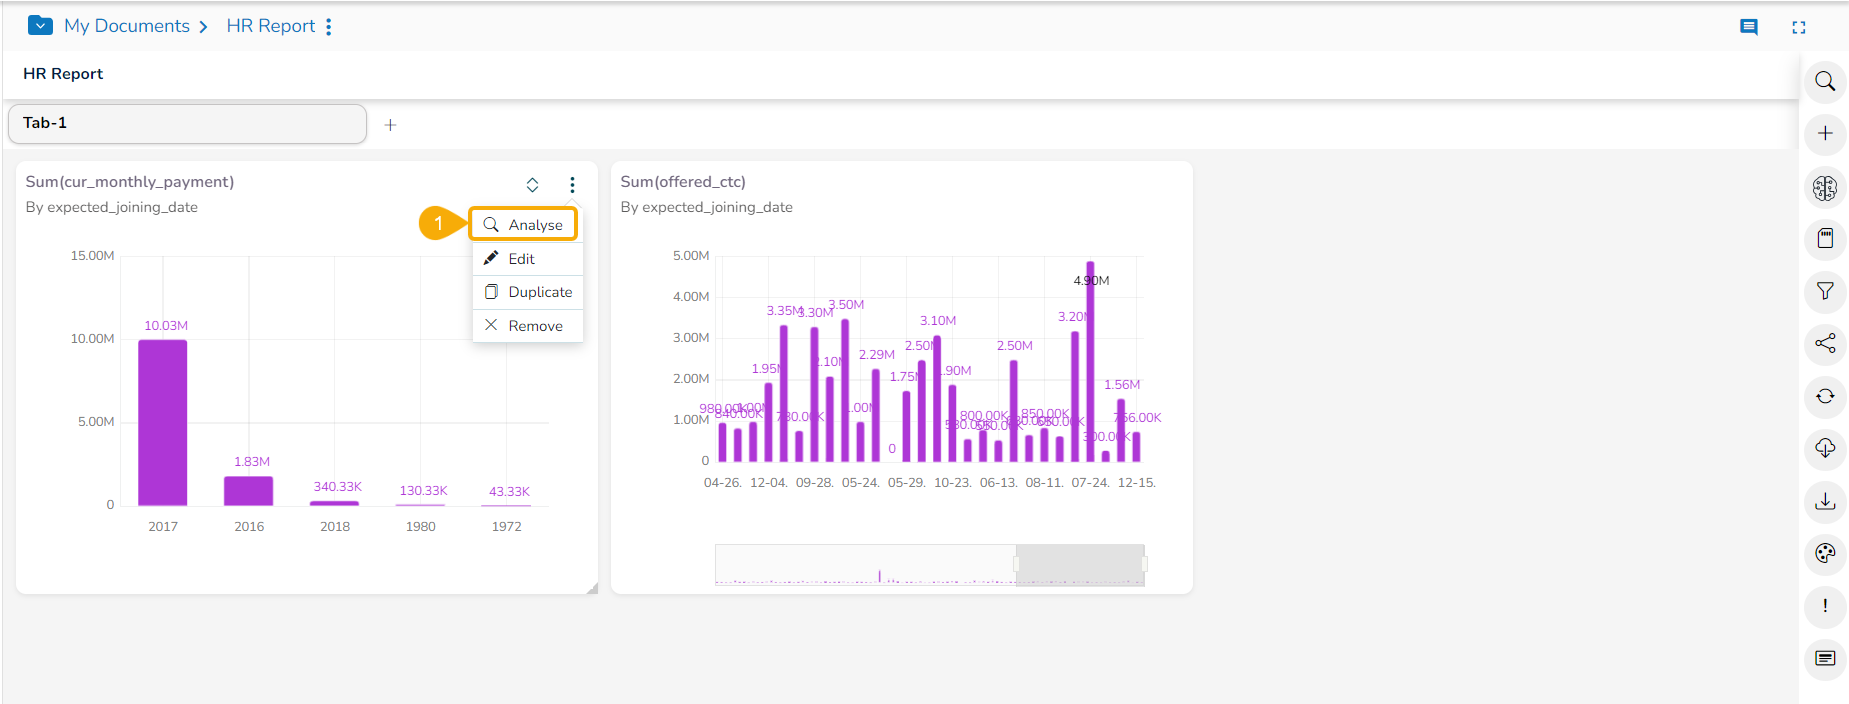
Applying Drill Into Option