Self-Service Visualization
  • What is a Report?
  • Creating a new Report
    • Accessing the Report Module
    • Create New Report
      • Creating a new Report with an Existing Data Store
        • Creating and Updating Instance
      • Creating a new Report by Uploading a File
        • Creating a new Report by Uploading a CSV File
        • Creating a new Report by Uploading an Excel File
      • Creating a new Report with Data Preparation
        • Create a Report with Data Preparation - Inside the Report UI
        • Create a Report with Data Preparation- Partly from the Data Center
    • Designing a View
    • Saving Multiple Views
  • Design Canvas
    • Dimension Profiling
    • View Measure Summary
    • Customize Category Color
    • Series Properties
    • Create Calculated Field
      • Creating a Formula
        • Record Level Formula
        • Summary Level Formula
      • Creating Range
    • Order by and Limit
    • Adding a Slicer
  • Chart Gallery
    • Mixed chart
    • Area chart
    • Bar chart
    • Bubble chart
    • Column Stack chart
    • Line chart
    • Pie chart
    • Scattered Plot chart
    • TreeMap chart
    • Circumplex chart
    • Pareto chart
    • Semi Gauge
    • KPI Tile
    • KPI Tile: Comparative Tile
    • KPI Tile: Sparkline
    • Map
    • Data Grid
    • Metric Summary
    • Dissolution/Decomposition chart
    • Spider chart
    • Waterfall chart
    • Funnel chart
    • Inverted Funnel chart
    • Heat Map chart
    • Geo chart
    • Sankey chart
    • Word Cloud
    • Candlestick chart
    • Benchmark Analysis
  • Report Final Screen
    • Tab
    • Search
    • Create a New ML View
    • Shared Views
    • Live Refresh
    • Export
      • Export Properties
    • Change Theme
    • Data Store Information
    • Options Assigned to a View
      • Analyse
        • Timeline Play
        • Data Drills
          • Drill Into
          • Drill Through
      • Editing a saved View
      • Duplicate
      • Remove
  • Applying Filters
    • View Specific Filter
      • Dimension-based View Filter
      • Measure-based View Filter
      • Date-based View Filter
    • Global Filter
      • Exclude from the Global Filter
      • Saving a Global Filter
      • Custom View Filter
      • LOV Settings
  • Interactions
Powered by GitBook
On this page
Export as PDF
  1. Creating a new Report
  2. Create New Report
  3. Creating a new Report with Data Preparation

Create a Report with Data Preparation- Partly from the Data Center

The page explains Report creation based on a Data Store (from the Data Center) that contains Data Preparation steps.

PreviousCreate a Report with Data Preparation - Inside the Report UINextDesigning a View

Check out the walk-through on a Report creation workflow with a Data Store that contains saved Data Preparation steps.

Please follow the below-given steps to create a new Report based on a Data Sandbox file with Data Preparation Steps:

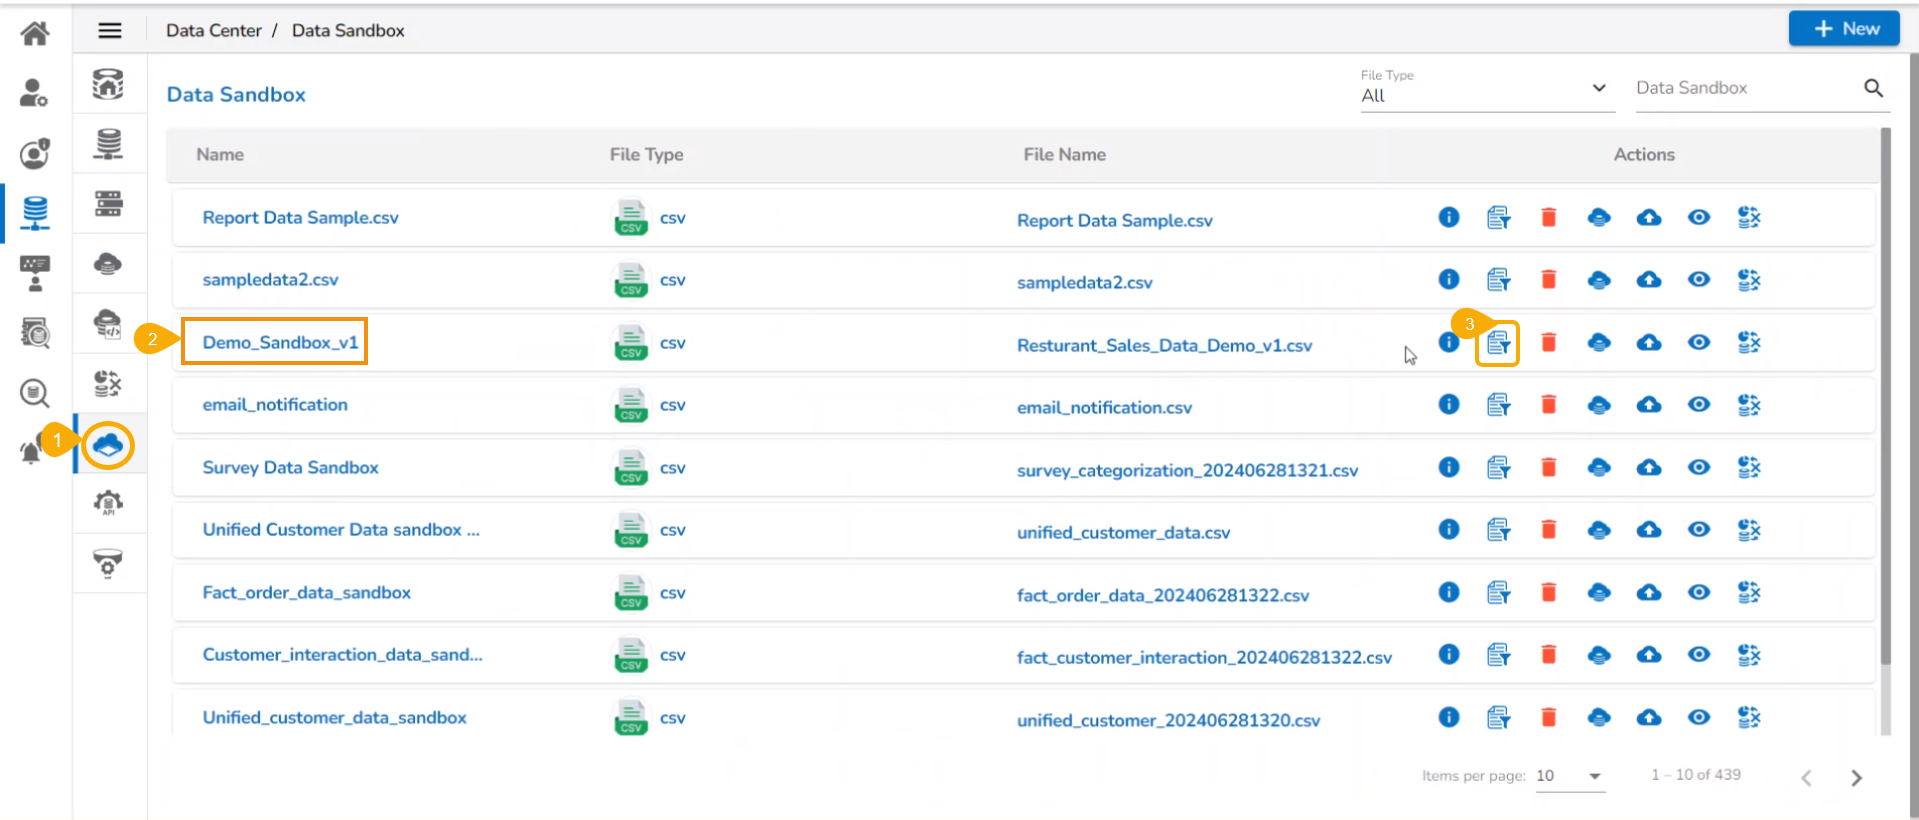
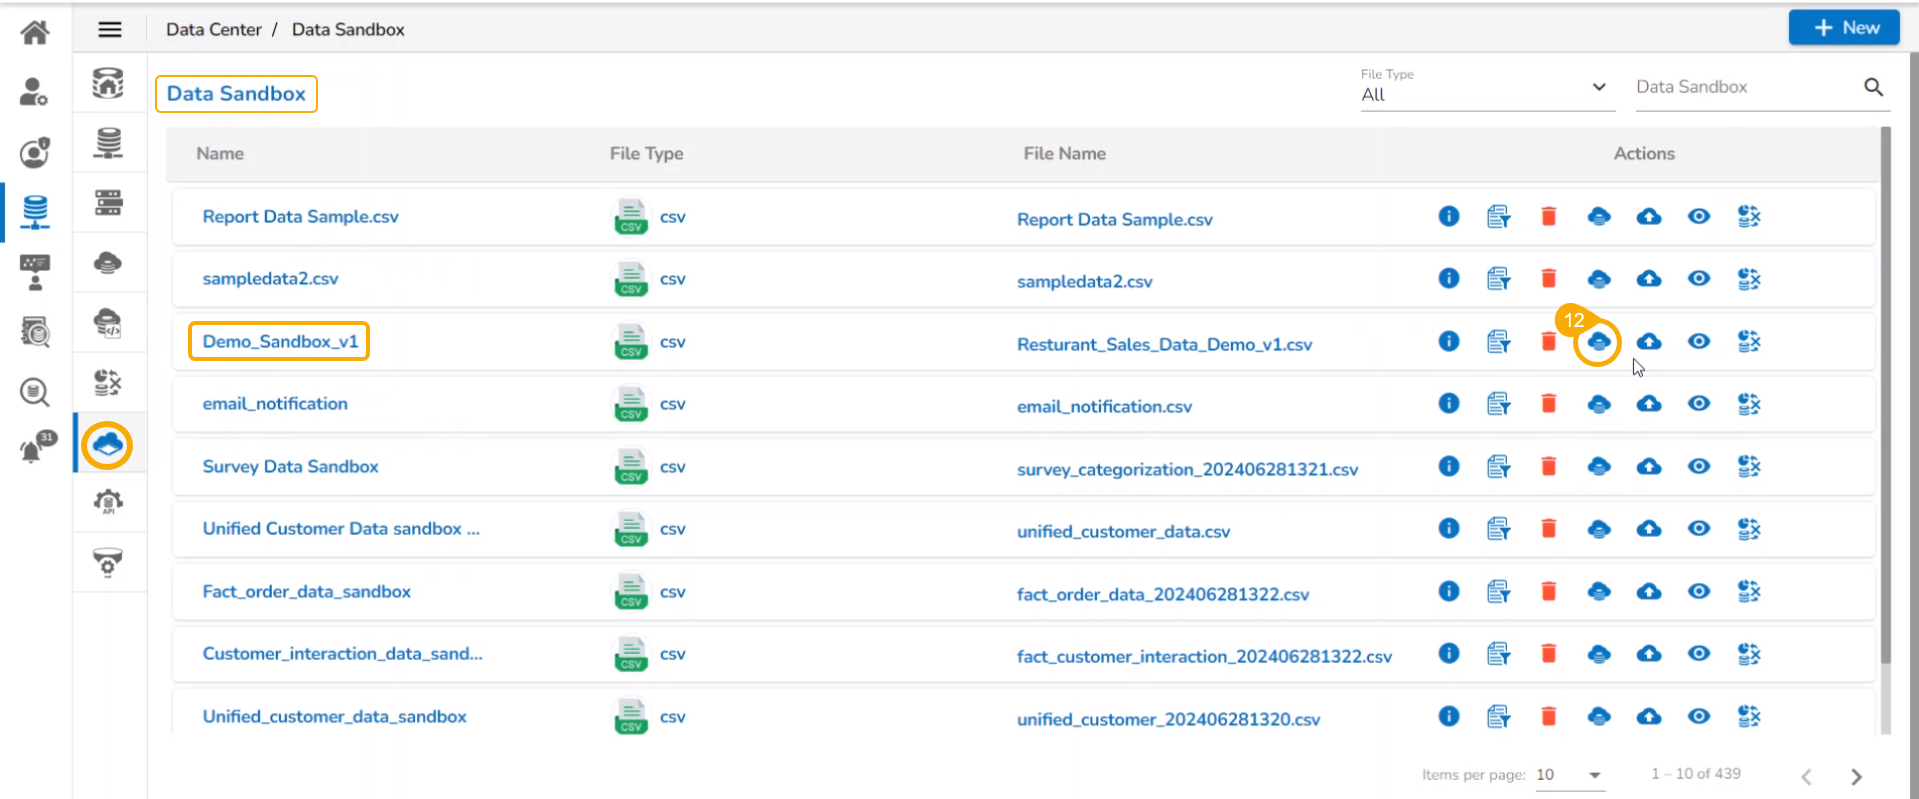
  • Navigate to the Data Sandbox list from the Data Center module.

  • Select a Data Sandbox file from the list.

  • Click the Data Preparation icon to create a Data Preparation and make some transformations.

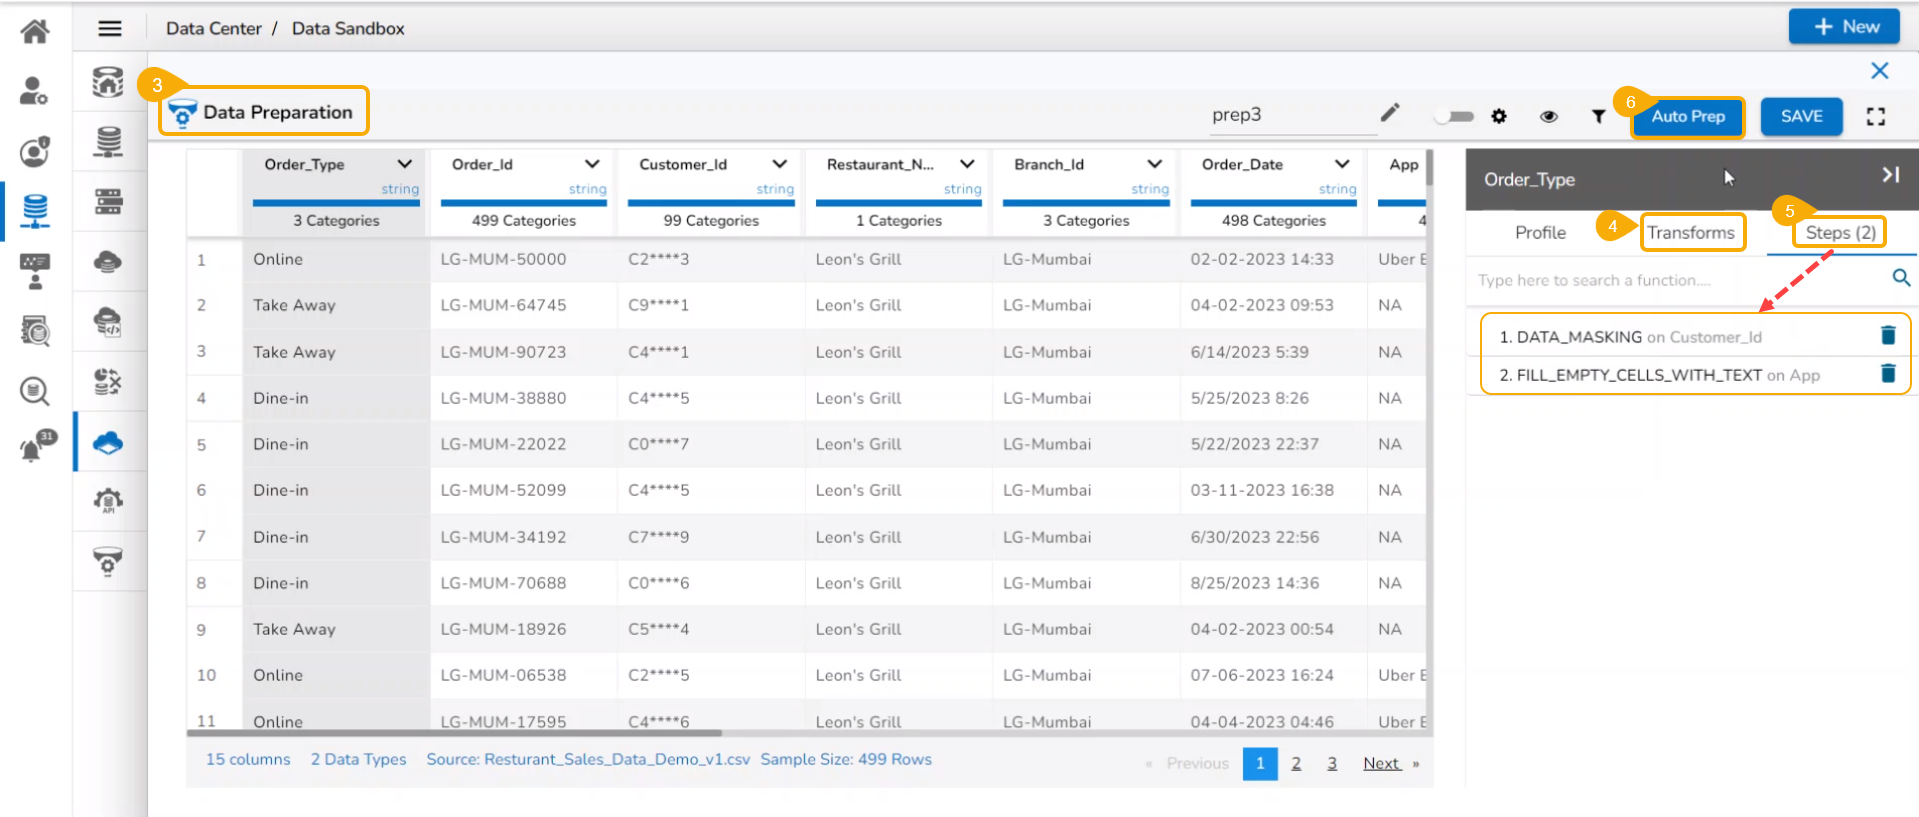
  • The user gets redirected to the Data Preparation module.

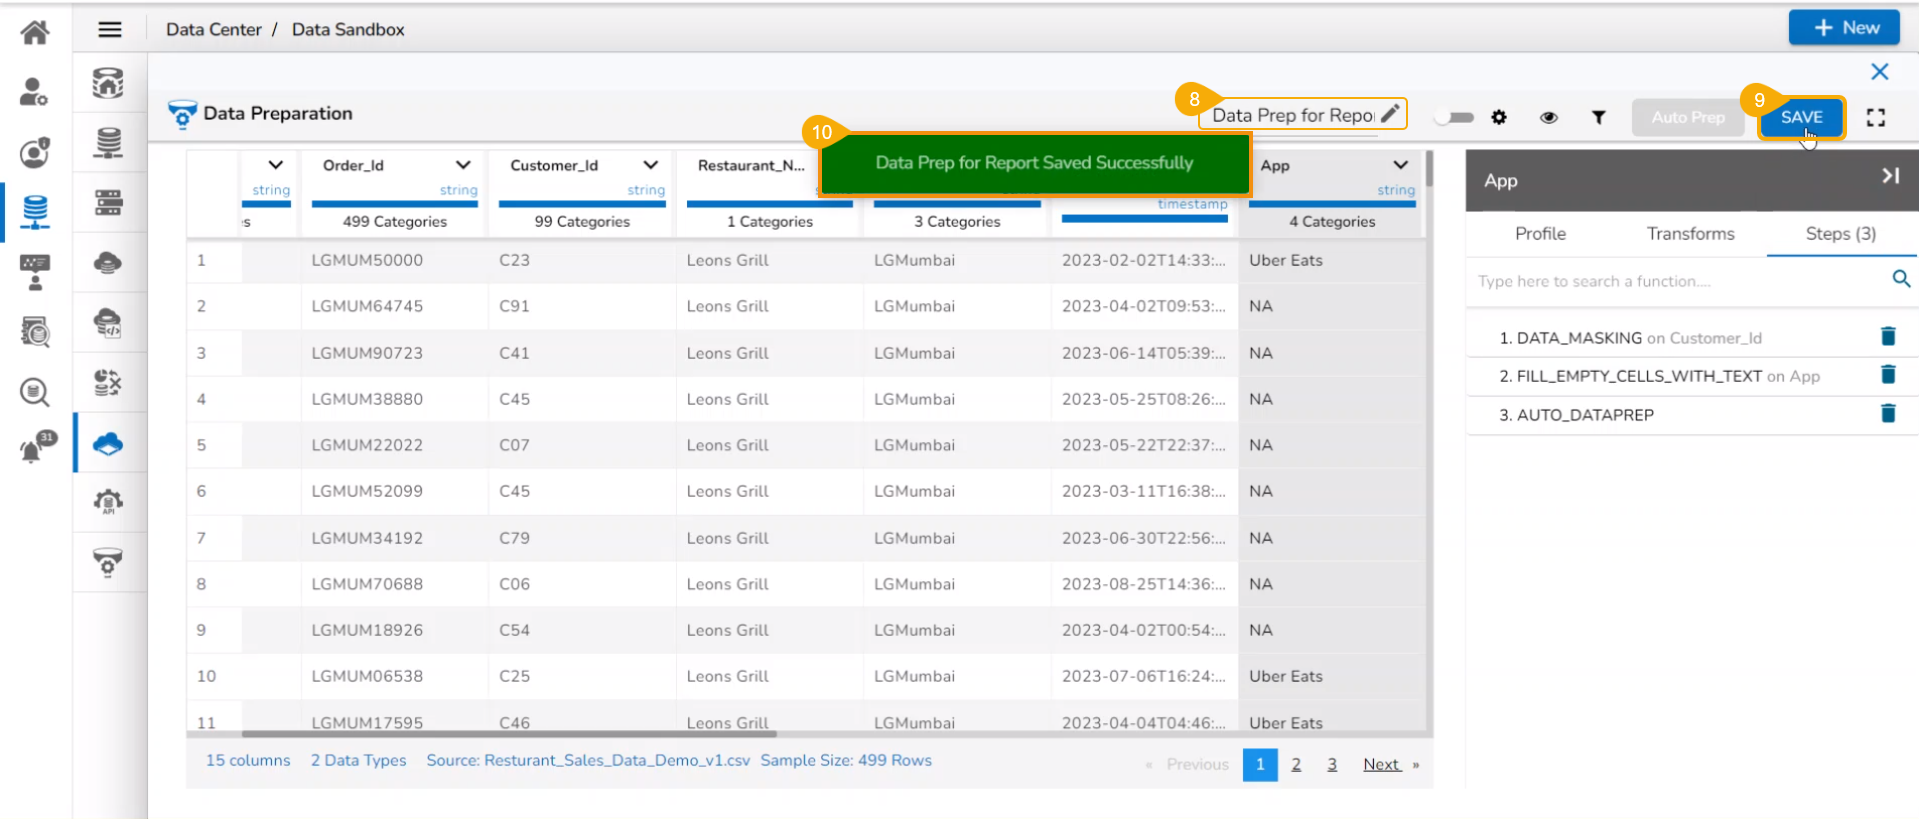
  • Apply transformations using the Transforms tab.

  • The applied transforms will be noted under the Steps tab. You may open it to see the applied transforms.

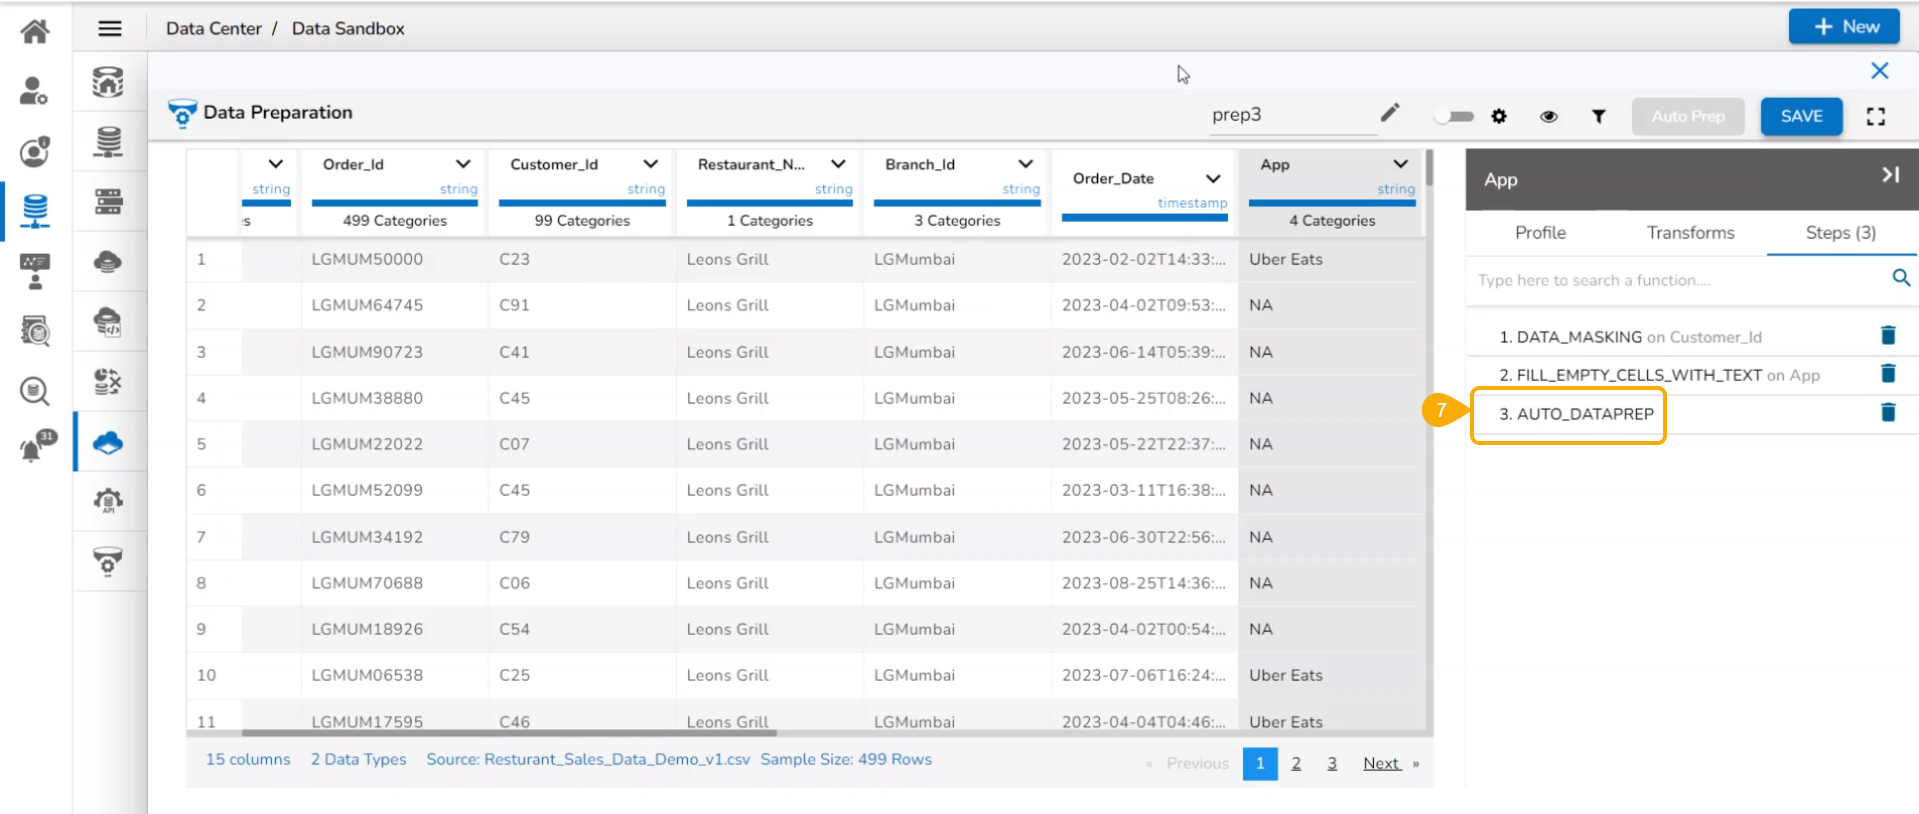
  • Click the Auto Prep option to apply the Auto Prep functionality.

  • The Auto Prep is also mentioned under Steps tab after being applied to the selected data.

  • Provide a name to the Data Preparation.

  • Click the SAVE option.

  • A notification ensures that the data preparation is saved.

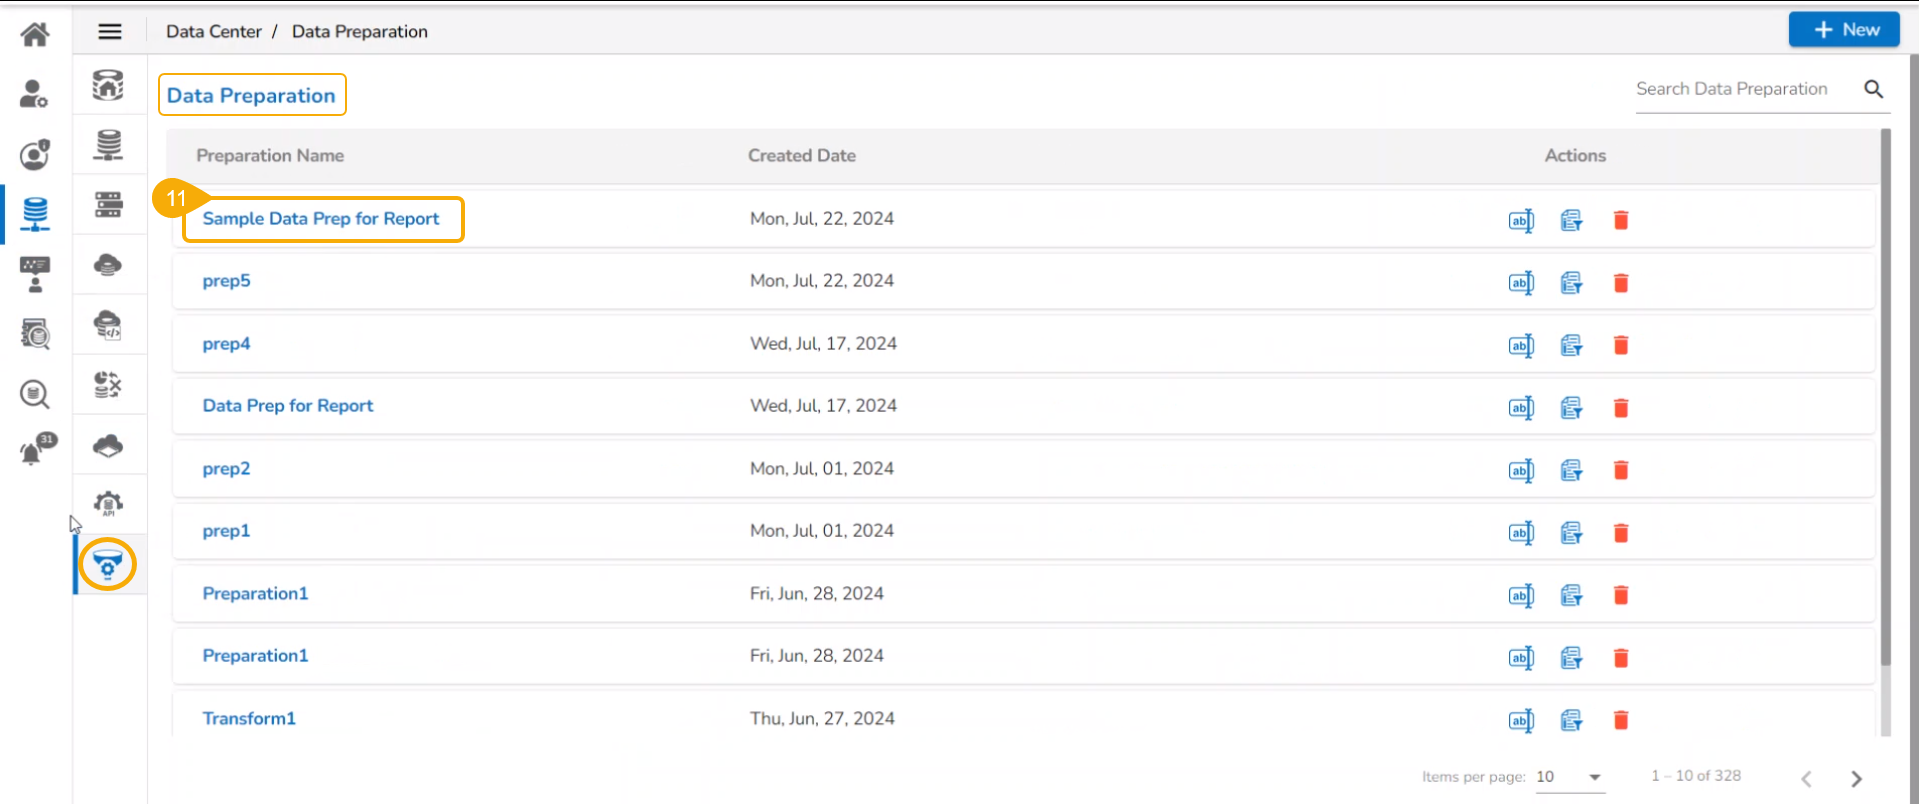
  • The Data Preparation gets added to the Data Preparation list.

  • Click the Create Data Store icon for the same Sandbox file from the Sandbox list.

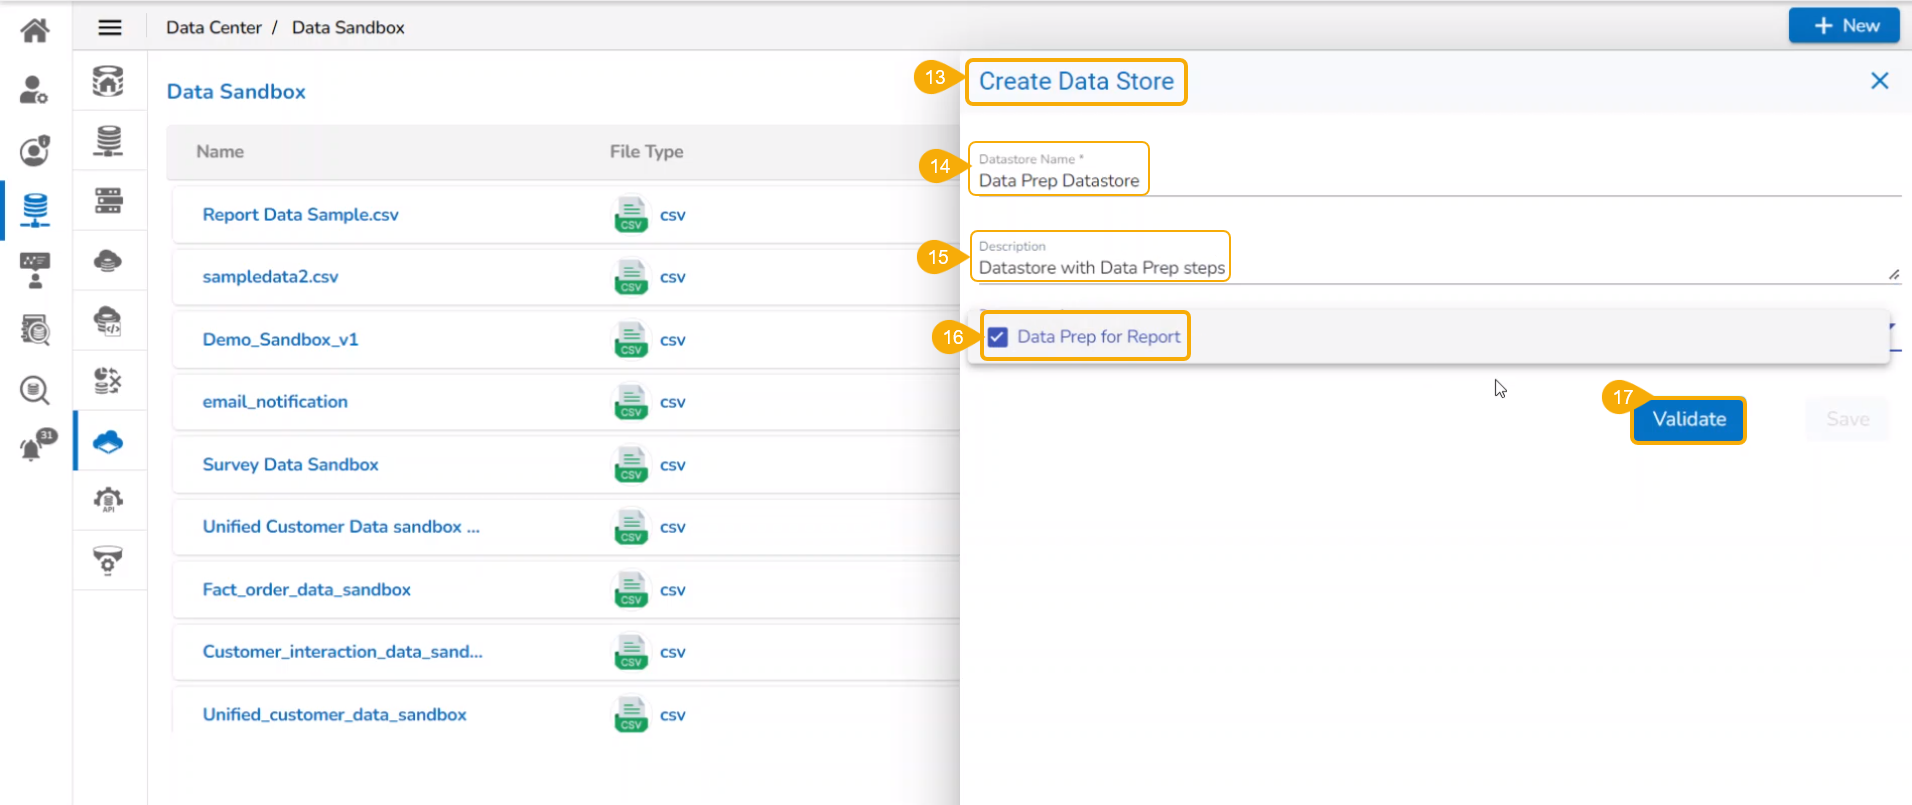
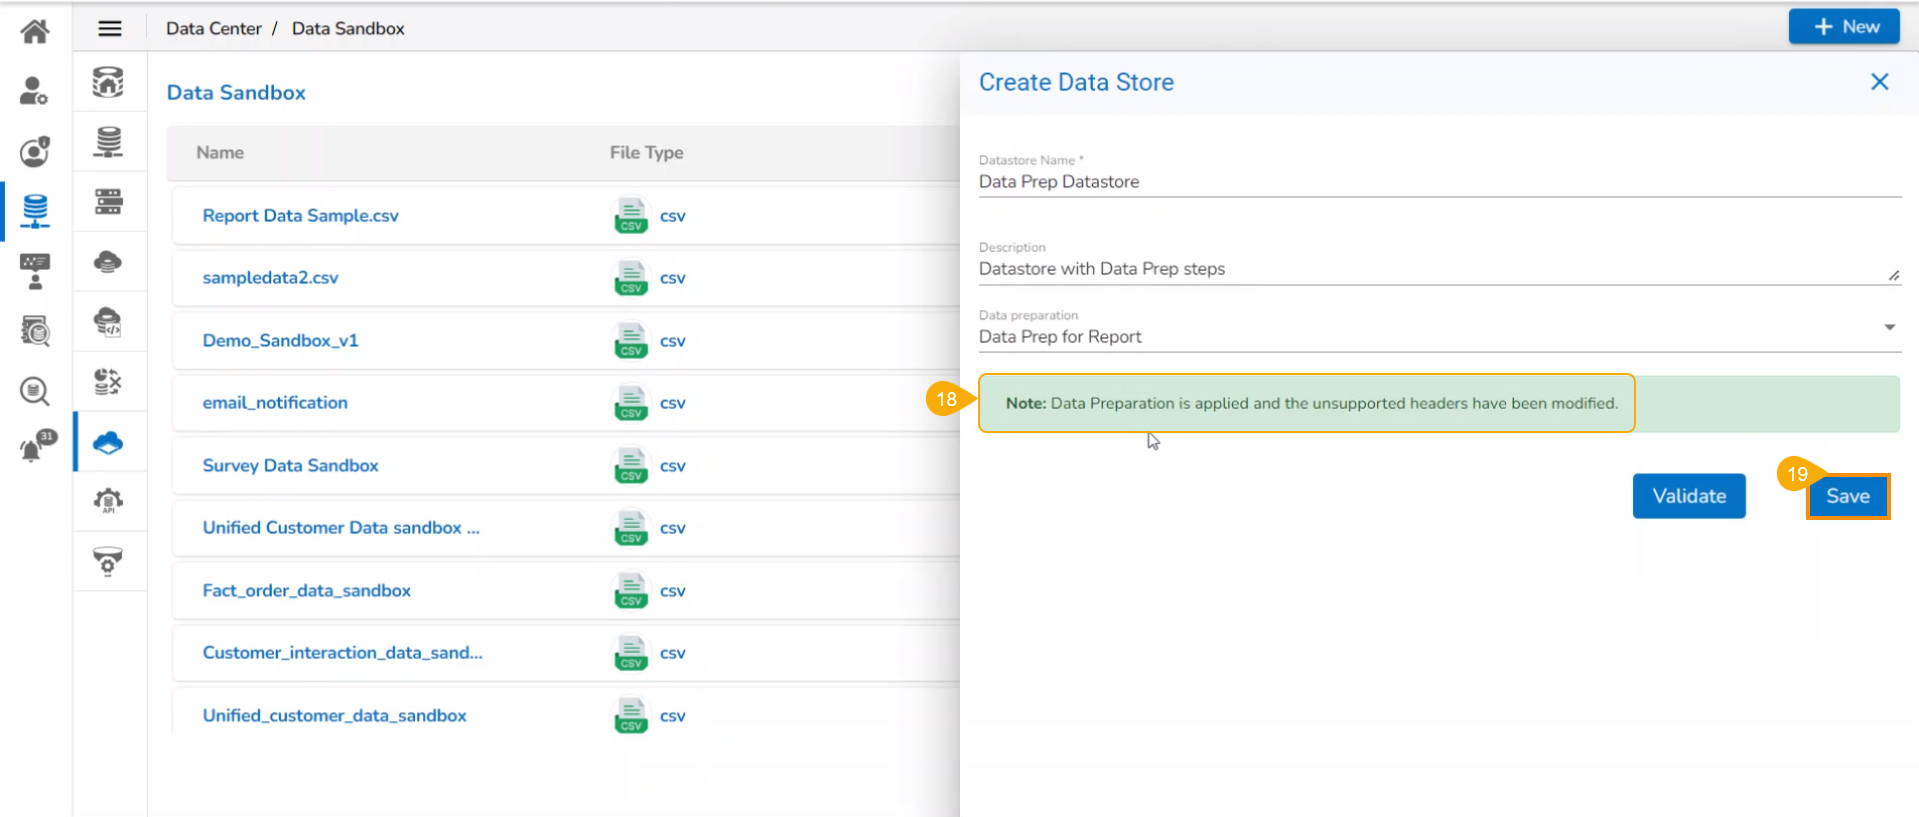
  • The Create Data Store window appears.

  • Provide a name for the Data Store.

  • Describe the Data Store.

  • Select the available Data Preparation using the drop-down menu.

  • Click the Validate option.

  • A note gets displayed ensuring that the Data Preparation is applied and unsupported headers are modified.

  • Click the Save option to finish the Data Store creation.

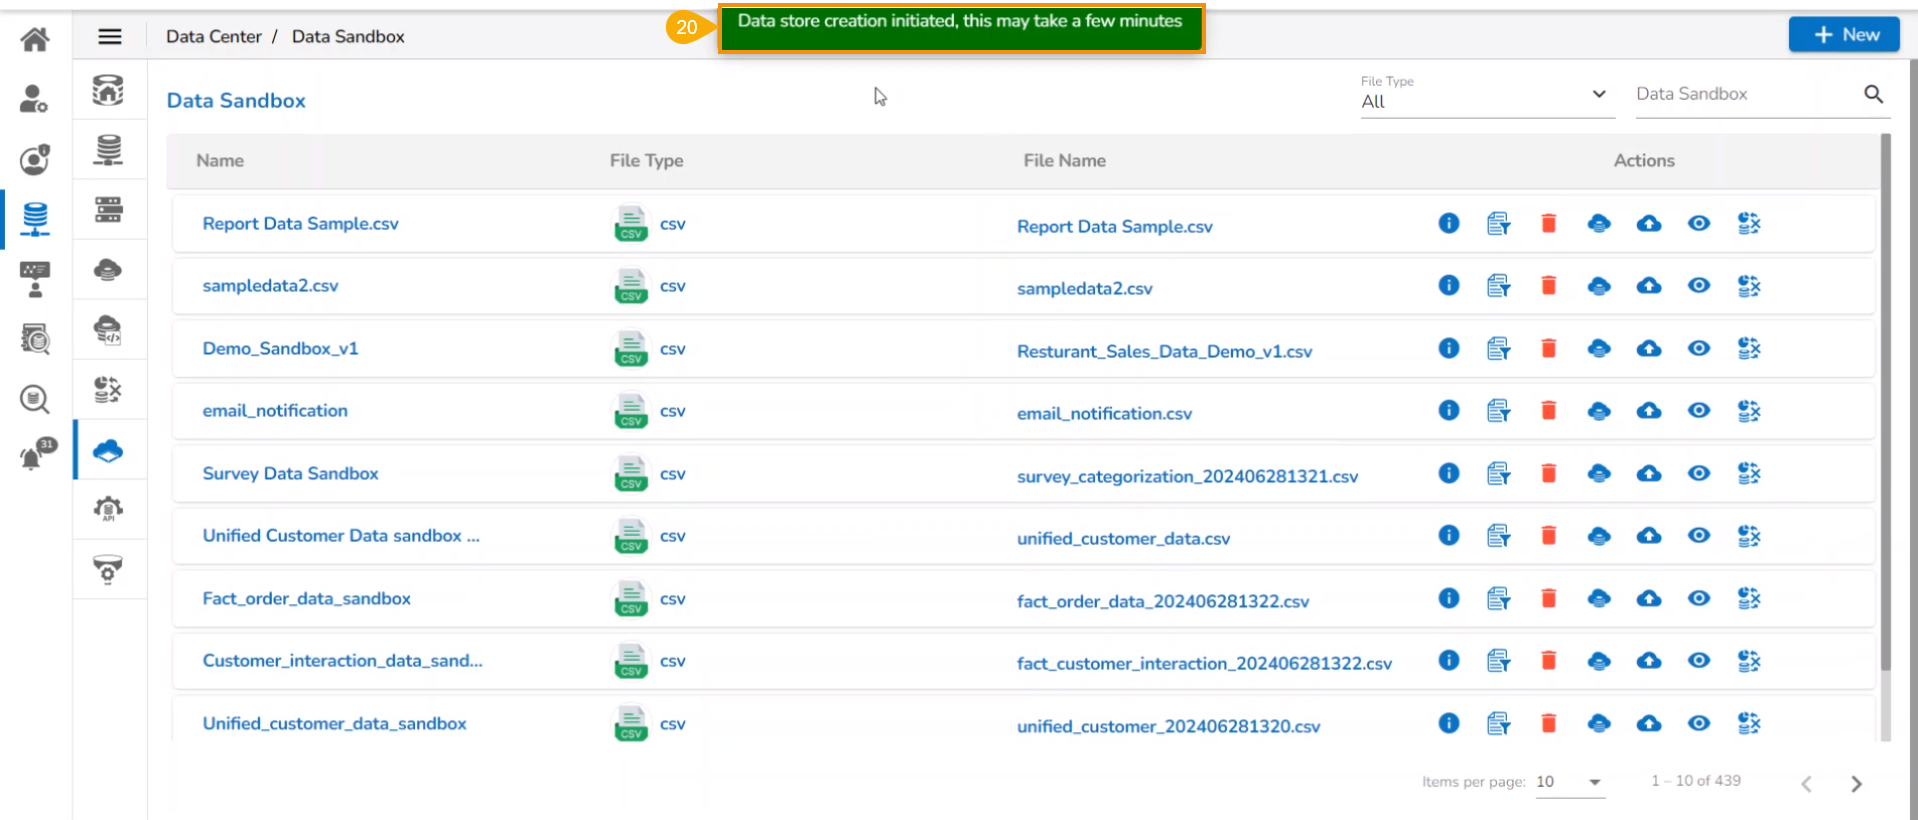
  • A notification ensures that the Data Store creation has been initiated and may take a few minutes.

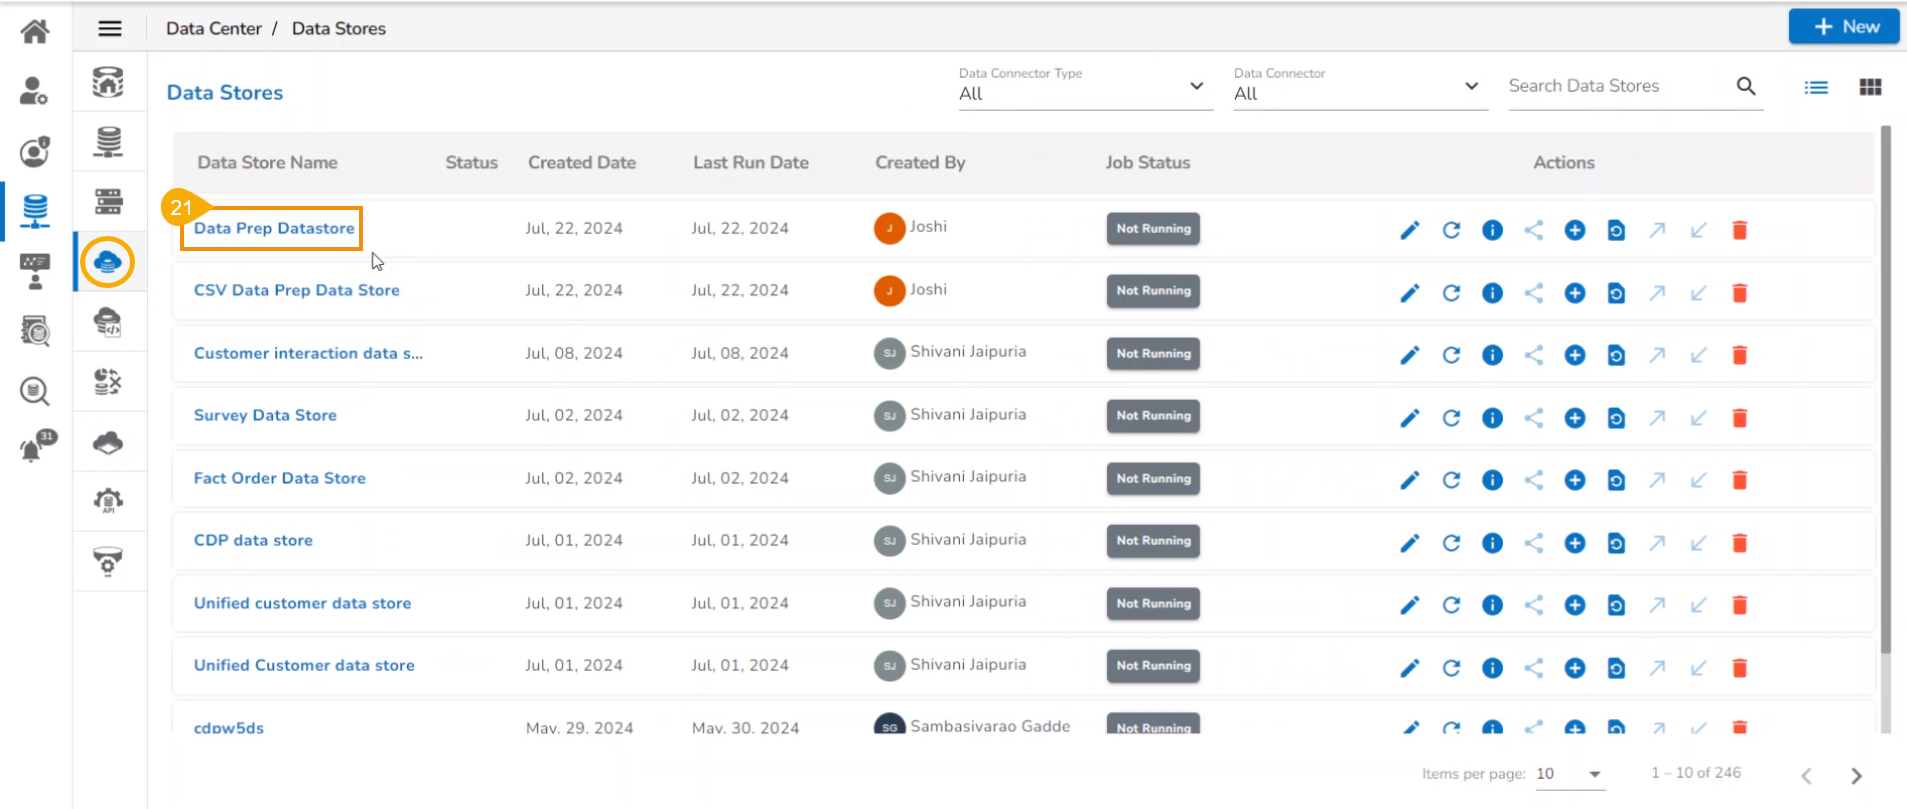
  • The newly created data store with data preparation steps gets added to the Data Store list.

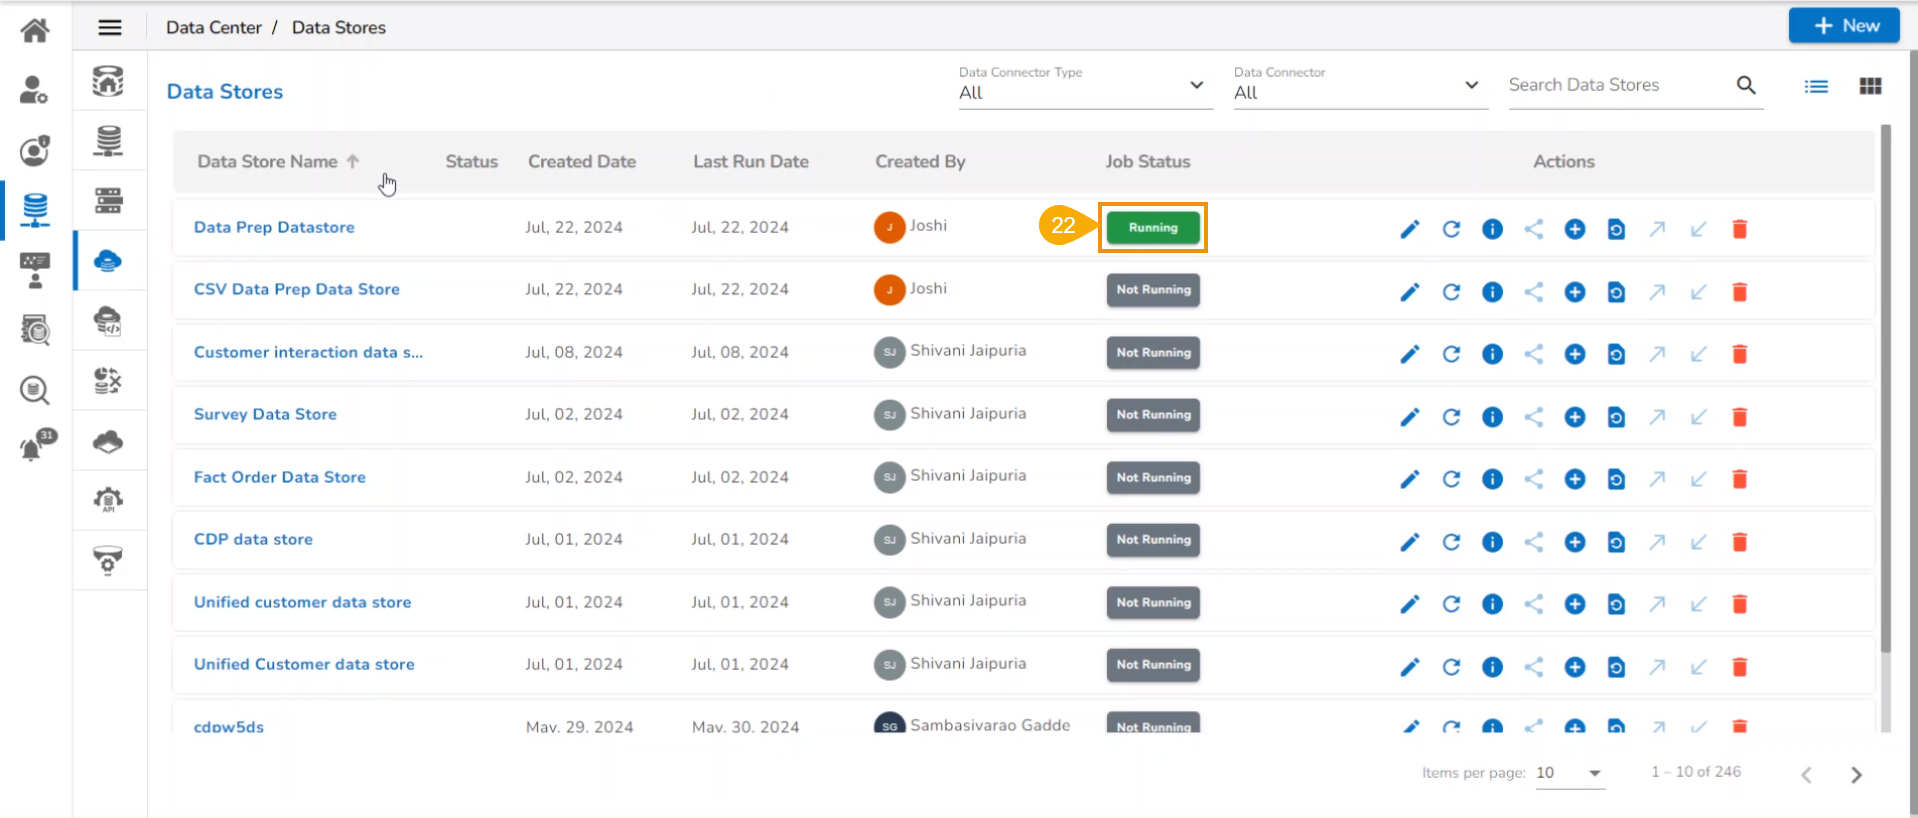
  • Wait till the Job Status for the newly created Data Store gets displayed as Running.

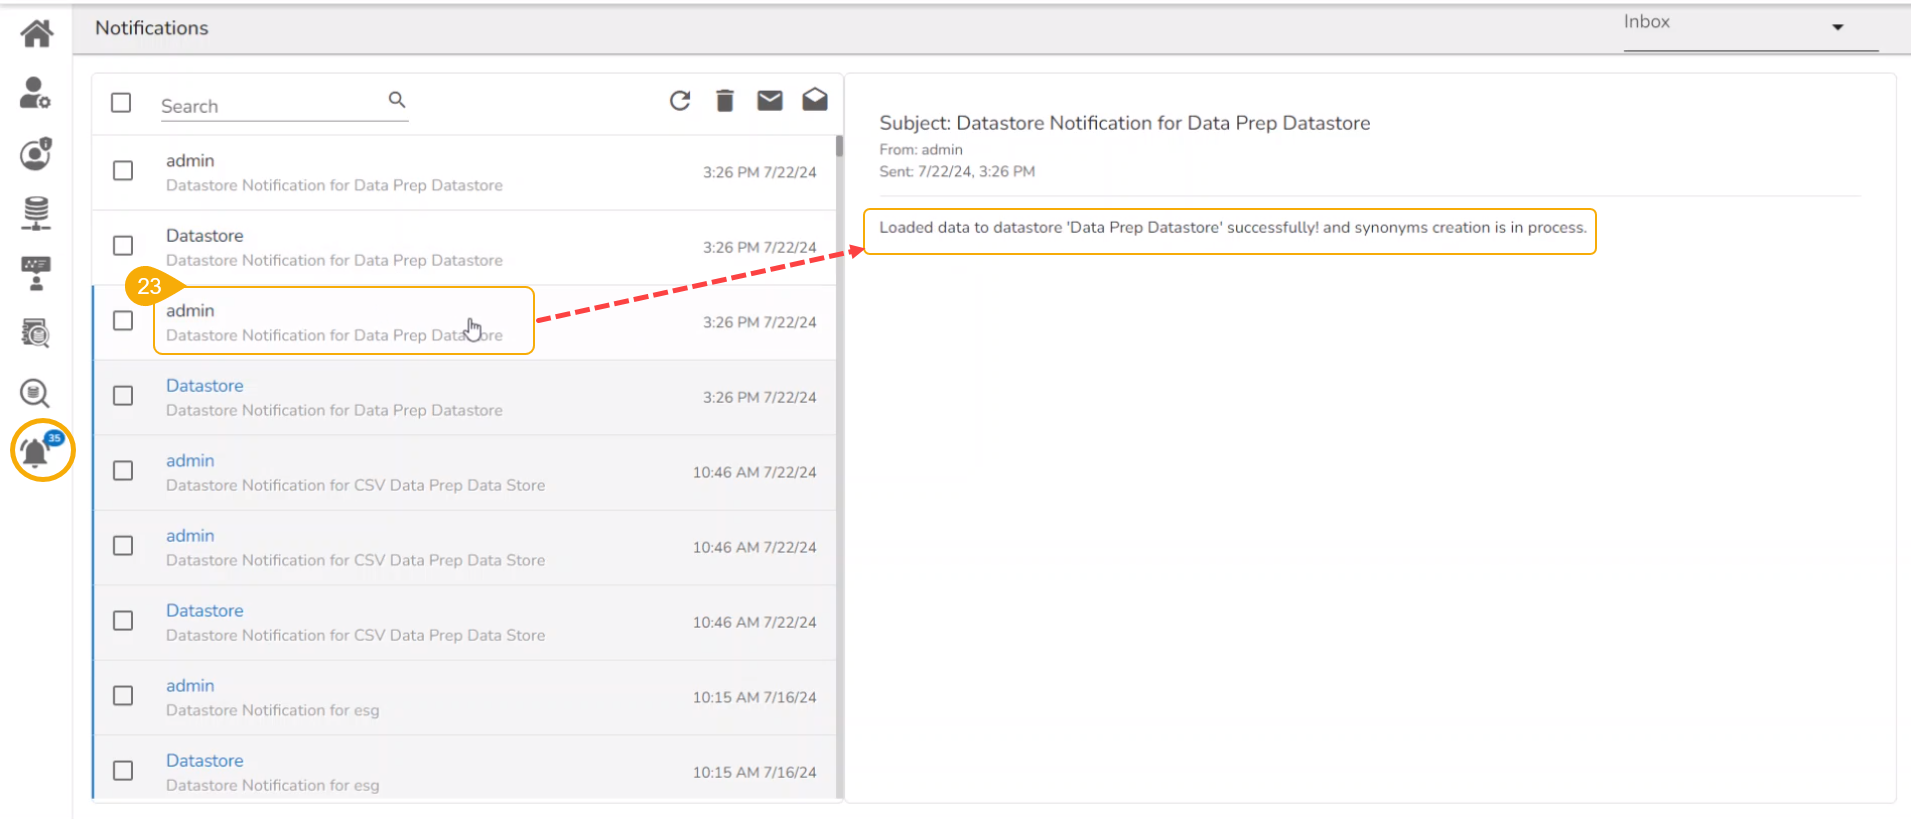
  • The user may open the Notifications section to check the Data Store update. It would notify that the data is loaded to the newly created Data Store.

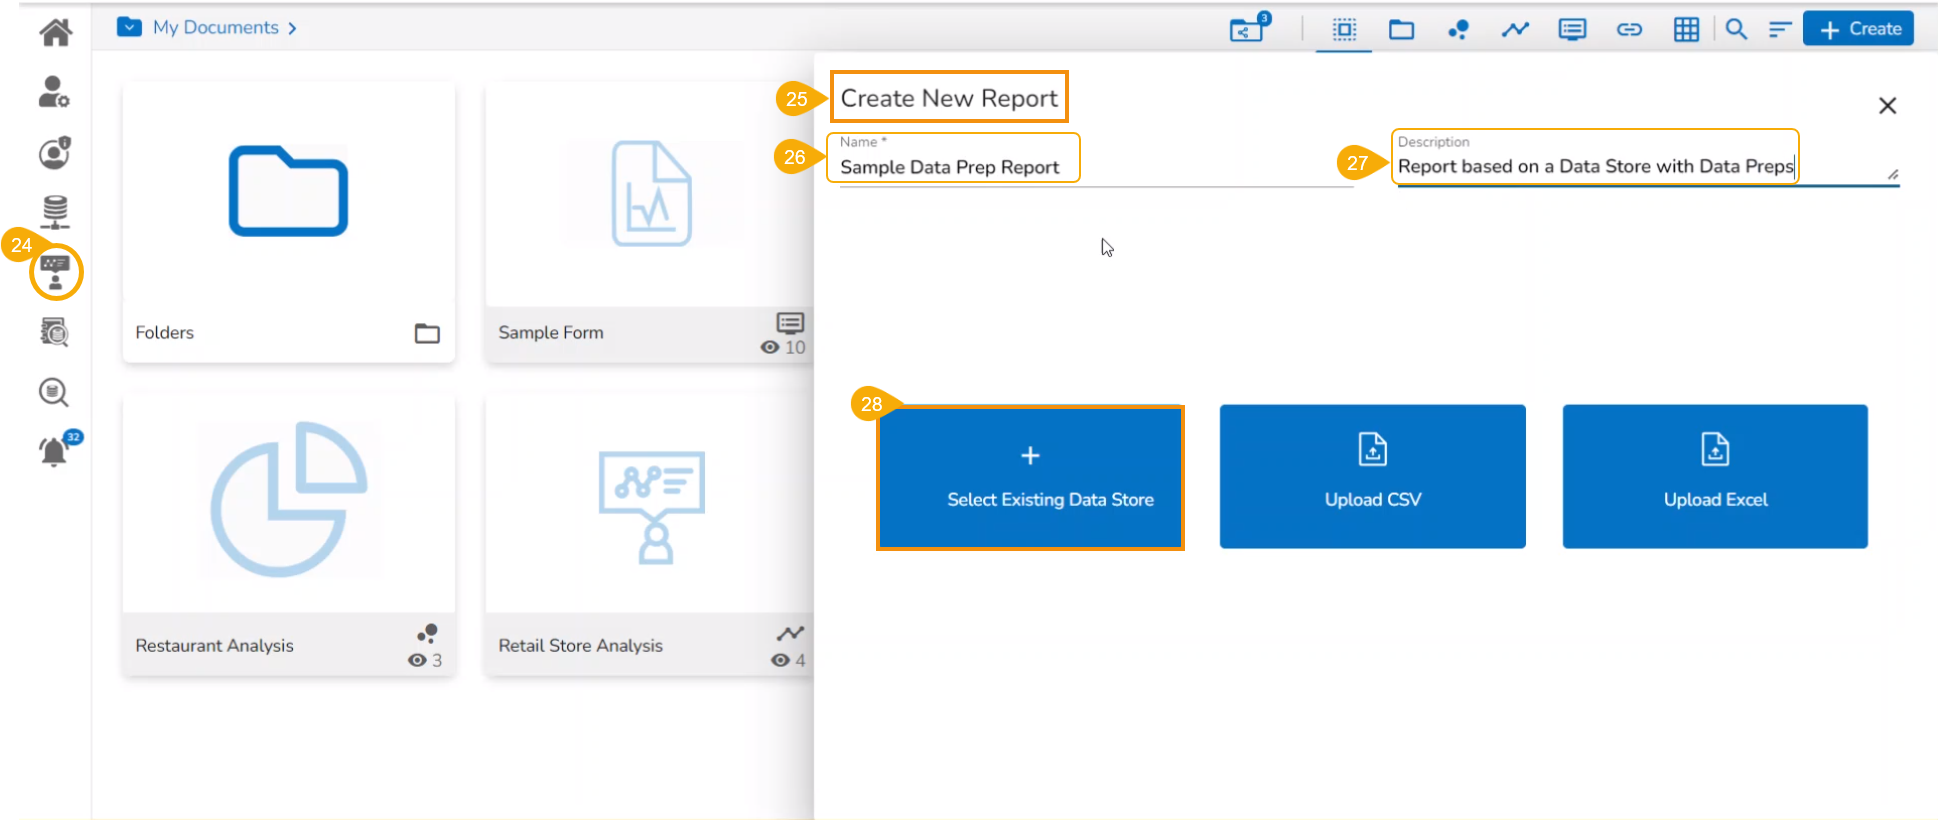
  • Navigate to the homepage and click the Report icon or Create New Report option to initiate the report creation.

  • The Create New Report window opens.

  • Provide a name for the Report.

  • Describe the report.

  • Click the Select Existing Data Store option to create the report.

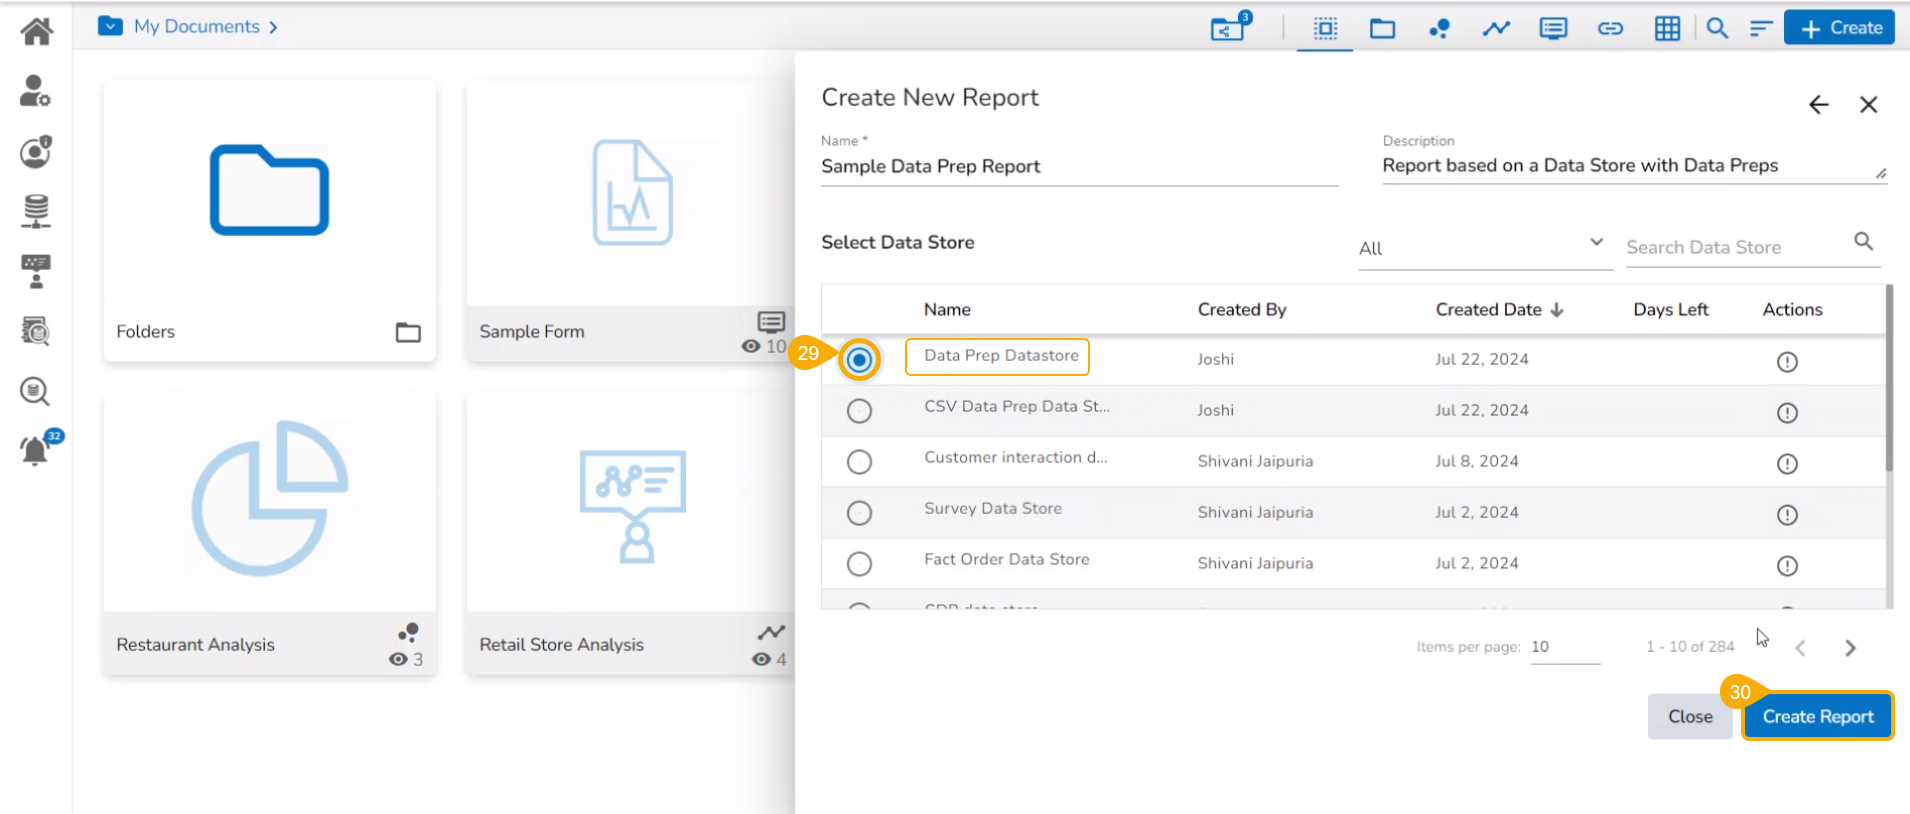
  • Select the data store earlier created with the Data Preparation steps using the checkbox.

  • Click the Create Report option.

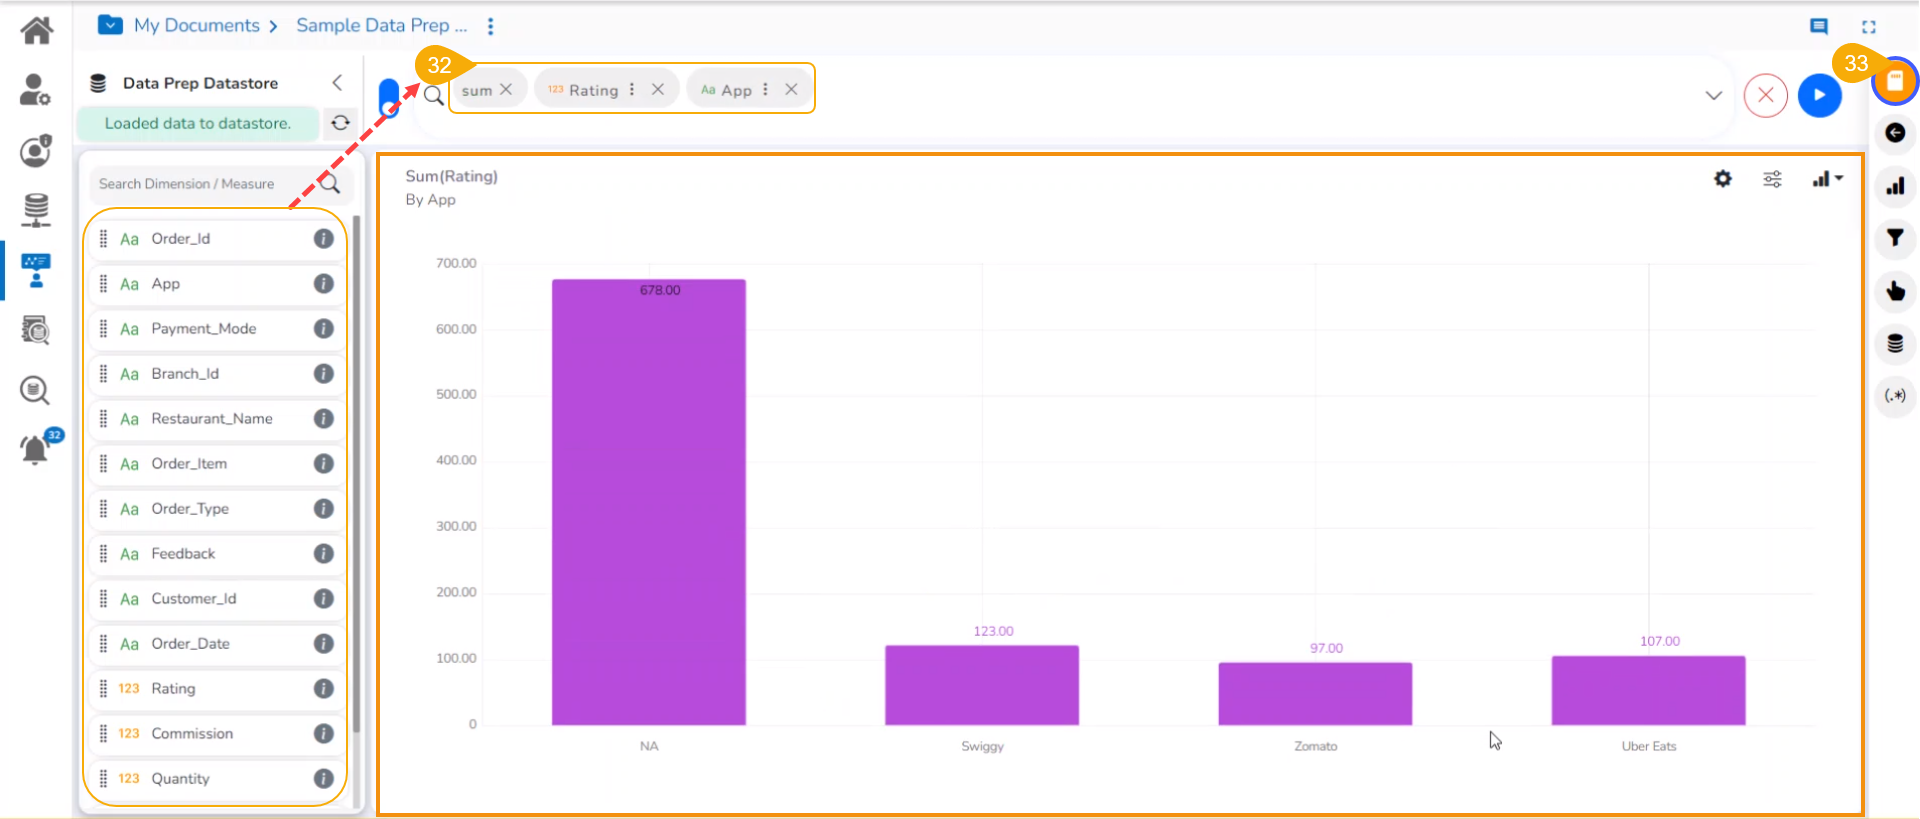
  • A new report gets created based on the Datastore and the user gets redirected to the Design page of the report.

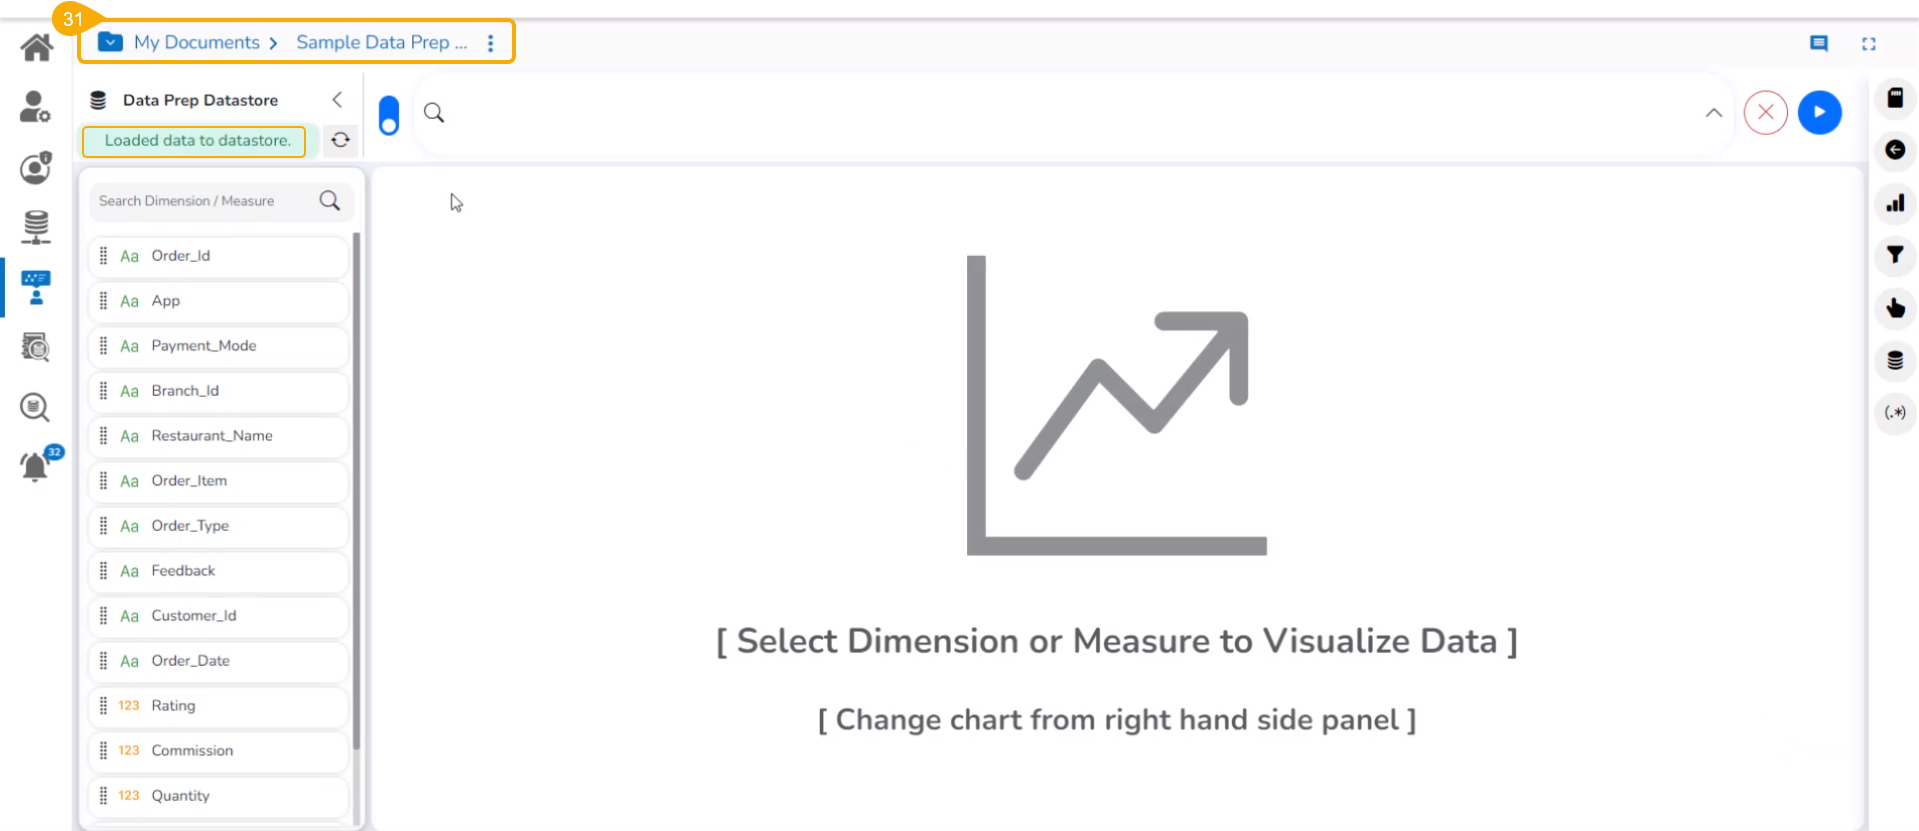
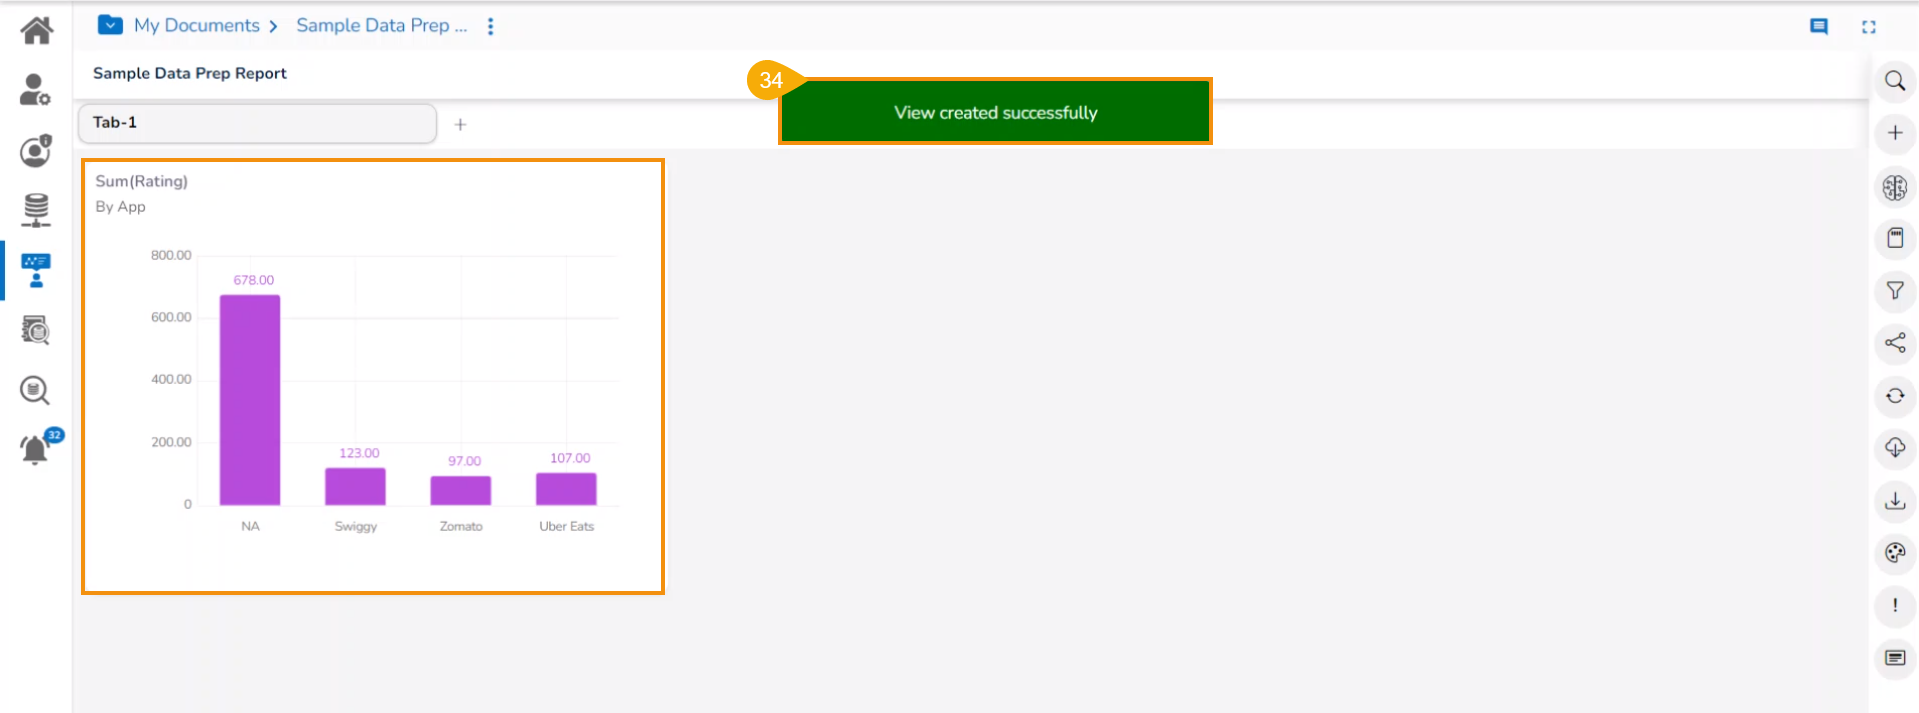
  • Drag and drop dimensions and measures to create a View.

  • Click the Save icon to save the View.

  • A notification message appears and the View gets saved to the Report.

Creating a new Report based on a Data Sandbox with Data Preparation Steps
Accessing Data Preparation icon for a Sandbox file