Semi Gauge
Check out the walk-through on how to set the Semi Gauge chart properties.
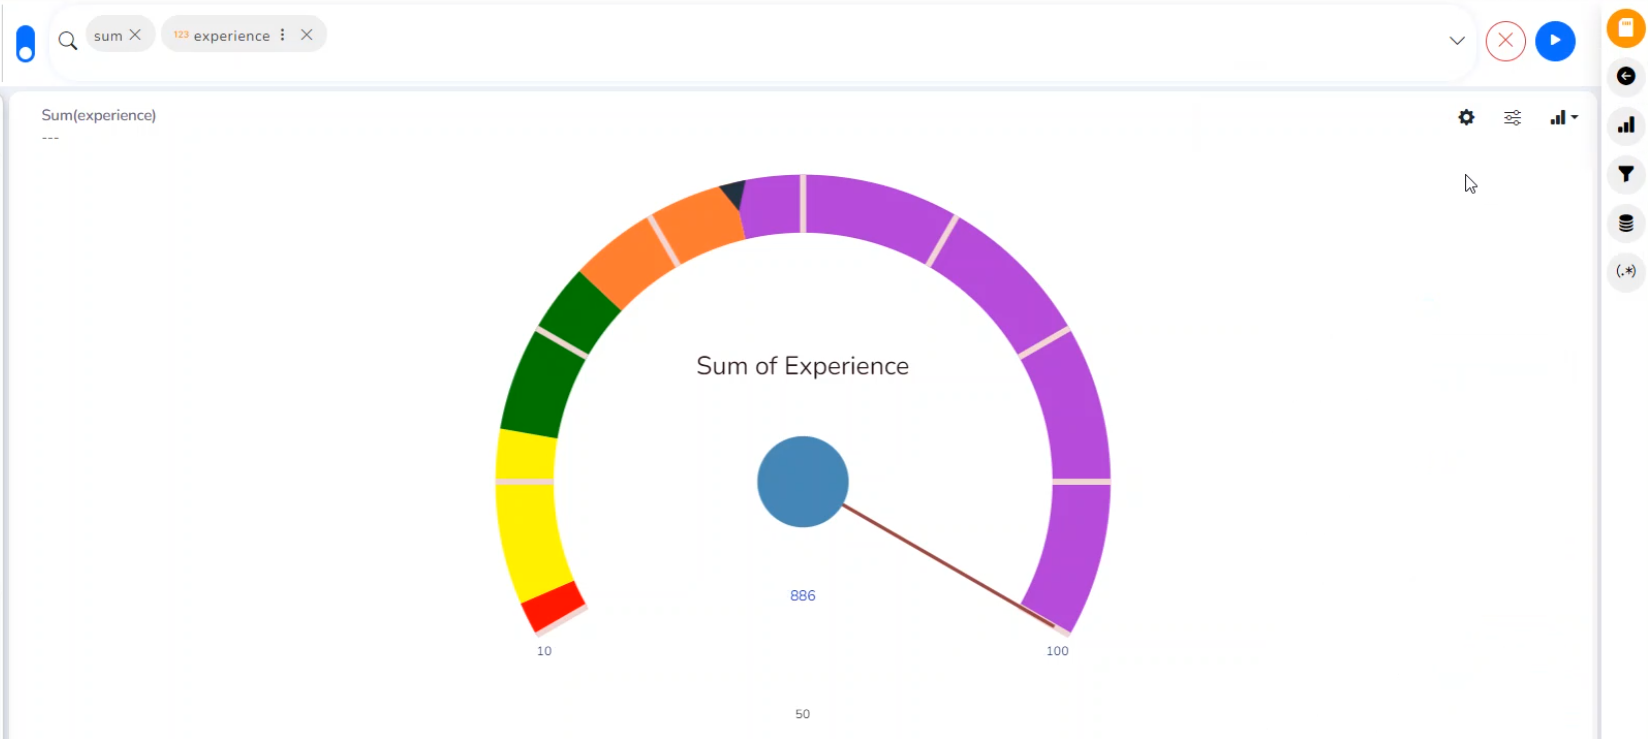
Semi-Gauge charts contain a semi-circle with the needle pointing at the target value. They indicate a specific dataset by utilizing a semi-circle that changes color to indicate whether the monitored data is within the defined limits. Users need to set boundaries (minimum and maximum values) for the gauge scale and various colors to indicate the predetermined ranges. The ‘Show Alert’ option has been provided to demonstrate the situation when the target values cross the set limits. Gauges are used in dashboards, real-time monitors, and reports. They can display Key Performance Indicators (KPIs), progress indicators, and quantity indicators.
Best Situation to use Semi-Gauge: To monitor any performance that contains predefined ranges
Examples: The overall performance of a student/class in an examination.
Properties
General Settings
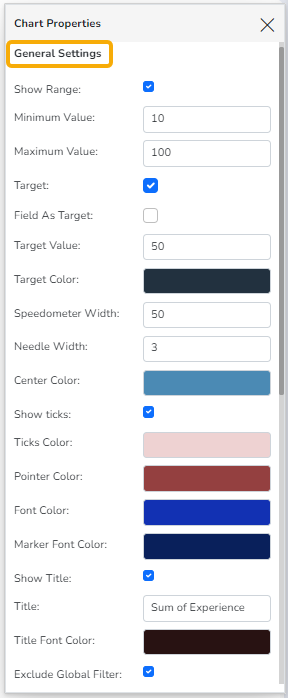
Show Range: Use a checkmark in the given box to display ranges on the semi-gauge.
Minimum Value: Set a minimum value to be shown on the chart (It should be less than the maximum set value).
Maximum Value: Set a maximum value to be displayed on the chart (It should be more than the minimum set value).
Target: Enable the target by marking it in the checkbox.
Target Value: Set a target value to display the target in the semi-gauge.
Field as Target: Enable this option to select a Measure field to display the Target.
Aggregation: Select an aggregation type from the given drop-down menu.
Measure: Select a measure field from the drop-down menu to apply the target value.
Target Value: User-defined value to set a target.
Target Color: Set a target color.
Speedometer Width: Set the width of the speedometer through this option.
Needle Width: Set the needle width by using this option.
Center Color: Select a color for the center by using this option.
Show ticks: Use a checkmark in the given box to display ticks on the semi-gauge.
Ticks Color: Select a color for the tick marks shown on the semi-gauge through this option.
Pointer Color: Select a color for the pointer arrow using this option.
Font Color: Select a color for the font of the digit that displays the overall value by using this option.
Marker Font Color: Select a color for the marker fonts displayed on the semi gauge indicating the start and end limit.
Show Title: Use the checkbox with a tickmark to display the chart title.
Title: Insert a title for the chart.
Title Font Color: Select a title font color using this option.
Exclude Global Filter: The View will be excluded from the Global Filter condition by putting a checkmark in the box.
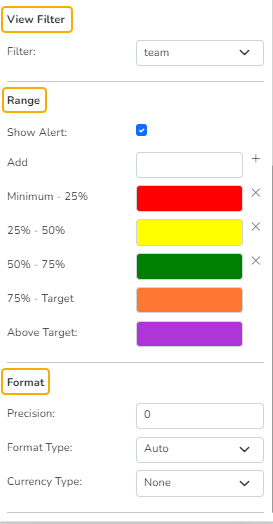
View Filter
Filter: Select a filter condition using the drop-down menu.
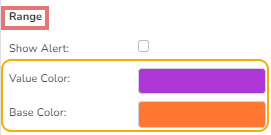
Range
Show Alert: Enable various ranges (in %) using a checkmark in the given checkbox.
Add: Use this option to insert a new range.
Value Color: Set a value color.
Base Color: Set a base color.
Please Note:
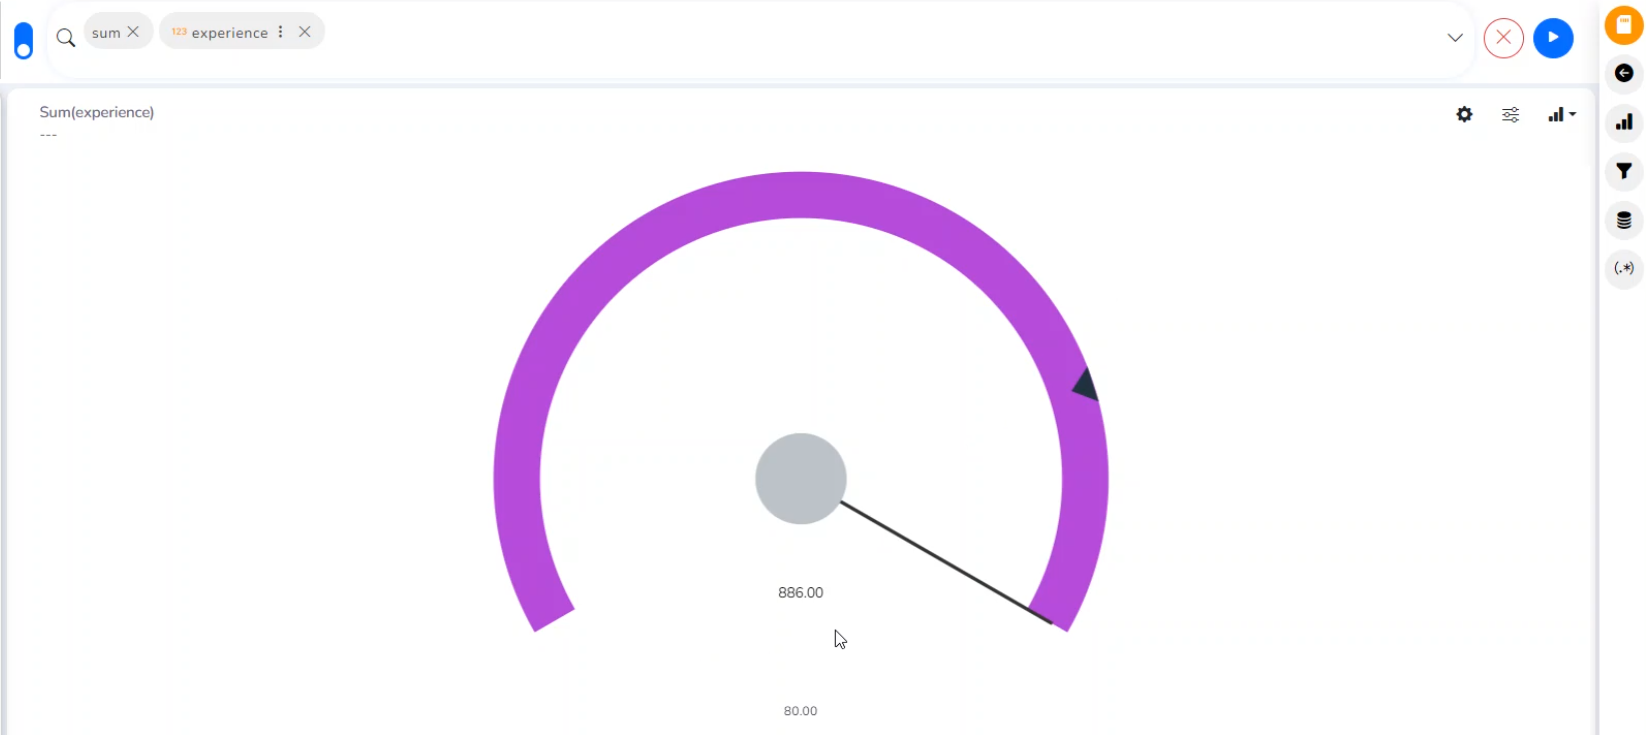
The Value Color and Base Color options appear when the Show Alert option is not selected.
If the Show Range option is enabled, it will allow the user to add different ranges to be displayed in the semi-gauge chart.
Format
Precision: Set the after decimal value (It can show up to 5 precision).
Format Type: Select a desired format type from the drop-down menu (the provided options for this field are: None, Auto, Percent, Thousand, Lacs, Crore, Million, Billion, Trillion, Quadrillion).
Currency Type: Select a currency symbol to be displayed in the View (the provided options for this field are: None, Rupees, Euro, Pound, USD, Yen, Cent).
Please Note: The following image displays various ranges when the Show Alert option is enabled.
Please Note:
The target value should be included in the minimum and maximum set values range.
Semi-Gauge supports only one measure value. It converts the selected Dimension value into a Measure to plot the Semi-Gauge chart.
The Base color appears when the selected Maximum Value for the chart is more than the maximum value given for the selected measure.