Custom View Filter
Check out the walk-through on Custom View Filter to understand the functionality.
The user can access this view-specific filter option from the chart properties provided on the final screen of report when the View is saved.
Applying a Custom View Filter
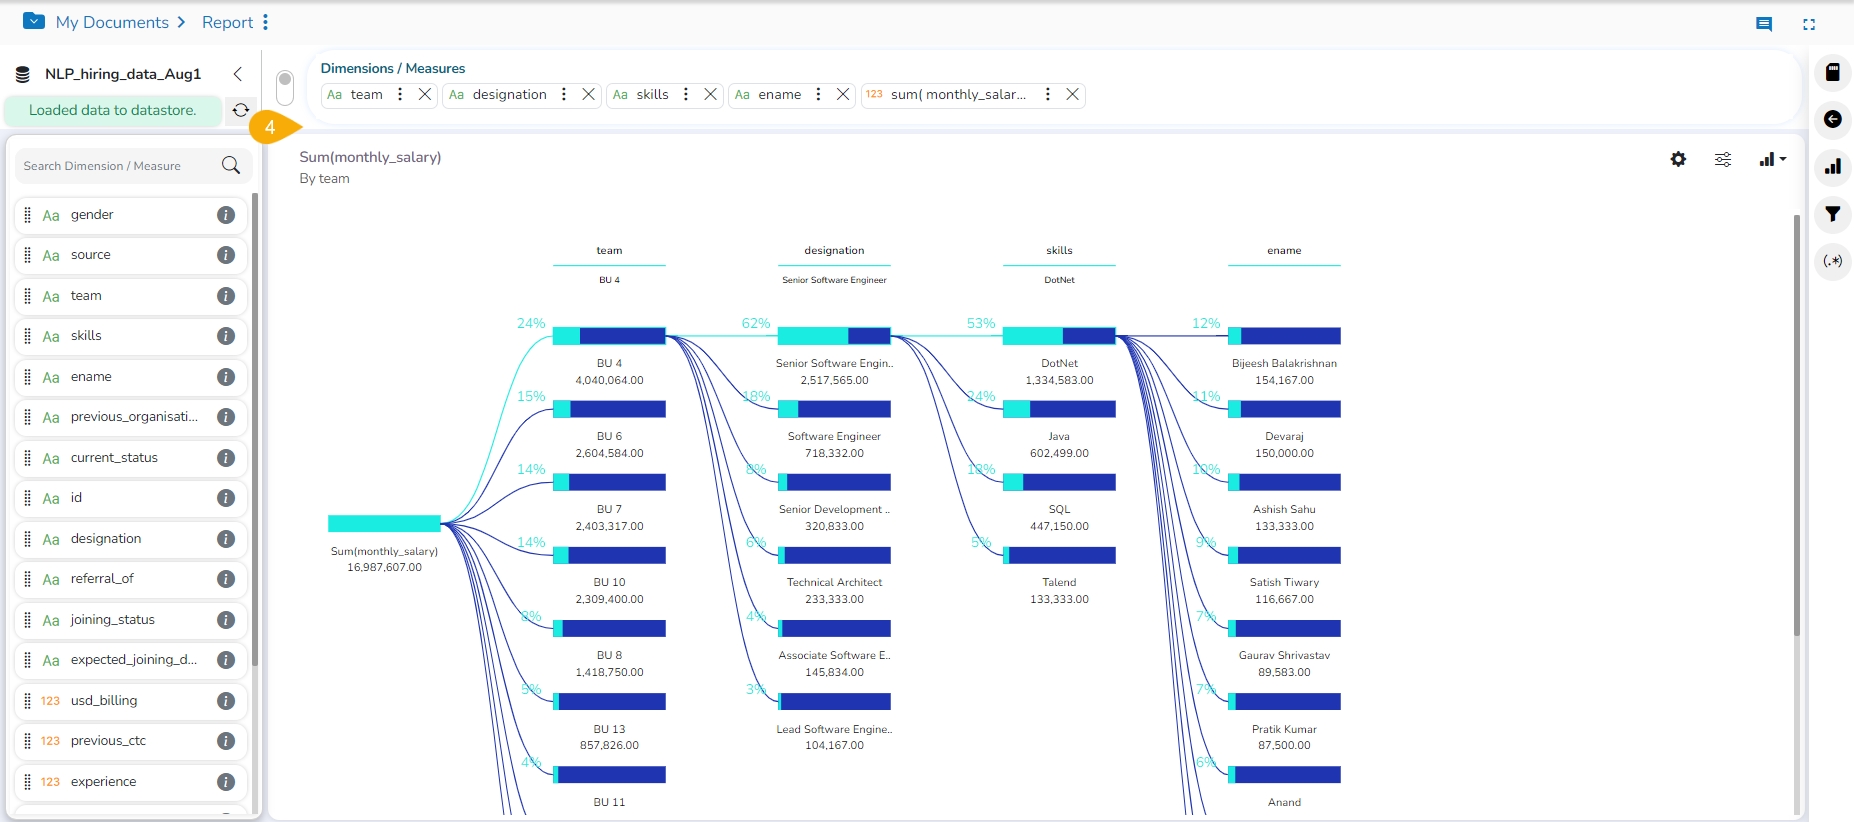
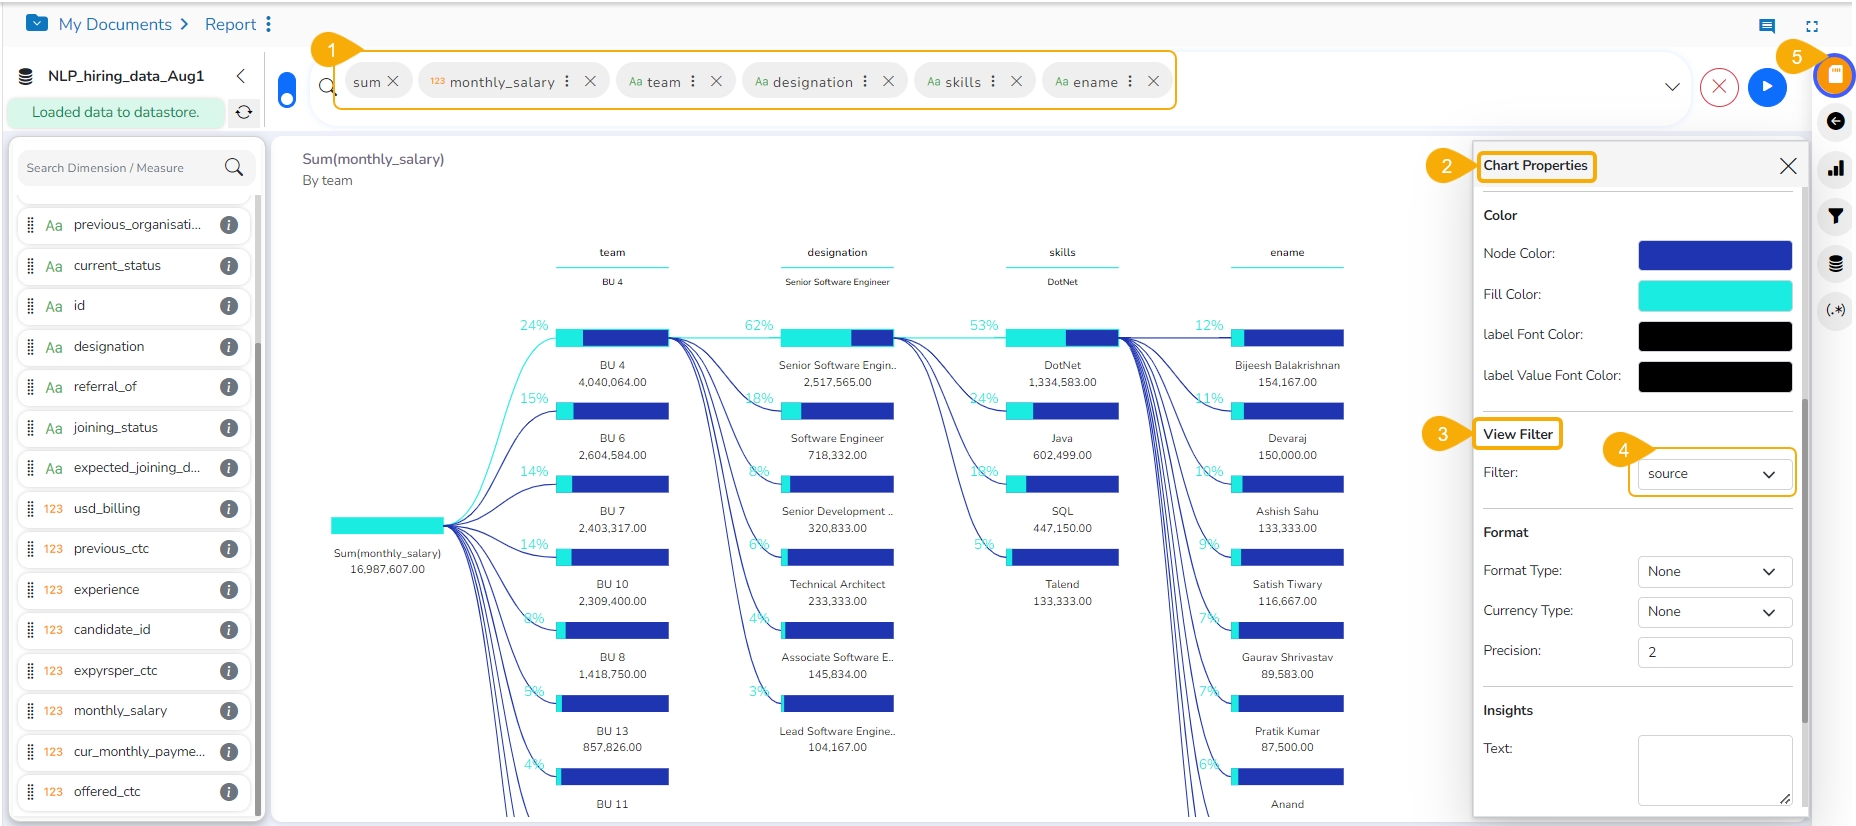
Create a View by the drag and drop of the desired dimension and measure options using the Design canvas (By default, the Mixed chart gets selected to display the selected data).
Open the Chart Properties tab.
Navigate to the View Filter field.
Select a filter condition using the drop-down menu (In this case, the filter condition is Source).
Click the Save option to save the View.
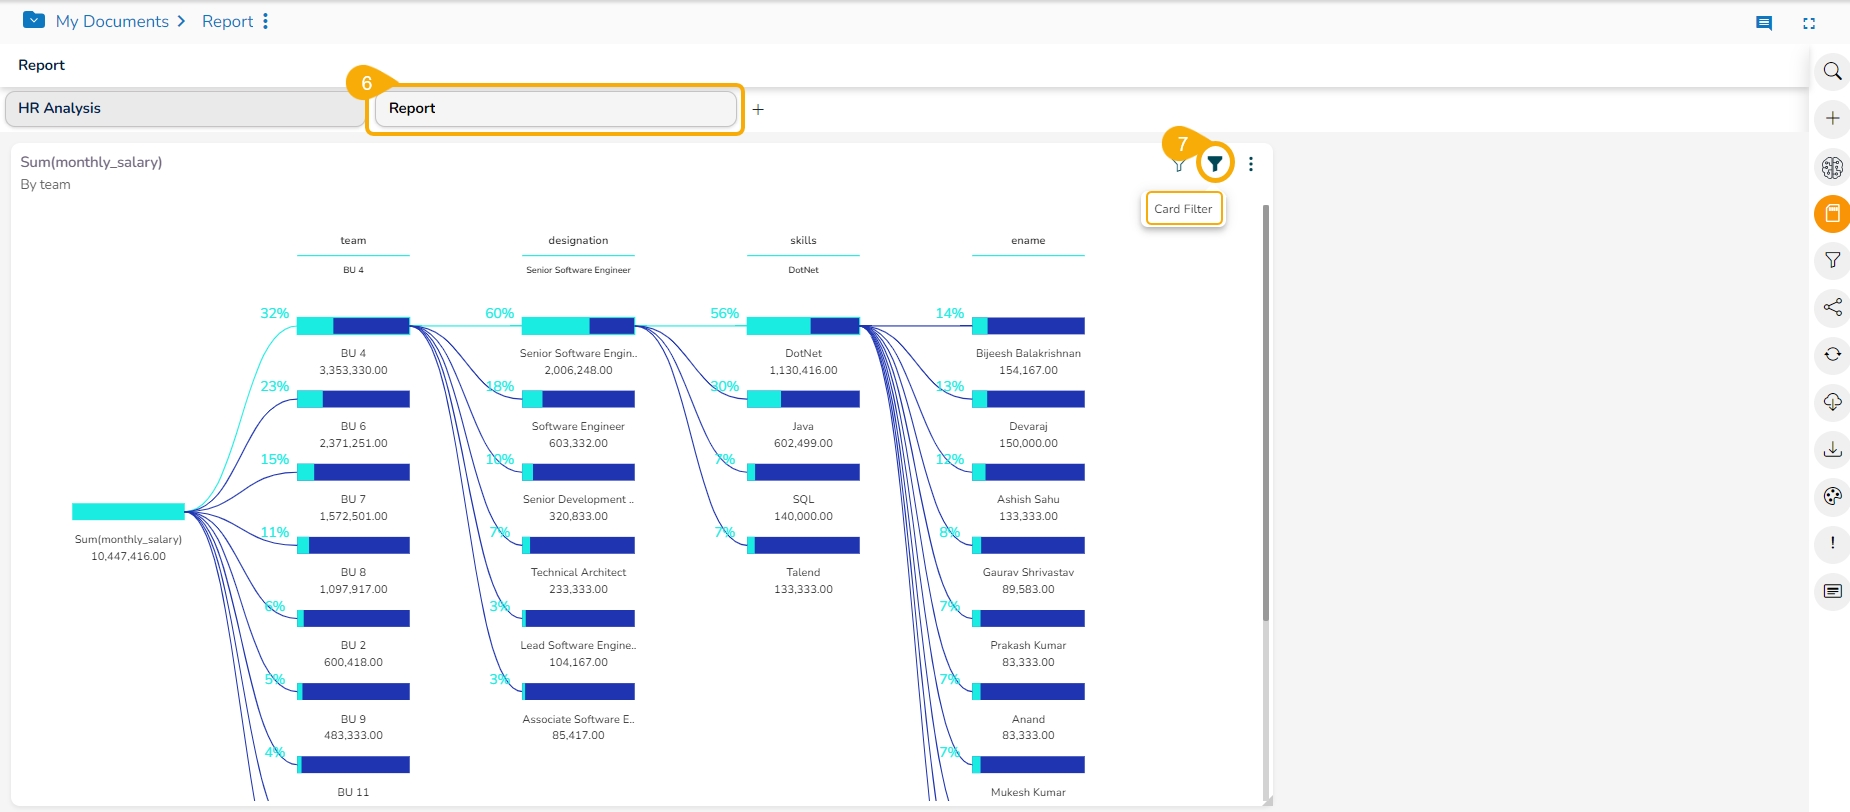
Access the View with the set View Filter from the final screen of the report.
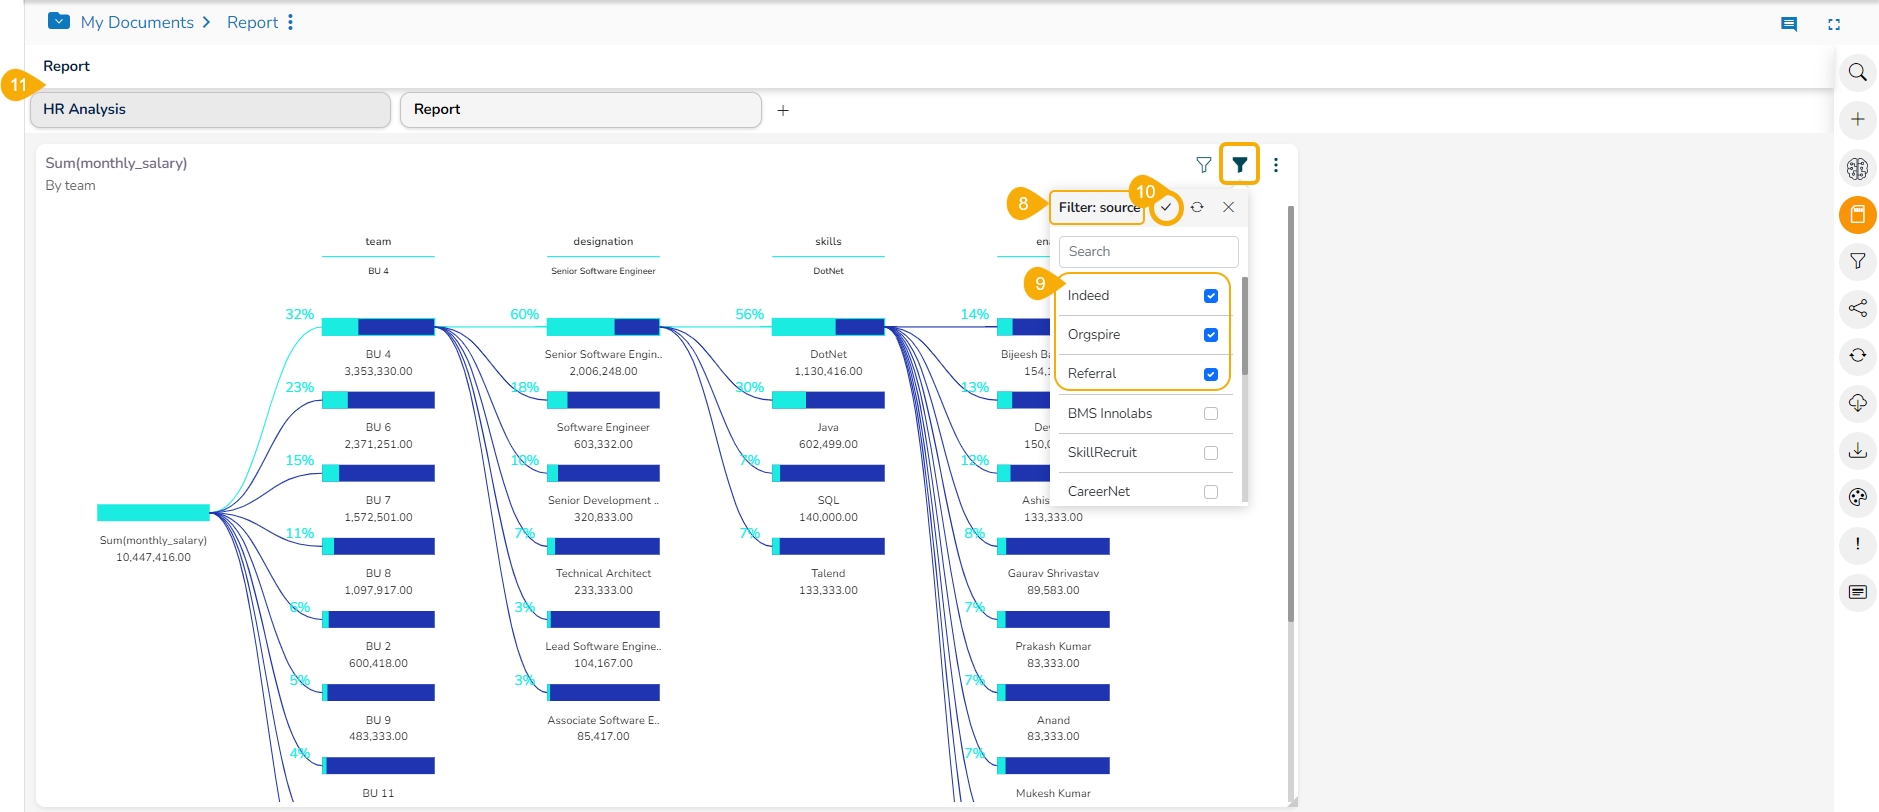
Click the Card Filter icon.
The selected View Filter option appears in the Card Filter context menu (In this case, it is 'Source').
Use the given check boxes to select various sources from the available list of the Source .
Click the Apply icon.
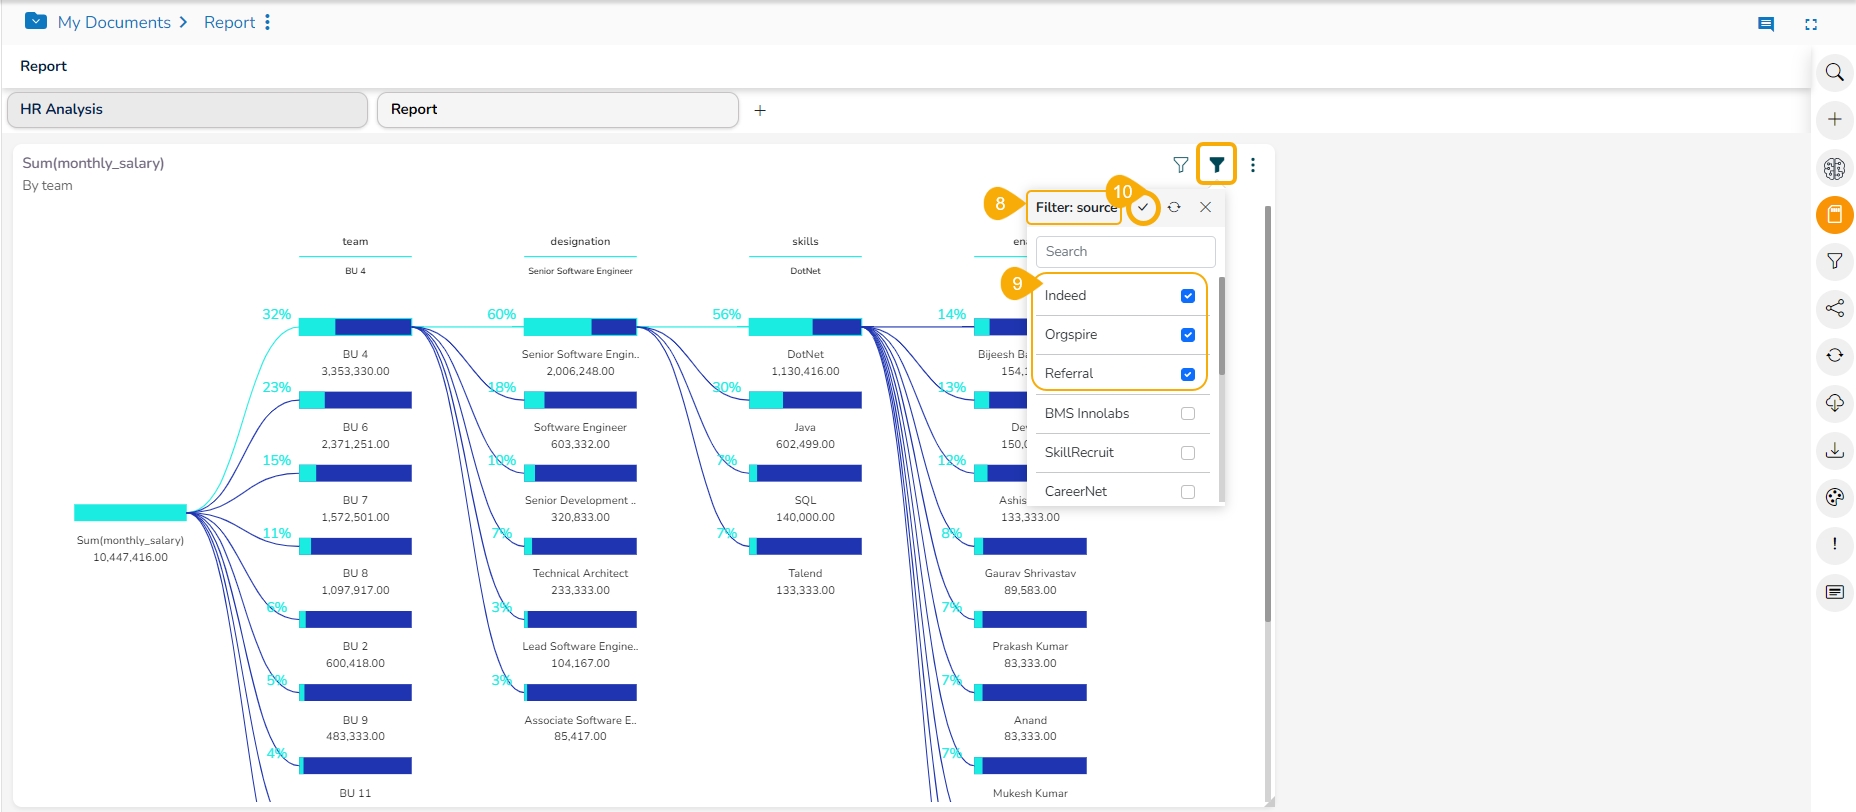
The concerned View gets customized as per the selected filter condition.
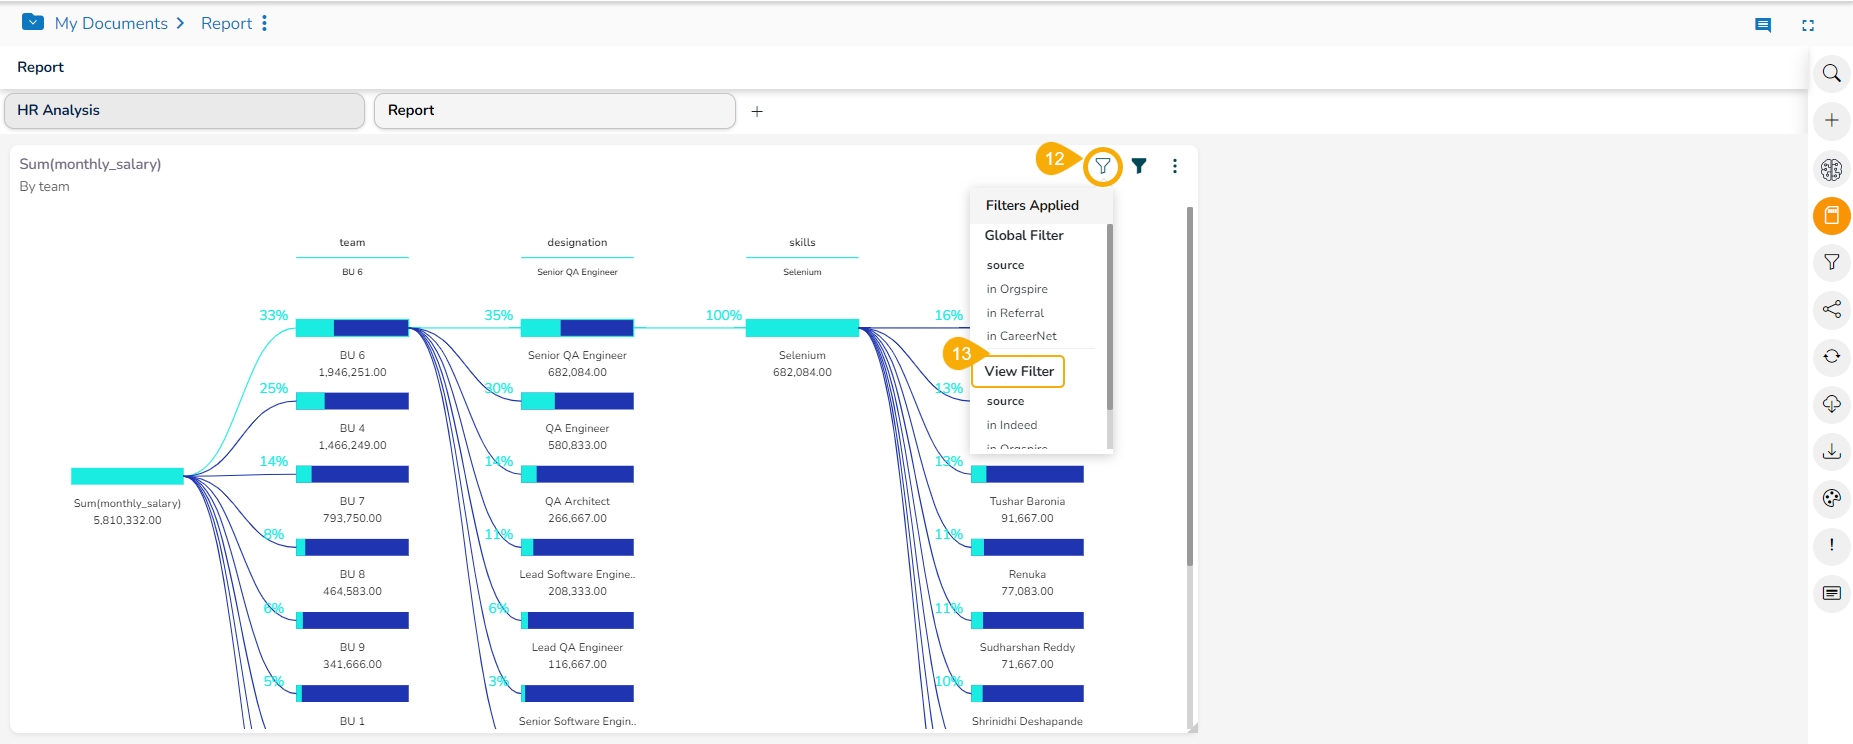
Click the Filters Applied icon.
A context window opens with the details of the applied View Filters options.
Editing the Customised View
Select a View with Custom View Filter from the final screen of the report.
Click the ellipsis icon.
Click Edit option for the same View from the selected Report.
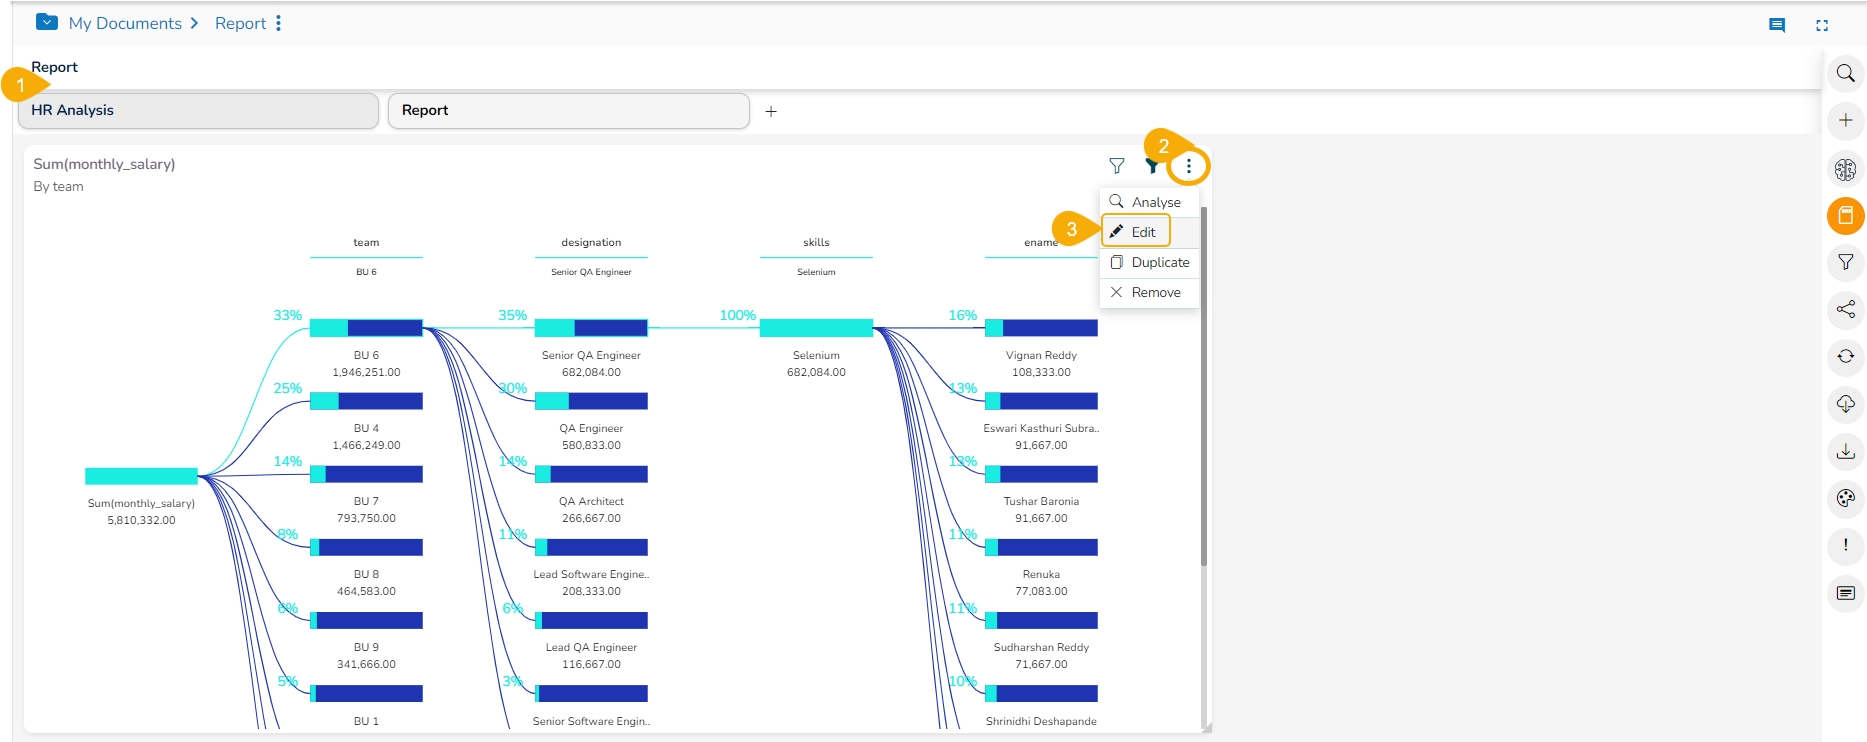
The view opens in the Design Workspace, the View Filter (Custom Filter) condition does not remain effective on the View when it opens in the design mode.
