Self-Service Visualization
  • What is a Report?
  • Creating a new Report
    • Accessing the Report Module
    • Create New Report
      • Creating a new Report with an Existing Data Store
        • Creating and Updating Instance
      • Creating a new Report by Uploading a File
        • Creating a new Report by Uploading a CSV File
        • Creating a new Report by Uploading an Excel File
      • Creating a new Report with Data Preparation
        • Create a Report with Data Preparation - Inside the Report UI
        • Create a Report with Data Preparation- Partly from the Data Center
    • Designing a View
    • Saving Multiple Views
  • Design Canvas
    • Dimension Profiling
    • View Measure Summary
    • Customize Category Color
    • Series Properties
    • Create Calculated Field
      • Creating a Formula
        • Record Level Formula
        • Summary Level Formula
      • Creating Range
    • Order by and Limit
    • Adding a Slicer
  • Chart Gallery
    • Mixed chart
    • Area chart
    • Bar chart
    • Bubble chart
    • Column Stack chart
    • Line chart
    • Pie chart
    • Scattered Plot chart
    • TreeMap chart
    • Circumplex chart
    • Pareto chart
    • Semi Gauge
    • KPI Tile
    • KPI Tile: Comparative Tile
    • KPI Tile: Sparkline
    • Map
    • Data Grid
    • Metric Summary
    • Dissolution/Decomposition chart
    • Spider chart
    • Waterfall chart
    • Funnel chart
    • Inverted Funnel chart
    • Heat Map chart
    • Geo chart
    • Sankey chart
    • Word Cloud
    • Candlestick chart
    • Benchmark Analysis
  • Report Final Screen
    • Tab
    • Search
    • Create a New ML View
    • Shared Views
    • Live Refresh
    • Export
      • Export Properties
    • Change Theme
    • Data Store Information
    • Options Assigned to a View
      • Analyse
        • Timeline Play
        • Data Drills
          • Drill Into
          • Drill Through
      • Editing a saved View
      • Duplicate
      • Remove
  • Applying Filters
    • View Specific Filter
      • Dimension-based View Filter
      • Measure-based View Filter
      • Date-based View Filter
    • Global Filter
      • Exclude from the Global Filter
      • Saving a Global Filter
      • Custom View Filter
      • LOV Settings
  • Interactions
Powered by GitBook
On this page
Export as PDF
  1. Design Canvas
  2. Create Calculated Field
  3. Creating a Formula

Record Level Formula

This page describes Record Level Formula field as Dimension and Measure in a Report.

PreviousCreating a FormulaNextSummary Level Formula
How to access the Formula Field option?

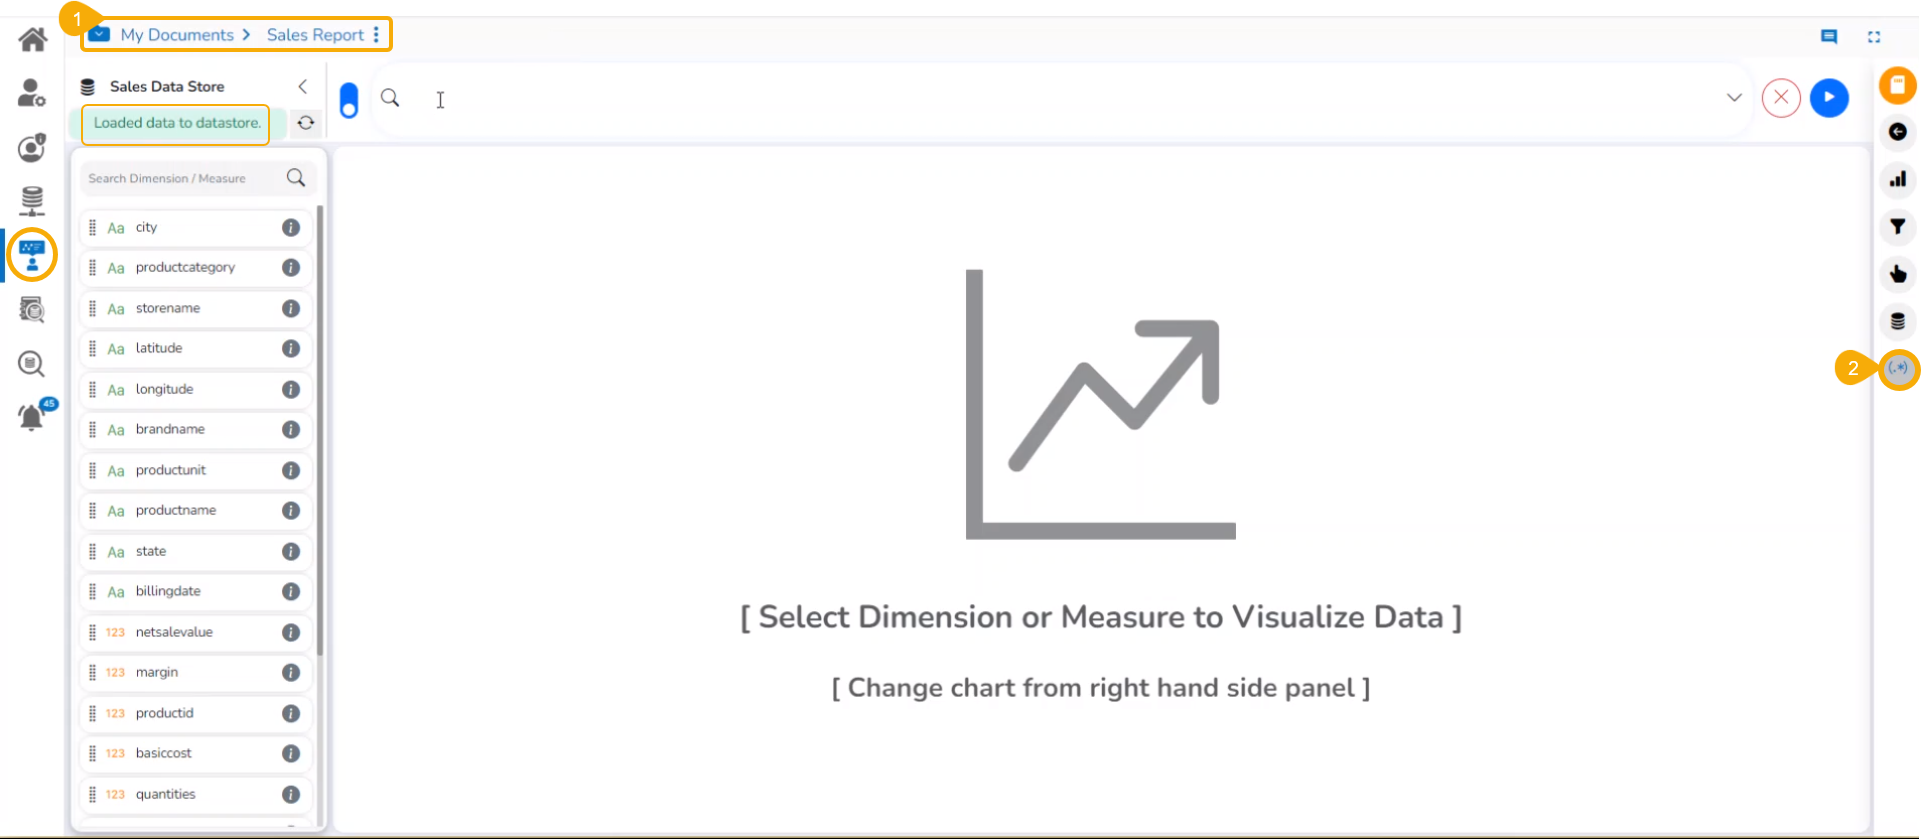
The users can access the icon to of the Create Calculated Fields from the right-side panel of the Design page.

Please Note: The user can set the database settings using the option provided under the Configuration part of the Administration module.

Check out the given walk-through on creating a formula field at the record level.

  • Navigate to the Design tab after selecting a Data Store to design a new view.

  • Click the Create Calculated field icon.

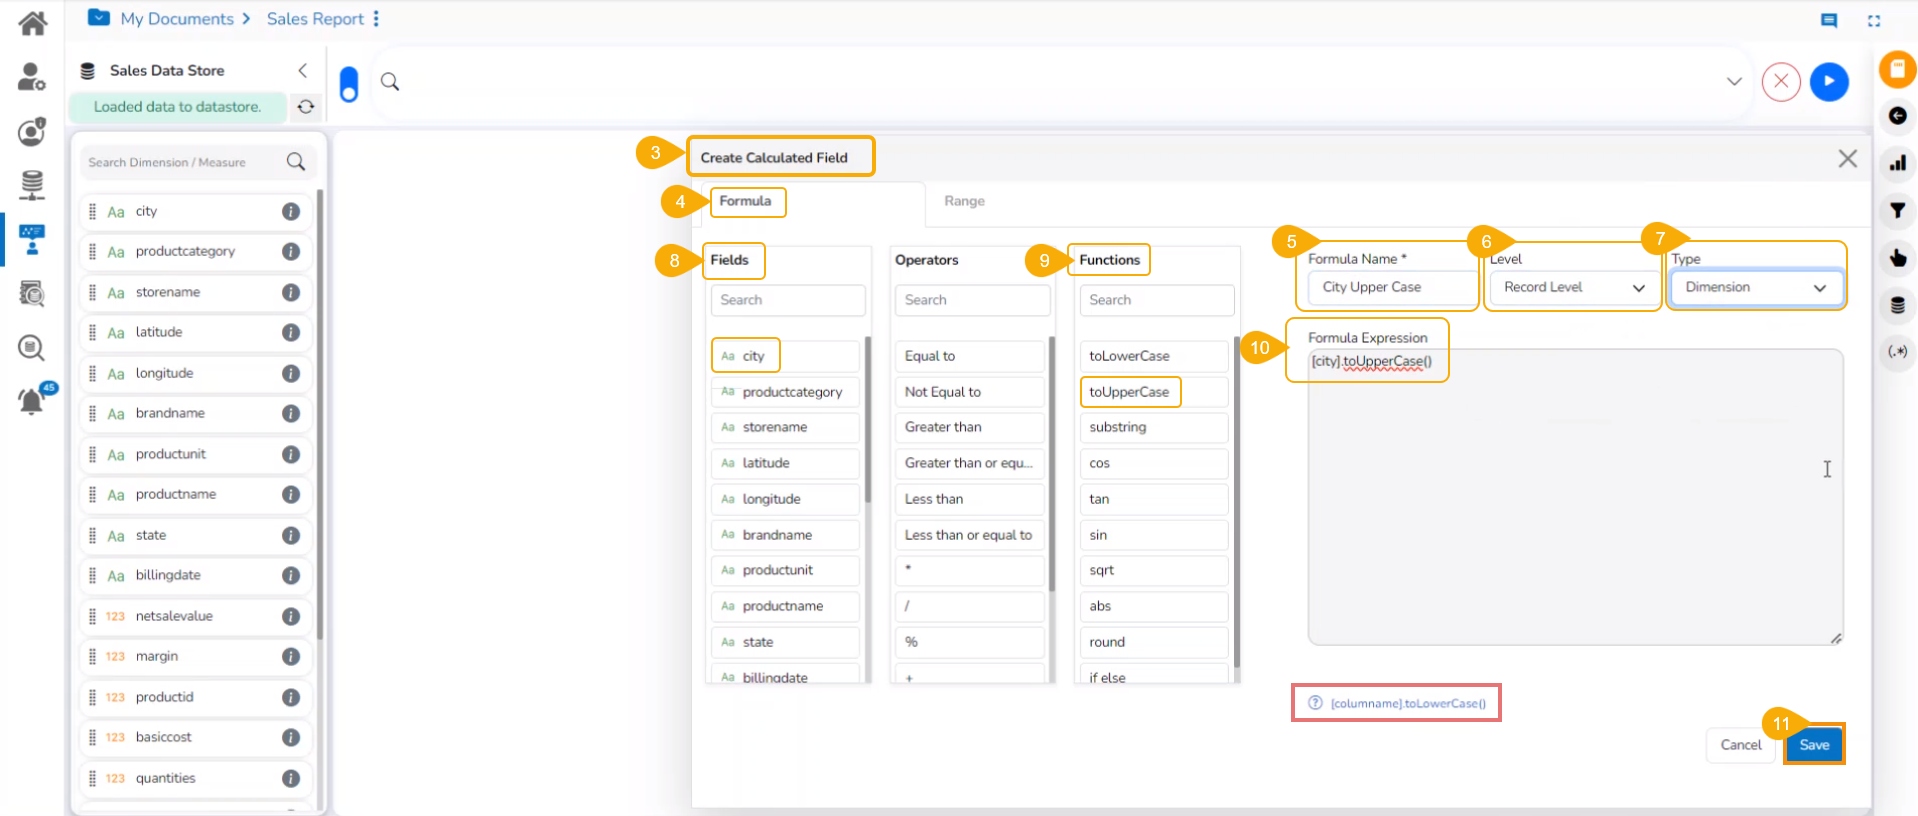
  • The user gets redirected to the Create Calculated Field window.

  • Please navigate to the FORMULA tab (It opens by default).

  • Formula Name: Give a title to the formula field.

  • Level: The user can create the calculated field at two levels.

    • Record Level

    • Summary Level

  • Type: Select an option from the drop-down menu to decide the kind of the Formula Field.

    • Dimension

    • Measure

  • Fields: All fields from the selected Data Store list are in this window. The users can select the required fields by tapping on them.

  • Functions: All the available functions are listed in this window. The users can select the required functions to apply them to the chosen field.

  • Formula Expression: Based on the selected combination of Fields with Operators or Functions the Formula Expression is entered in this space.

  • Click the Save option to save the formula field or calculated field.

Please Note: The users can select the required operator to add and complete the formula for a Measure column.

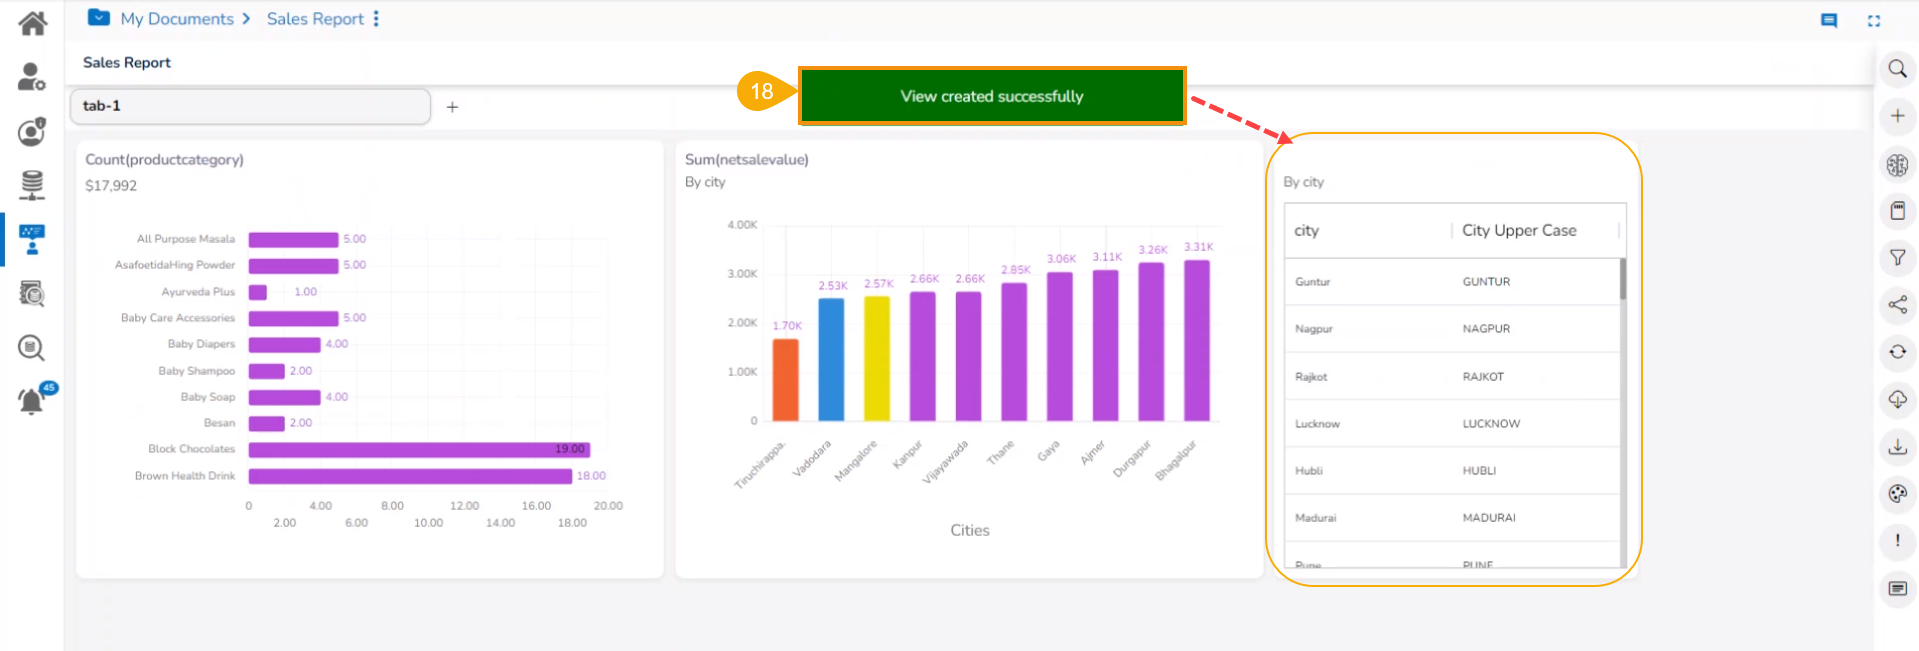
  • A notification message appears to ensure that the Formula Field gets created.

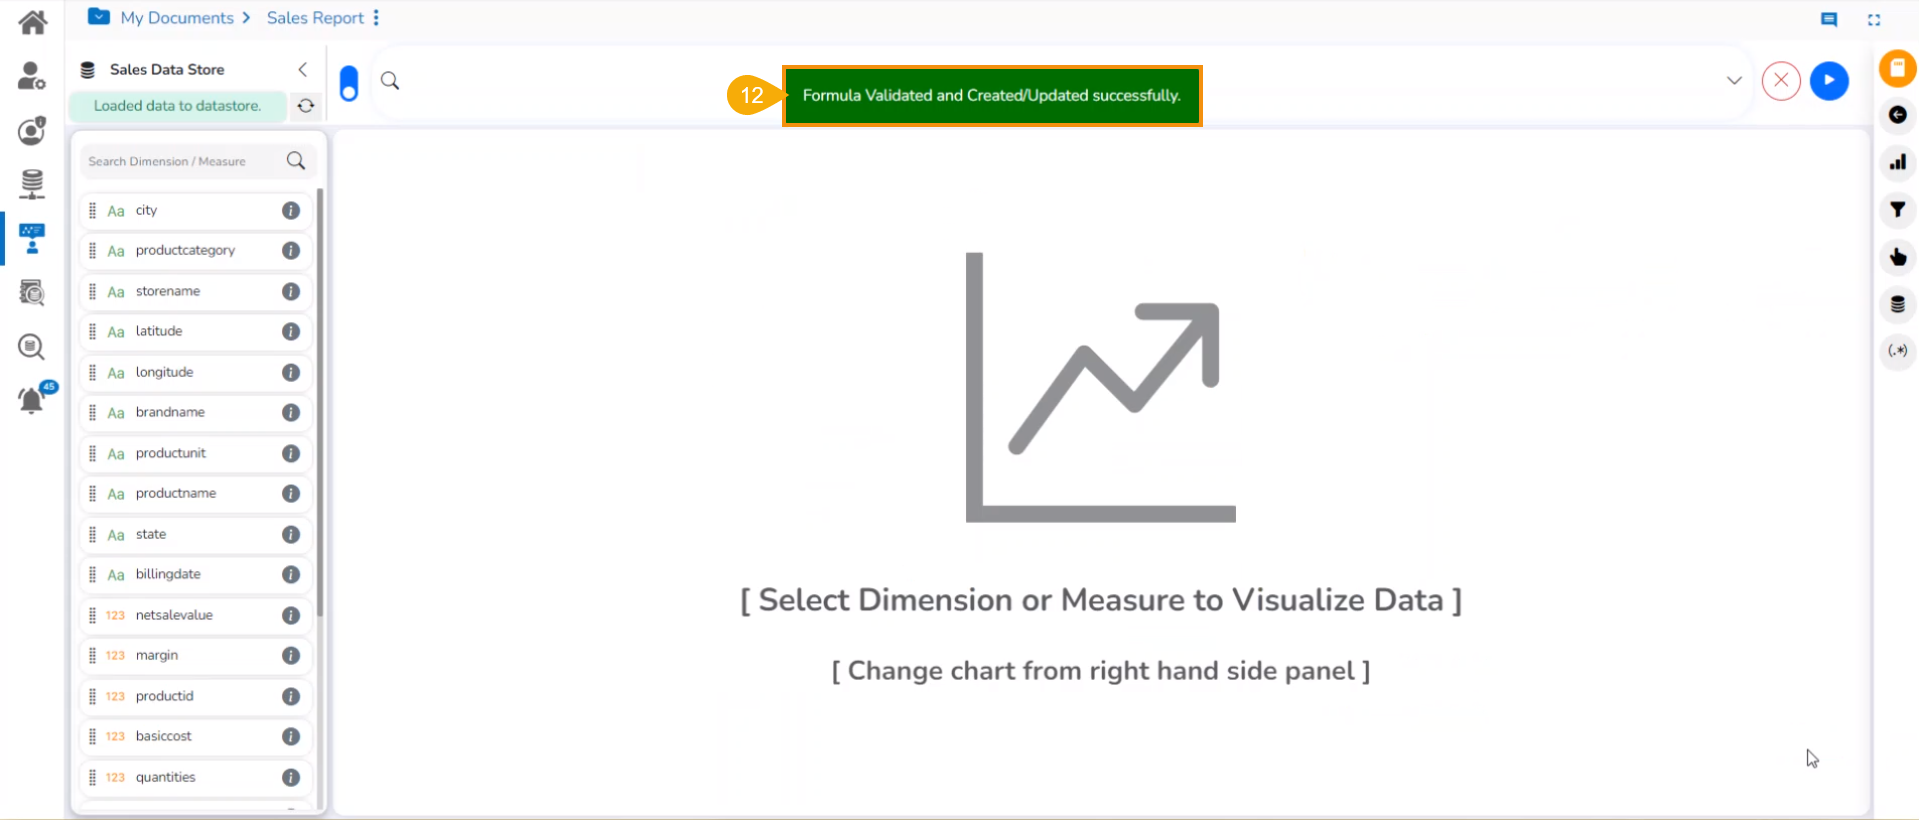
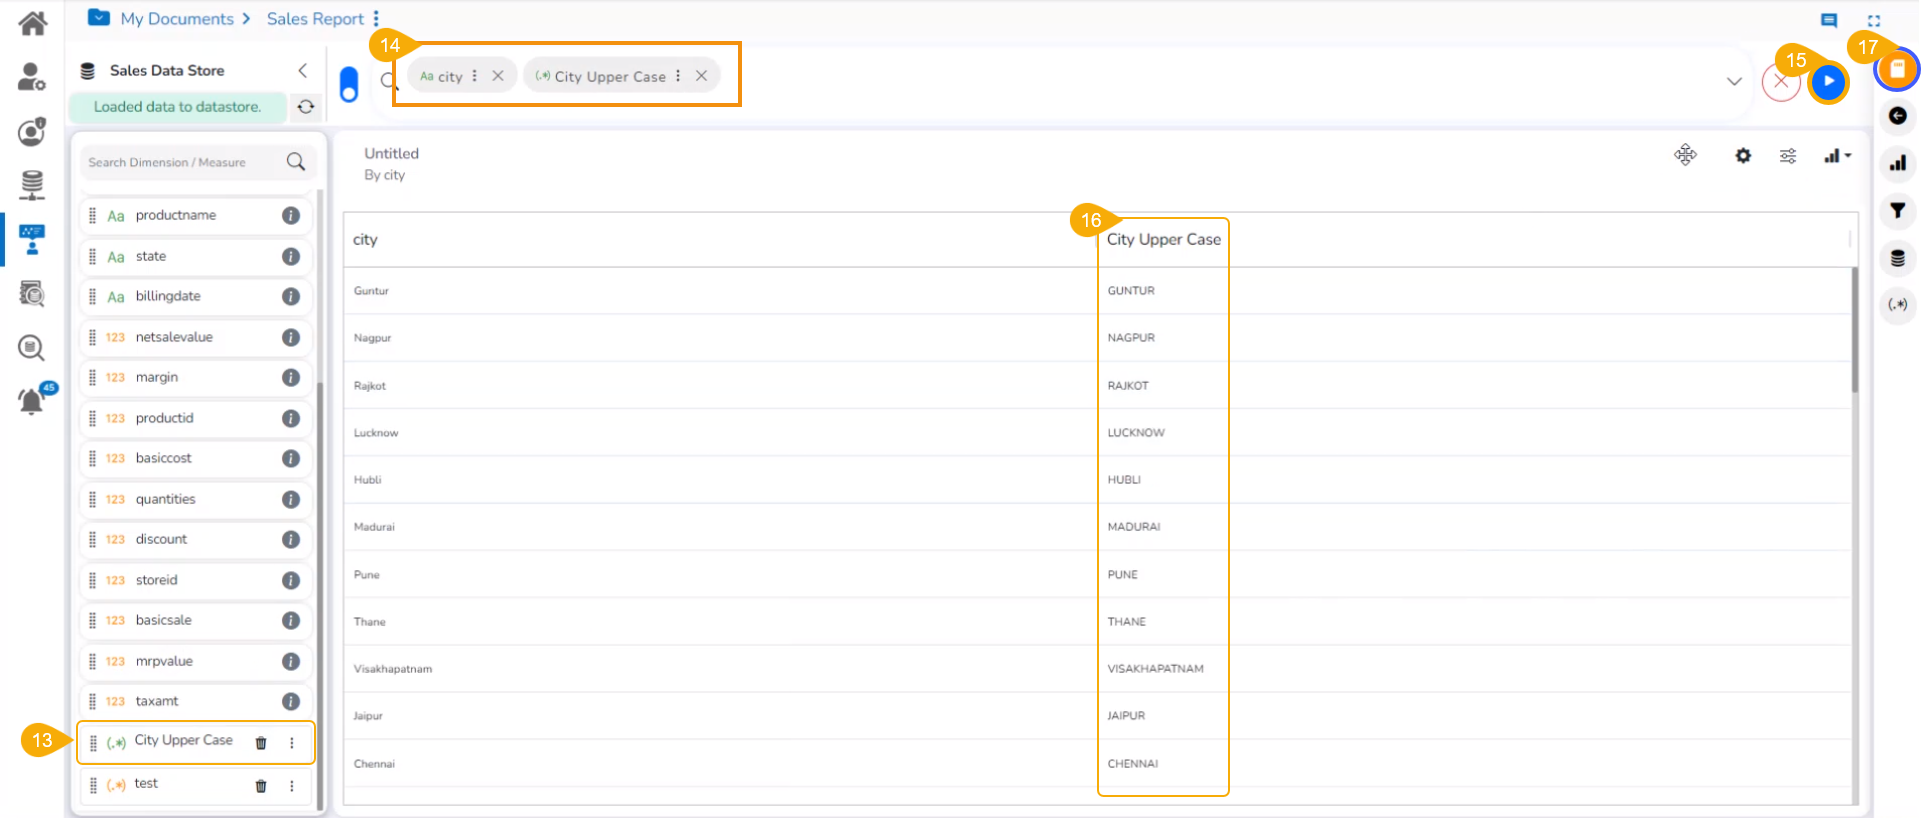
  • The newly created formula field gets added to the selected Data Store.

  • Select the formula column name to get it in the top panel.

  • Click the GO option.

  • The column data is displayed in the Upper case.

  • Click the Save View icon to save the View to the Report.

  • A notification appears and the user gets redirected to the final screen of the Report with the View added to it.

Creating a Calculated Fields as Measure

Please Note:

  • The Formula Fields created with the Record Level option can be saved as either Dimension or Measure. Based on the selected option for the Type, the displayed Fields may vary in the right-side panel.

  • Double click on the Functions or Operators from the Formula Field Editor where the MongoDB server is configured in the Admin Settings as it generates one expression. The tan function does not support the MongoDB server.

Data Store Settings
Creating a Dimension using the Record Level Formula Functionality
Measure as Calculation Field
Accessing the Create Calculated Field option on the Design page
Creating a Formula Expression