Self-Service Visualization
  • What is a Report?
  • Creating a new Report
    • Accessing the Report Module
    • Create New Report
      • Creating a new Report with an Existing Data Store
        • Creating and Updating Instance
      • Creating a new Report by Uploading a File
        • Creating a new Report by Uploading a CSV File
        • Creating a new Report by Uploading an Excel File
      • Creating a new Report with Data Preparation
        • Create a Report with Data Preparation - Inside the Report UI
        • Create a Report with Data Preparation- Partly from the Data Center
    • Designing a View
    • Saving Multiple Views
  • Design Canvas
    • Dimension Profiling
    • View Measure Summary
    • Customize Category Color
    • Series Properties
    • Create Calculated Field
      • Creating a Formula
        • Record Level Formula
        • Summary Level Formula
      • Creating Range
    • Order by and Limit
    • Adding a Slicer
  • Chart Gallery
    • Mixed chart
    • Area chart
    • Bar chart
    • Bubble chart
    • Column Stack chart
    • Line chart
    • Pie chart
    • Scattered Plot chart
    • TreeMap chart
    • Circumplex chart
    • Pareto chart
    • Semi Gauge
    • KPI Tile
    • KPI Tile: Comparative Tile
    • KPI Tile: Sparkline
    • Map
    • Data Grid
    • Metric Summary
    • Dissolution/Decomposition chart
    • Spider chart
    • Waterfall chart
    • Funnel chart
    • Inverted Funnel chart
    • Heat Map chart
    • Geo chart
    • Sankey chart
    • Word Cloud
    • Candlestick chart
    • Benchmark Analysis
  • Report Final Screen
    • Tab
    • Search
    • Create a New ML View
    • Shared Views
    • Live Refresh
    • Export
      • Export Properties
    • Change Theme
    • Data Store Information
    • Options Assigned to a View
      • Analyse
        • Timeline Play
        • Data Drills
          • Drill Into
          • Drill Through
      • Editing a saved View
      • Duplicate
      • Remove
  • Applying Filters
    • View Specific Filter
      • Dimension-based View Filter
      • Measure-based View Filter
      • Date-based View Filter
    • Global Filter
      • Exclude from the Global Filter
      • Saving a Global Filter
      • Custom View Filter
      • LOV Settings
  • Interactions
Powered by GitBook
On this page
Export as PDF
  1. Creating a new Report
  2. Create New Report
  3. Creating a new Report with Data Preparation

Create a Report with Data Preparation - Inside the Report UI

Create a new Report by implementing the Data Preparation steps to an uploaded file using the Report UI.

PreviousCreating a new Report with Data PreparationNextCreate a Report with Data Preparation- Partly from the Data Center

Check out the given walk-through to create a new report on top of an uploaded file that contains Data Preparation steps.

Please follow the below-given steps to create a new report based on an uploaded file containing the Data Preparation Steps:

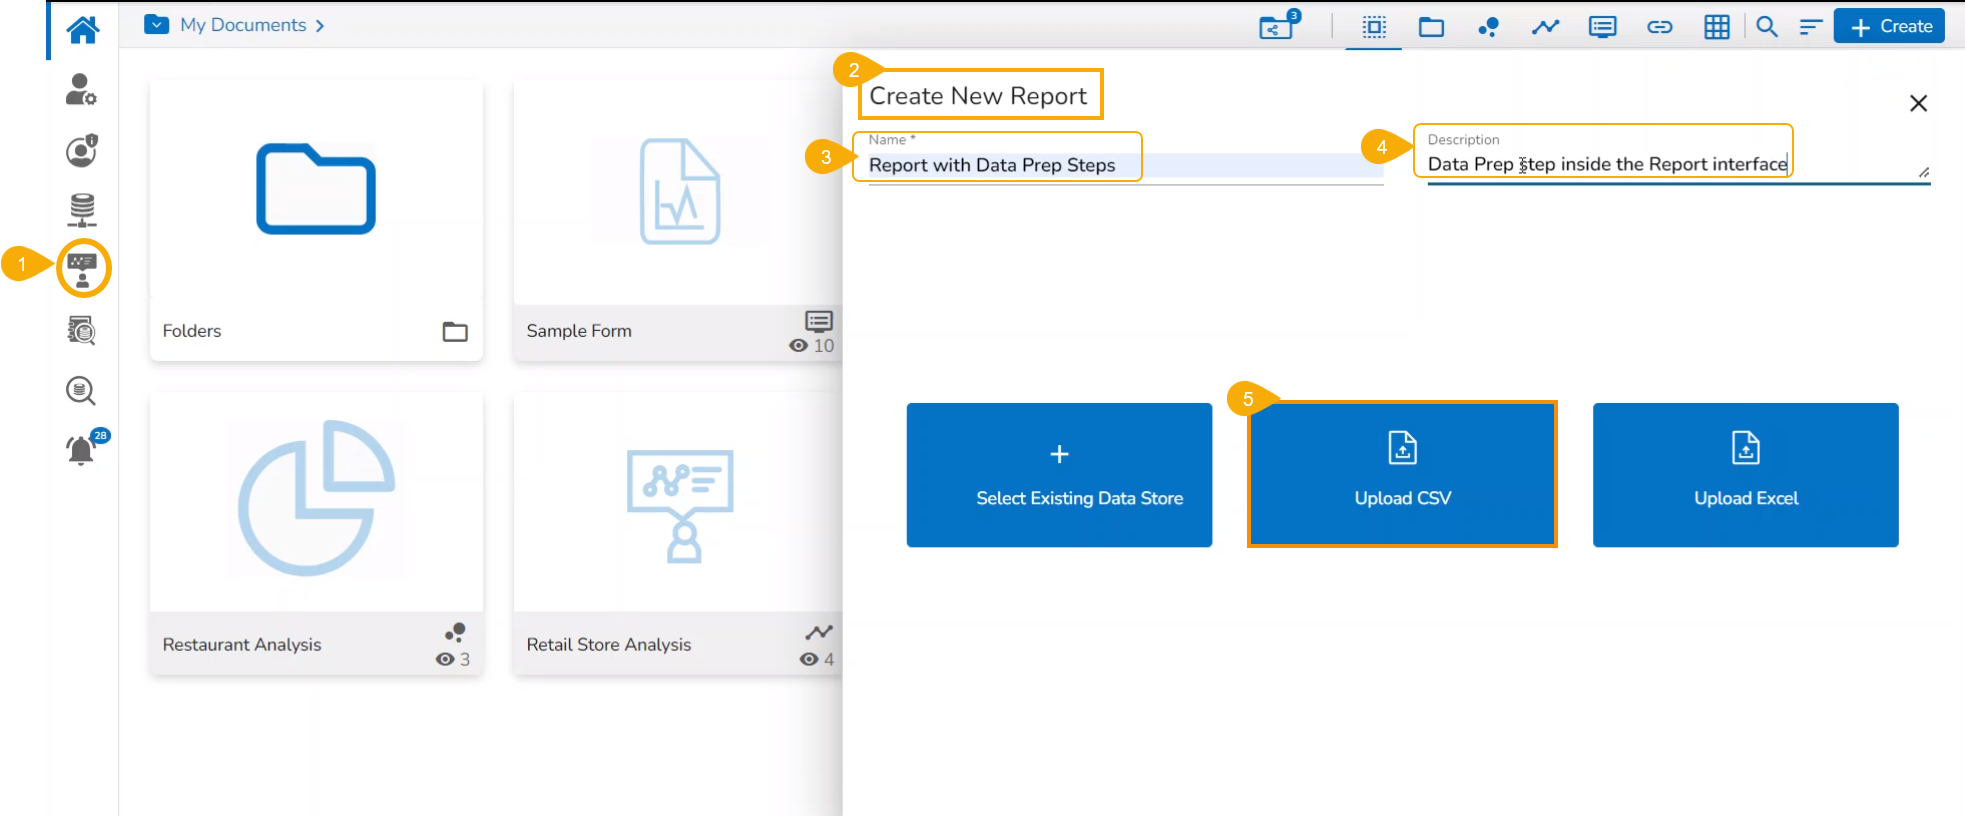
  • Click the Report icon or Create a Report option from the Platform homepage.

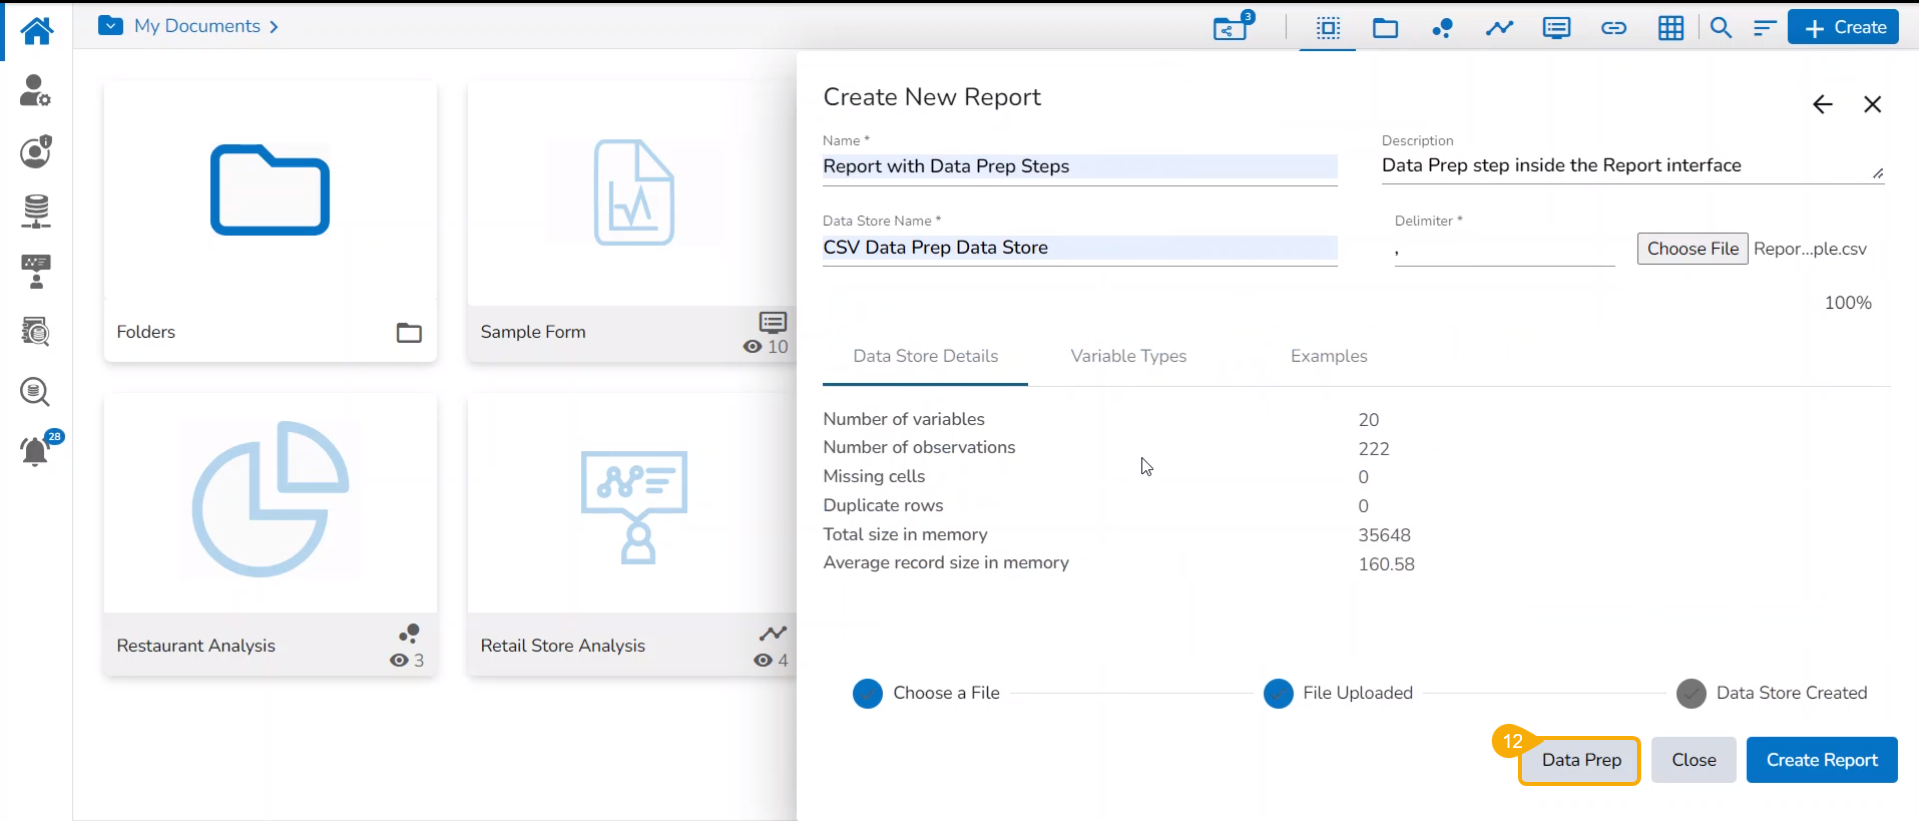
  • The Create New Report dialog box opens.

  • Provide the name of the Report.

  • Describe the Report.

  • Click the Upload CSV option to upload a CSV file.

  • Provide a name for the Datastore.

  • Click the Choose File option to select and upload a file from the local system.

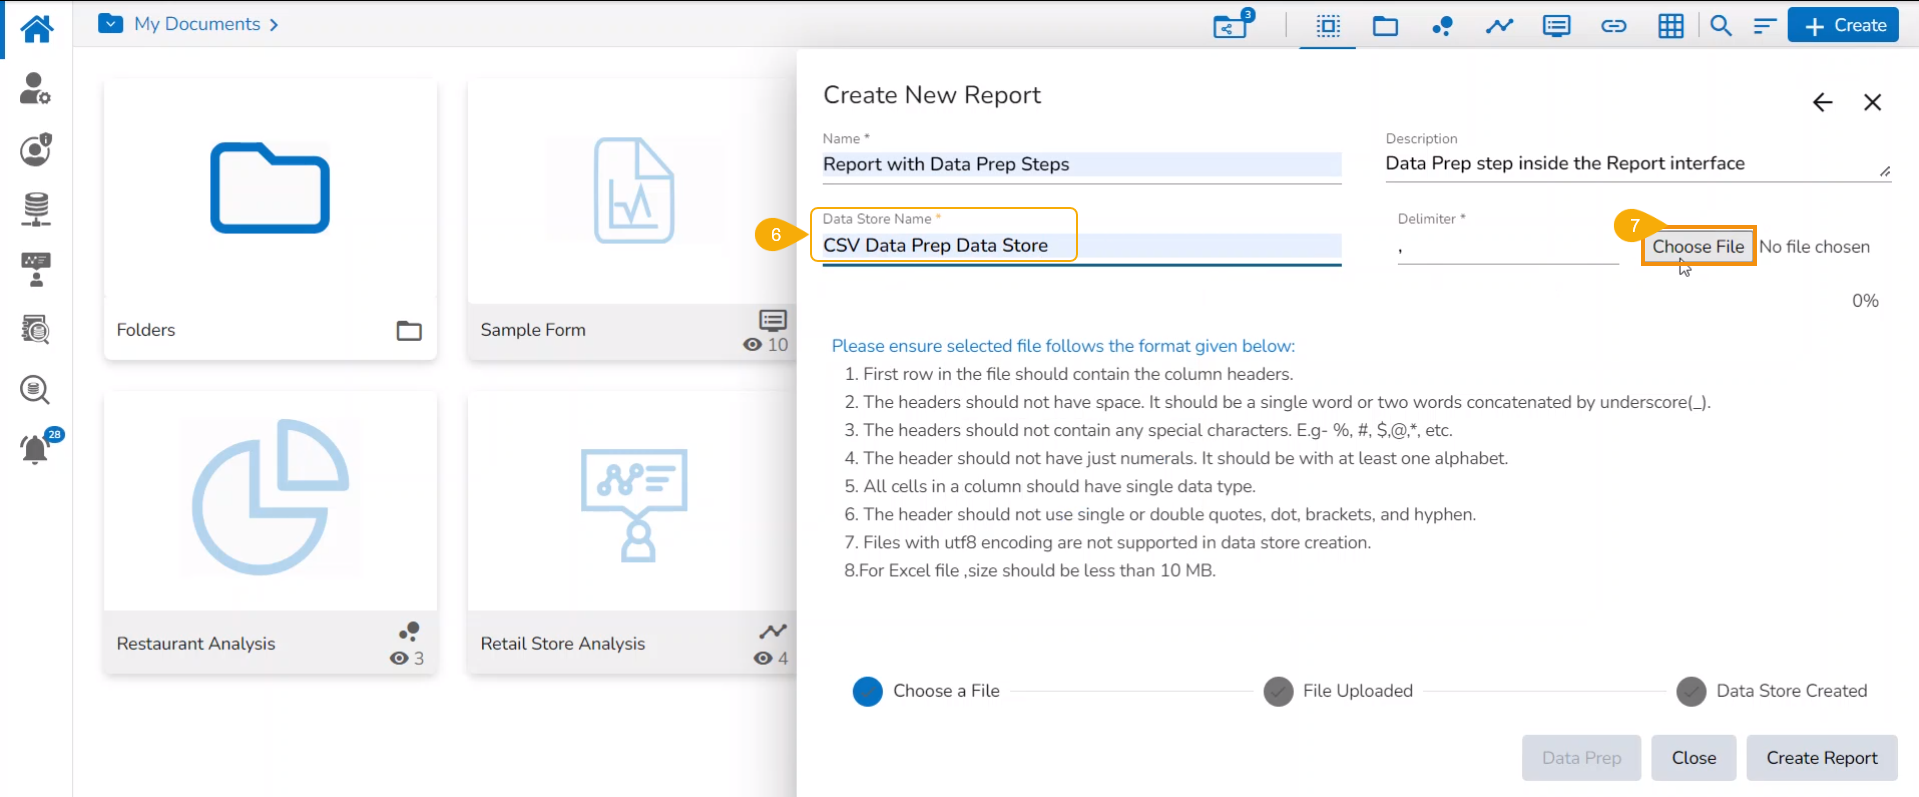
Please Note: After selecting the Upload CSV file a field to mention the delimiter appears on the Create New Report page.

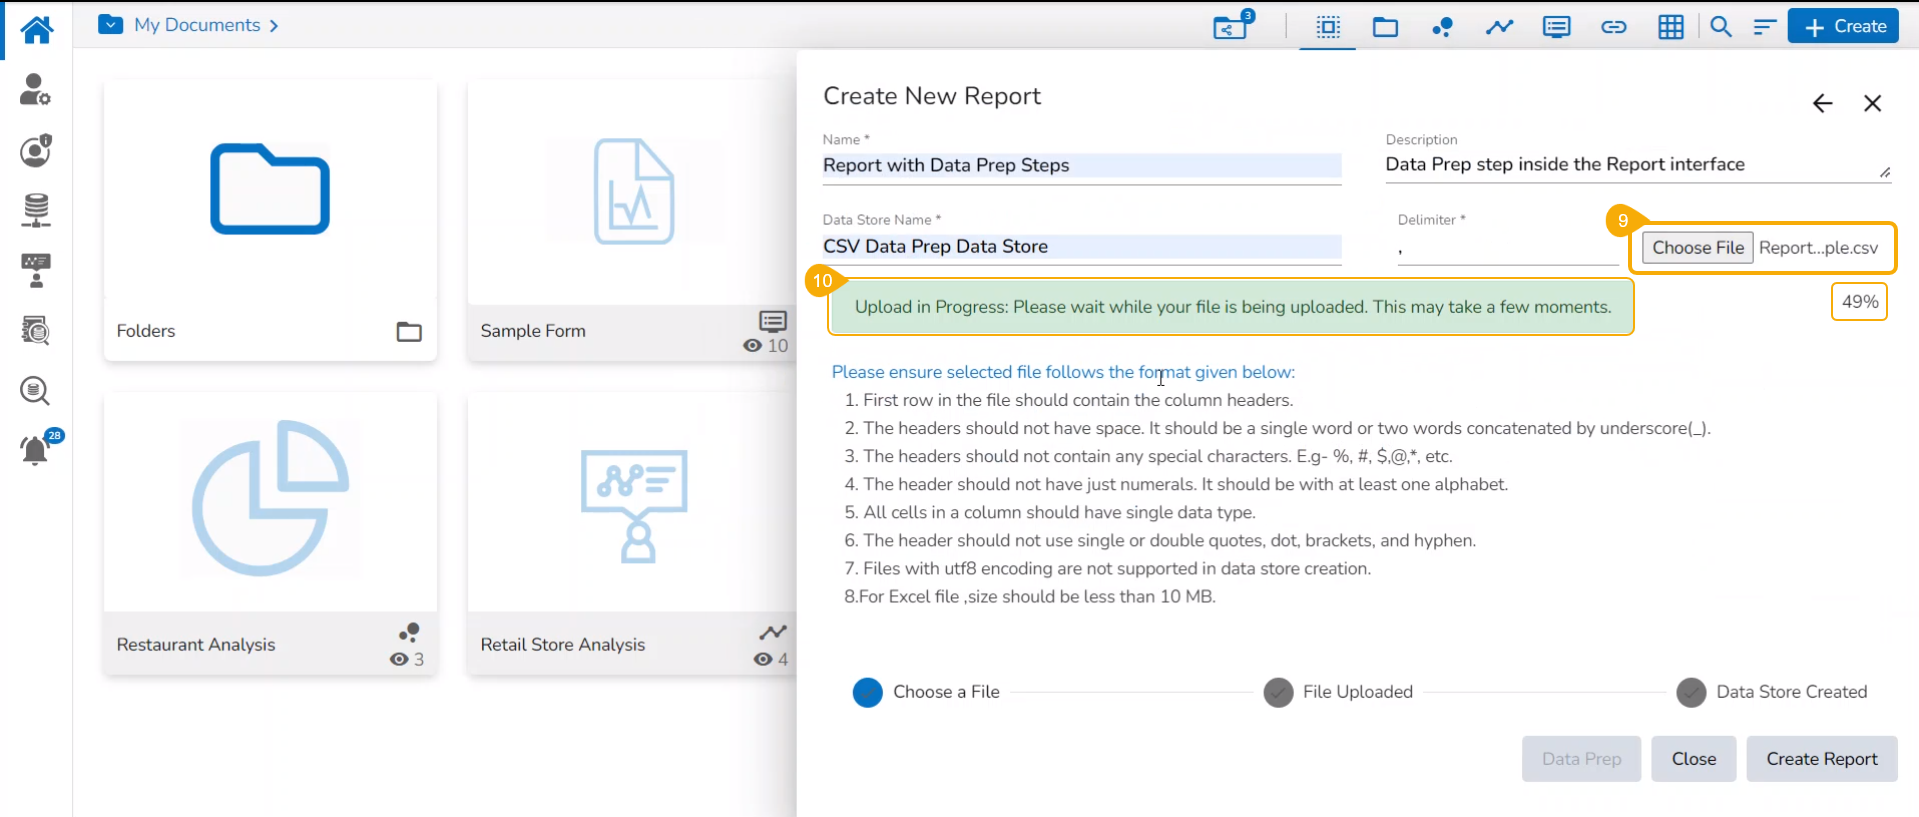
  • The selected file's name appears next to the Choose File option.

  • A notification flashes to inform you that uploading the selected file may take a few moments.

  • A notification message appears to ensure that the file is successfully uploaded.

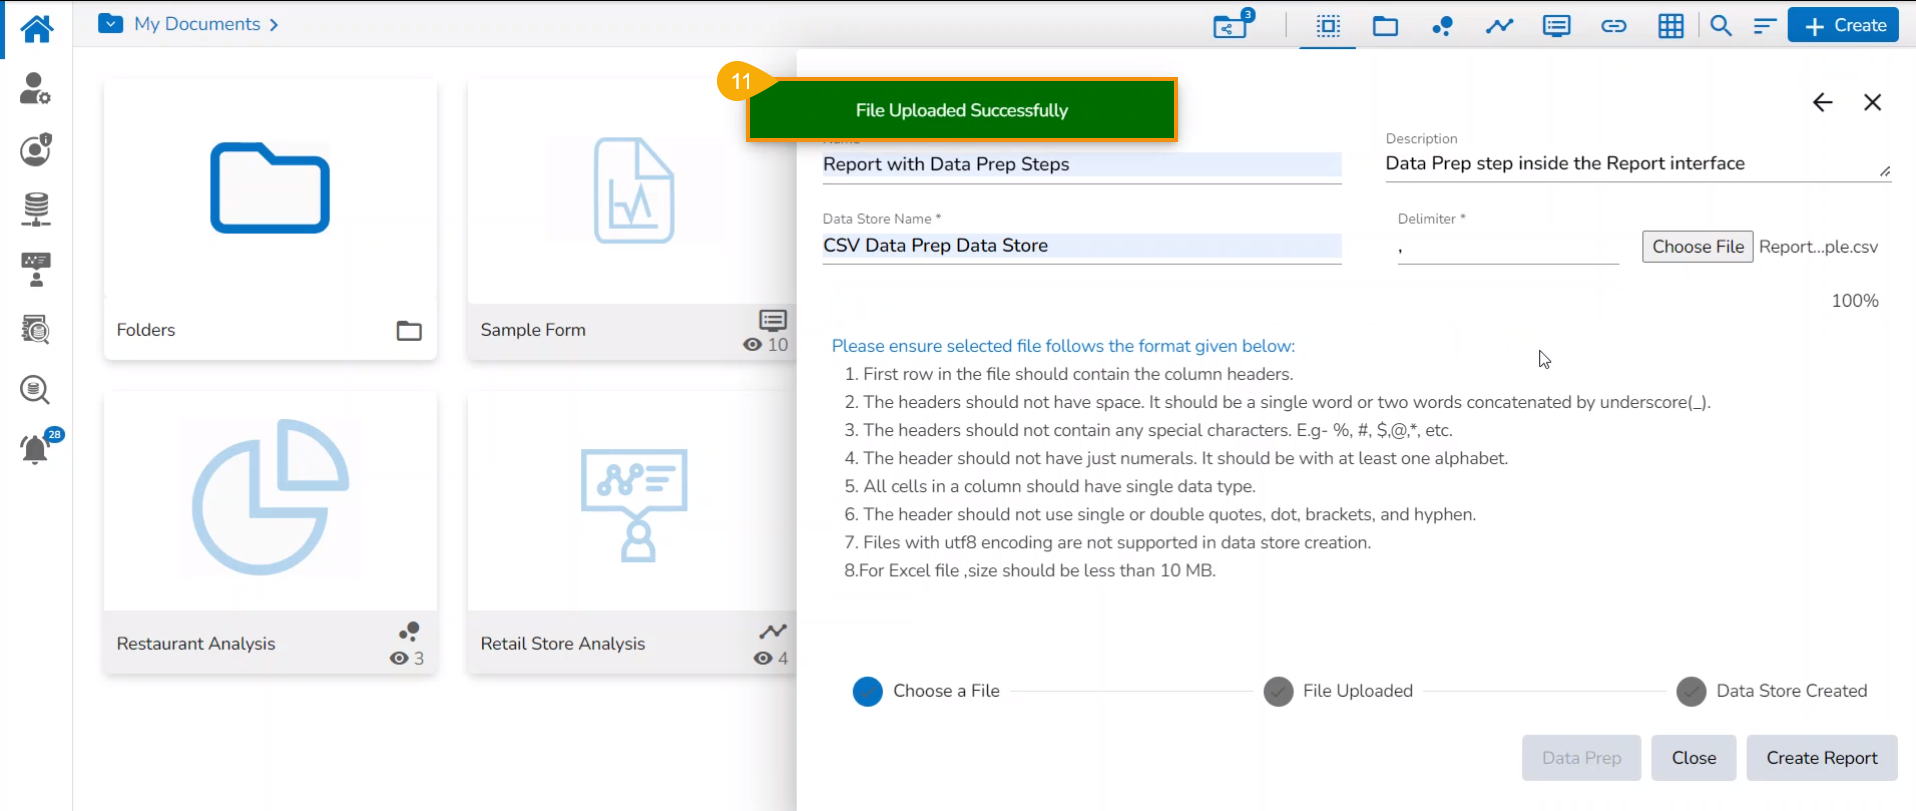
  • Click the Data Prep option provided at the bottom of the page.

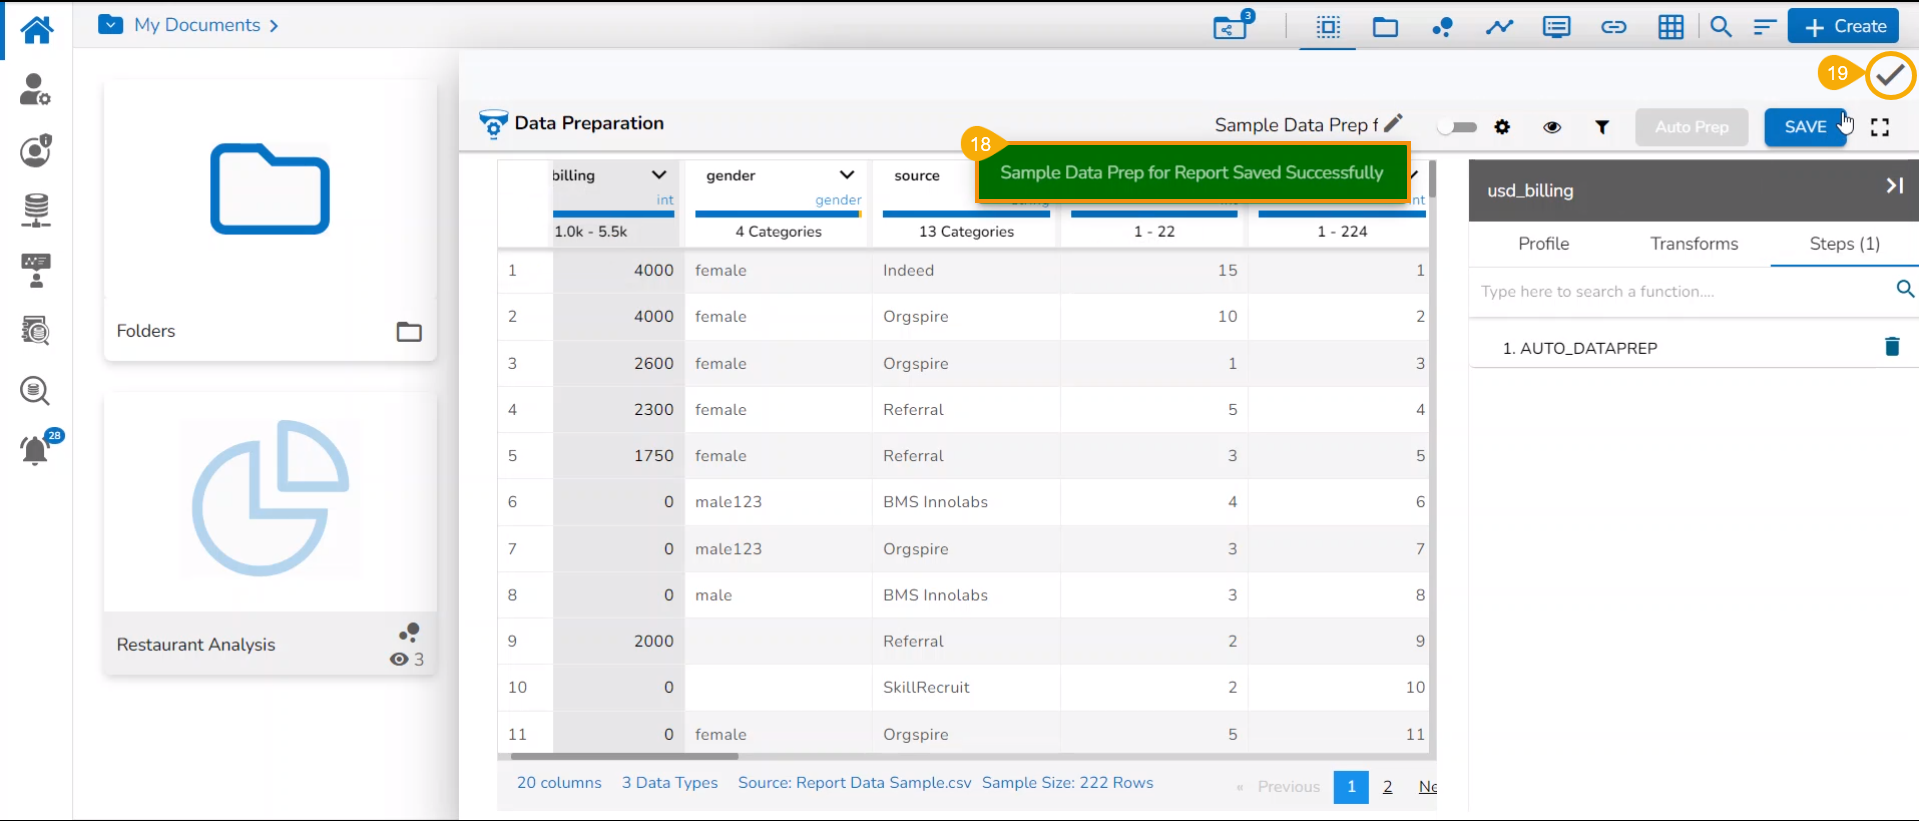
  • The data of the selected CSV file opens in the Data Grid format under the Data Preparation framework.

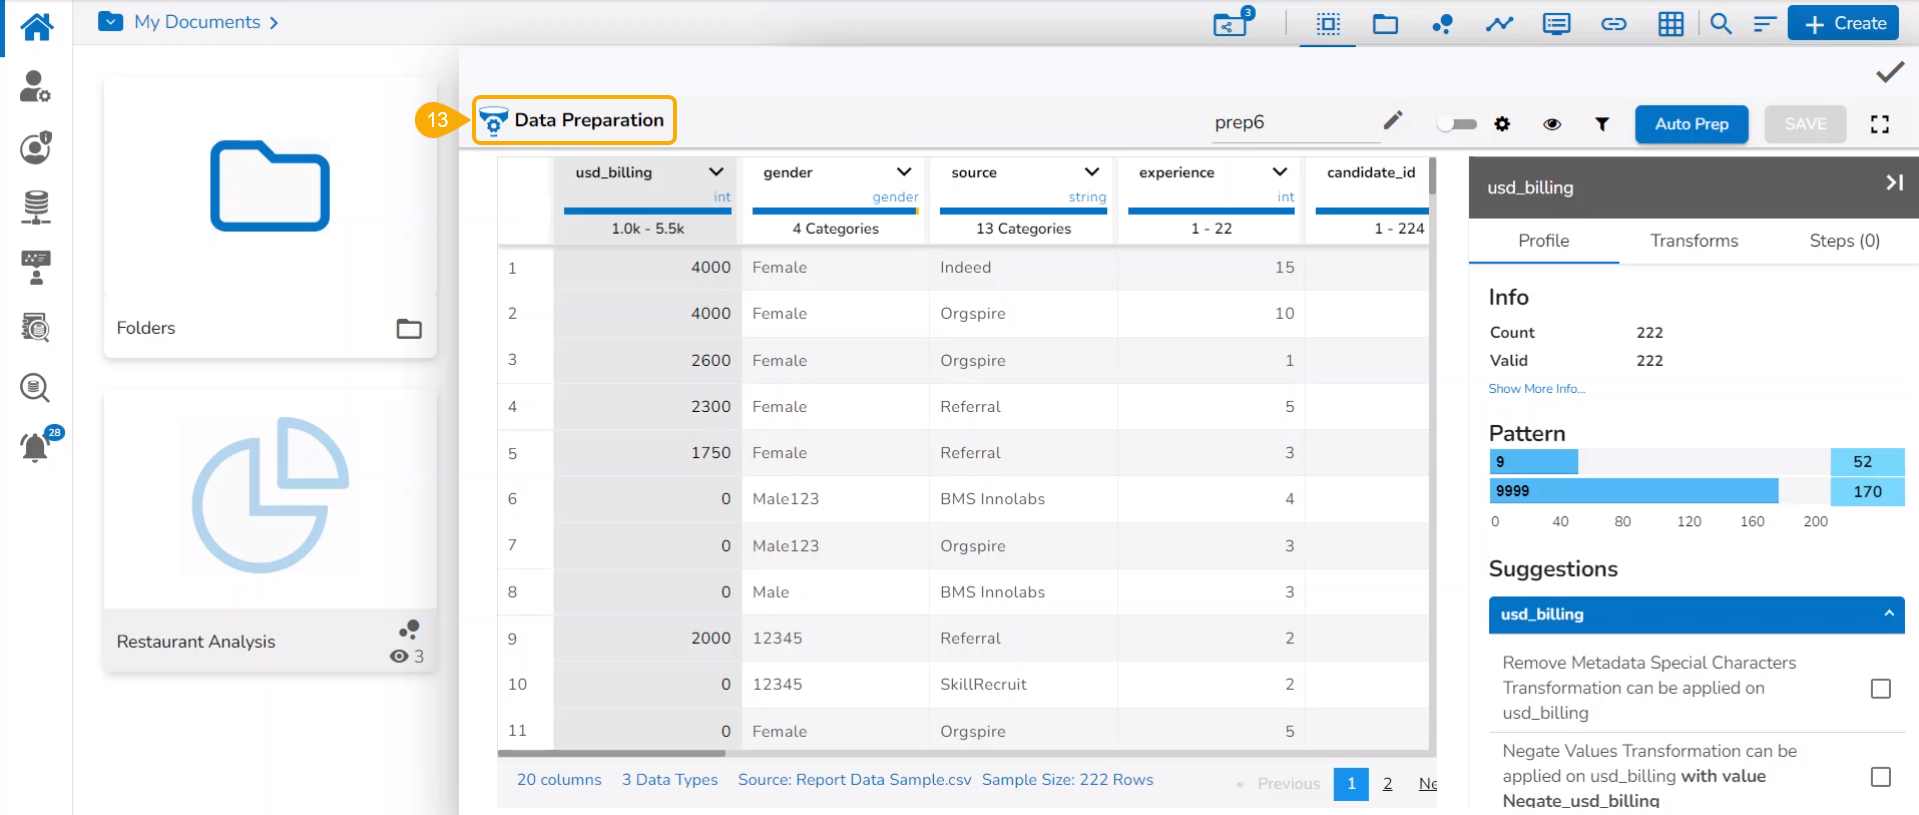
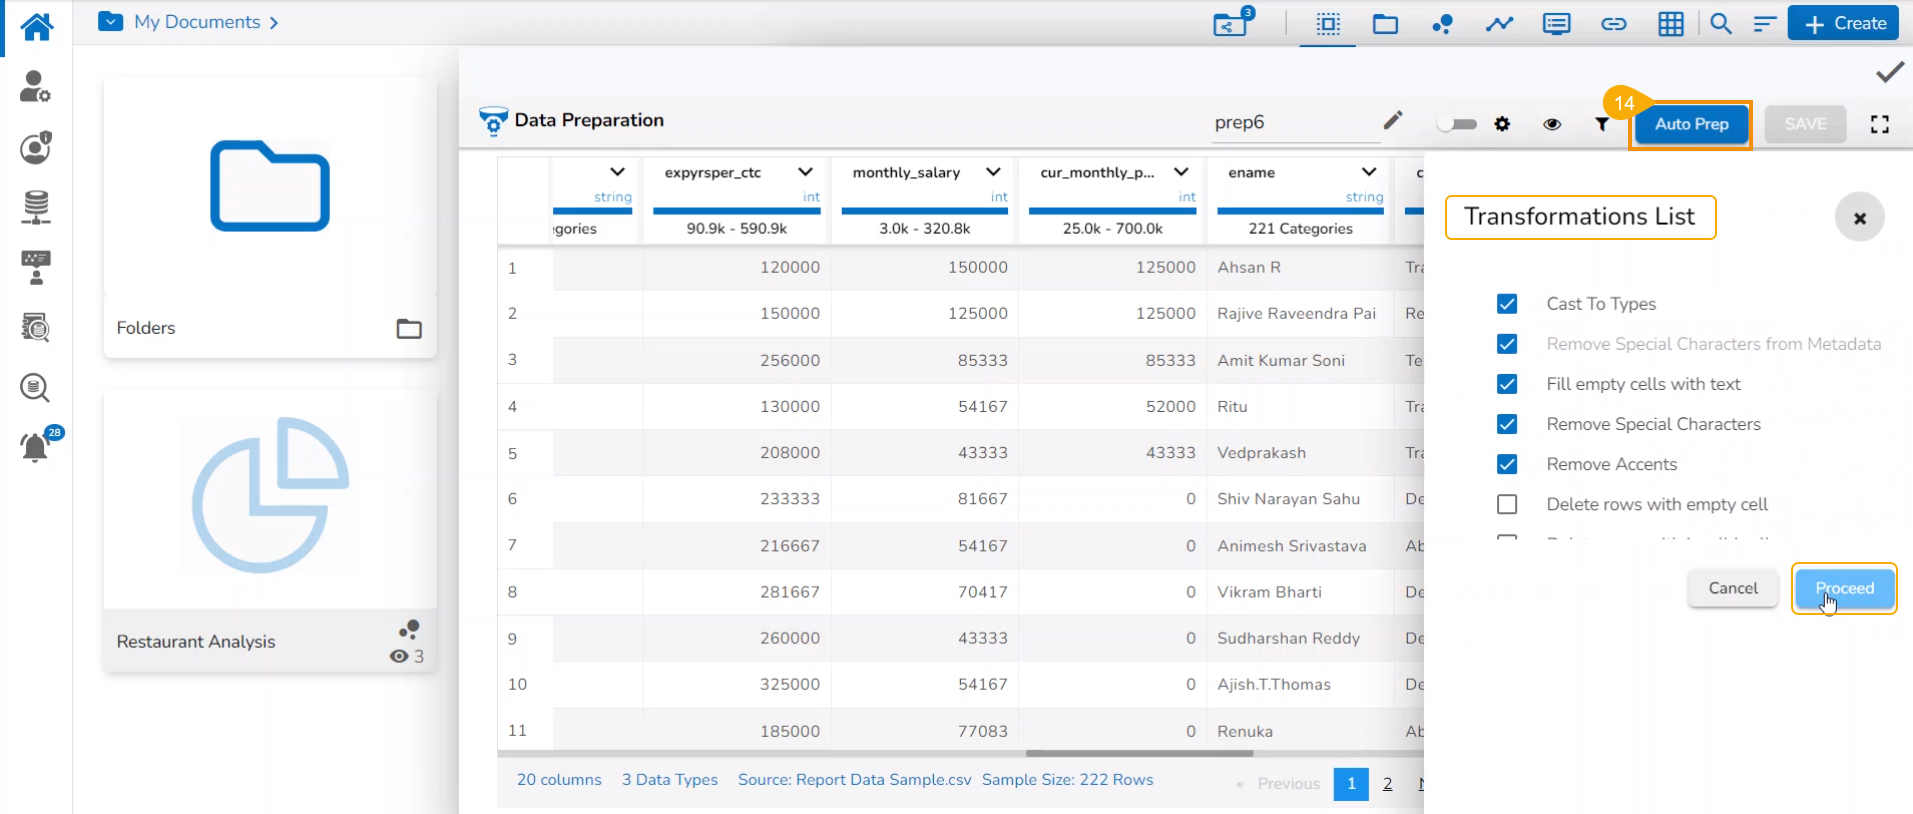
  • Apply the required Transforms. or Click the Auto Prep option to apply the auto-mated transforms to the selected data (In the below-given image the Auto Prep option has been chosen).

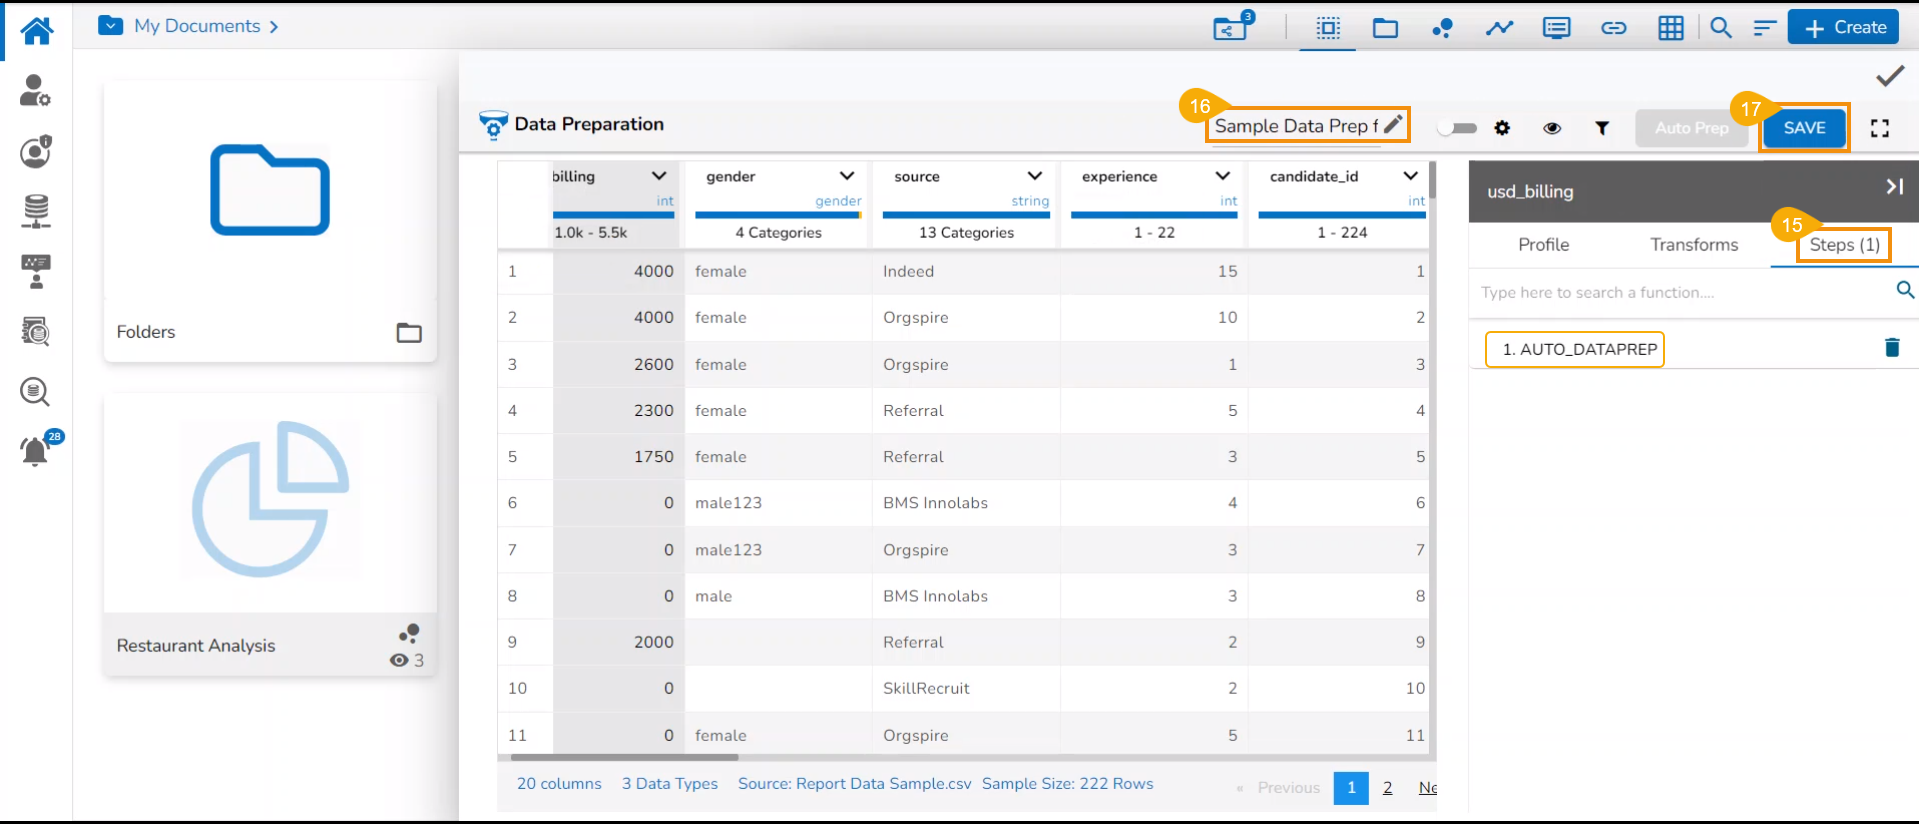
  • Open the Steps tab to see the applied Data Preparation steps (In this case, all the transforms part of the Auto Prep appear as a single step).

  • Provide a name for the Data Preparation.

  • Click the SAVE option.

  • A notification message ensures the user that the Data Preparation has been successfully applied.

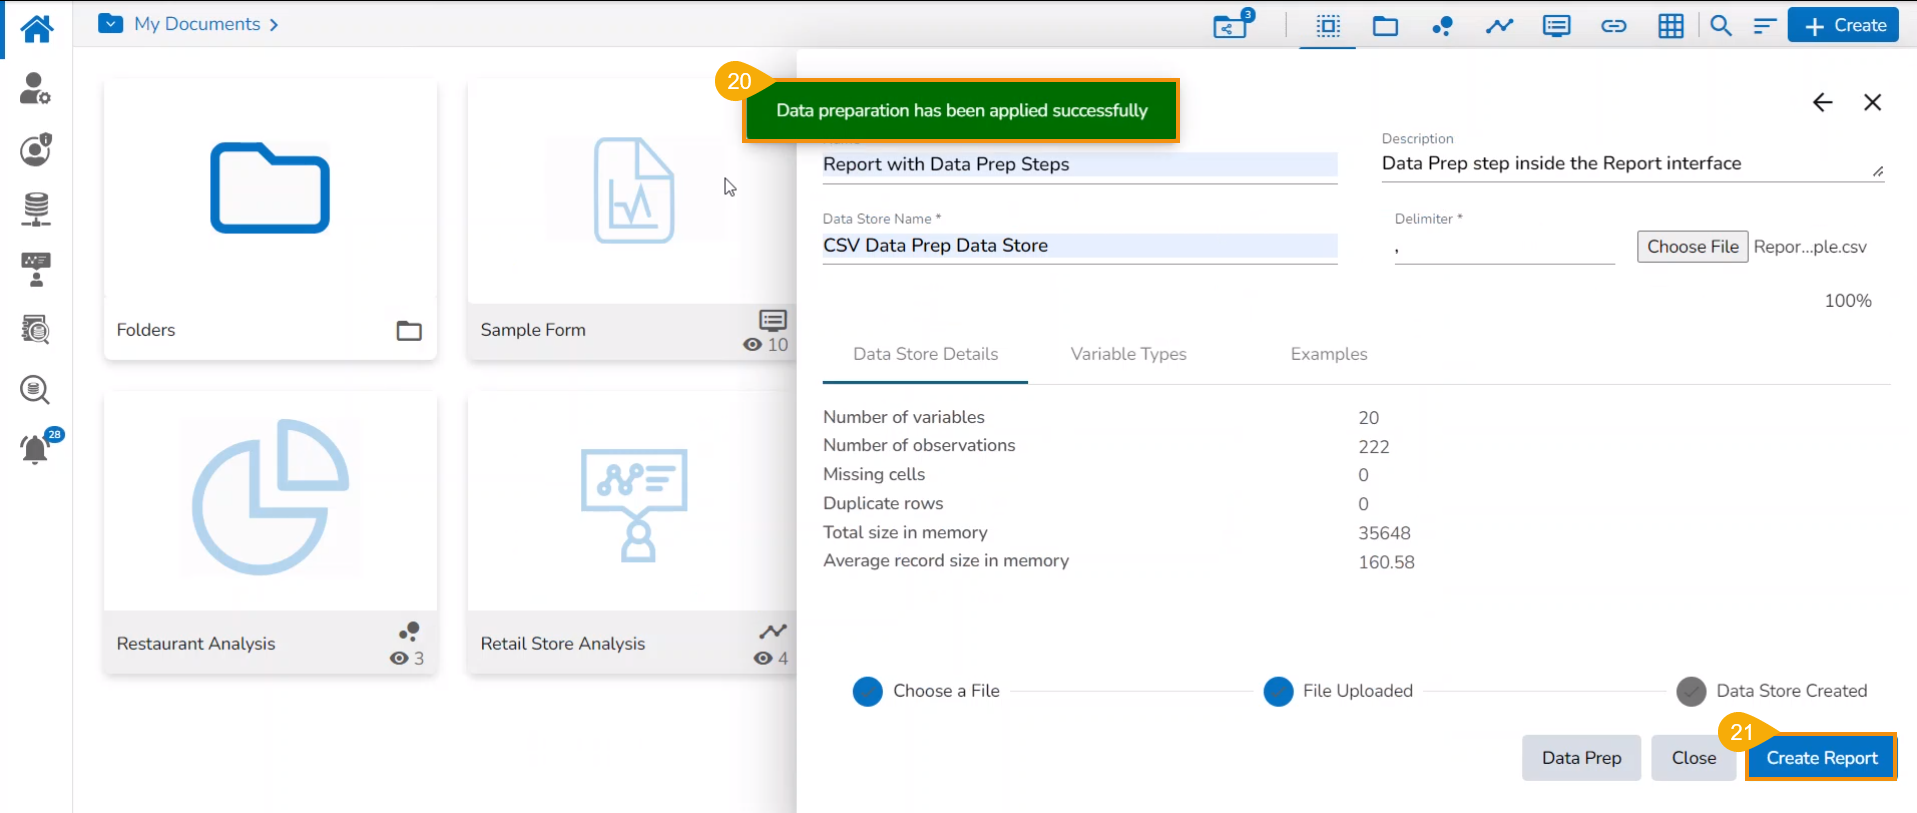
  • Click the Apply and Close icon.

  • A notification ensures that the selected Data Preparation has been applied.

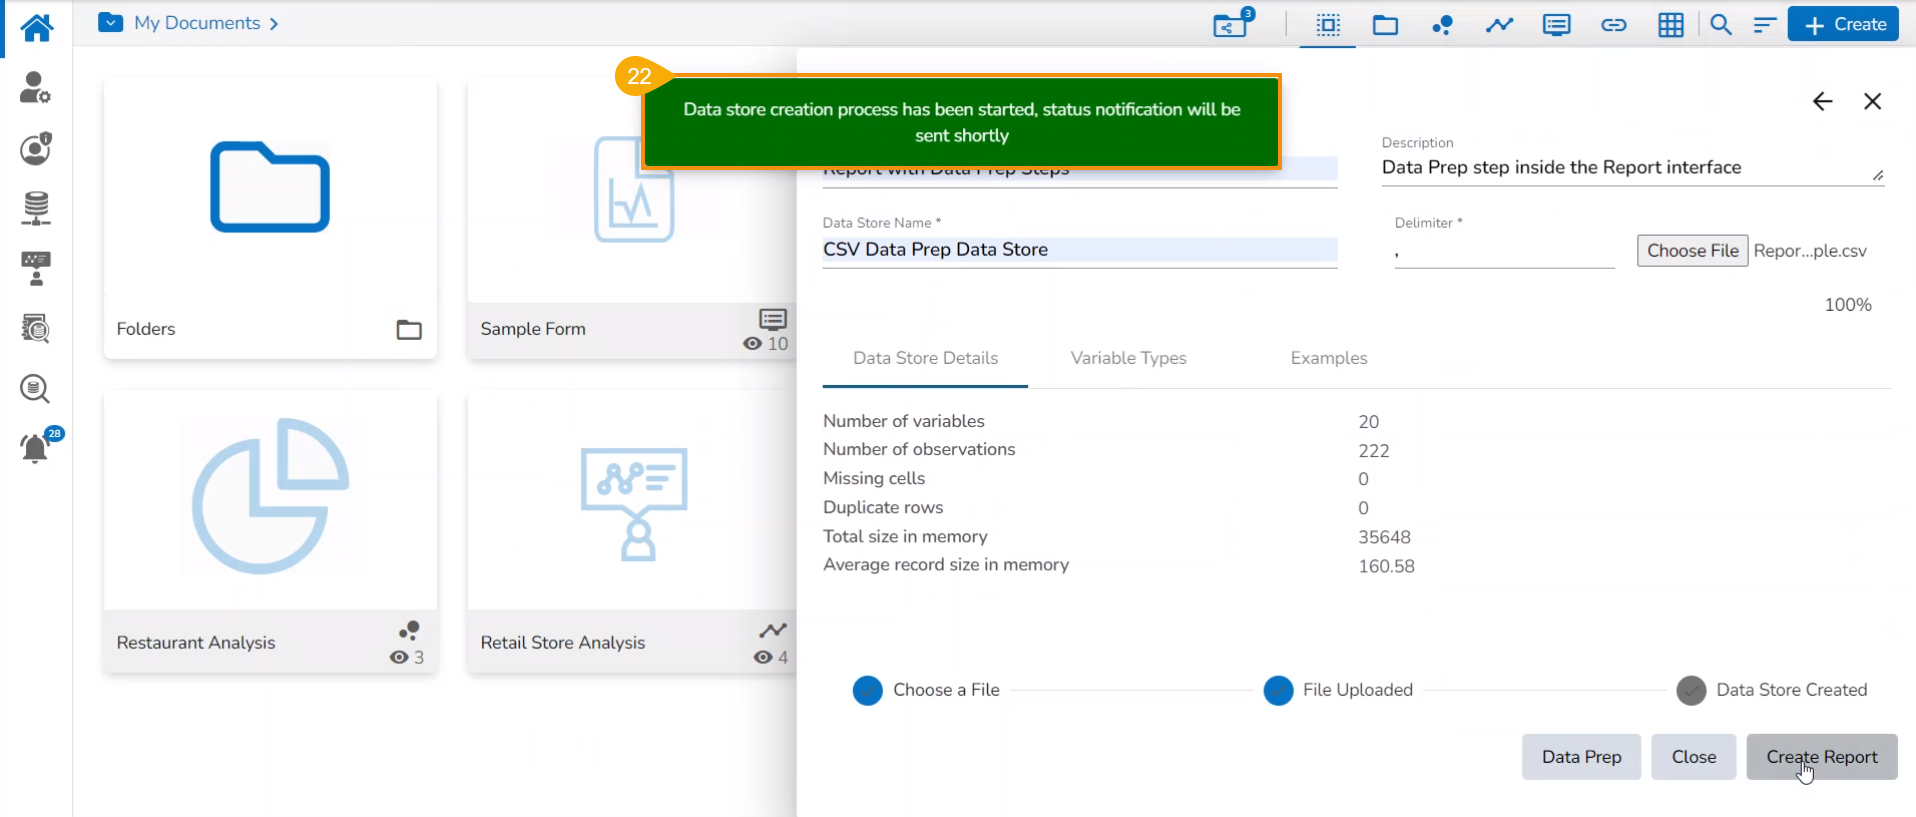
  • Click the Create Report option.

  • Another notification message informs the users that the Data Store creation process has been started and a status notification will be sent shortly.

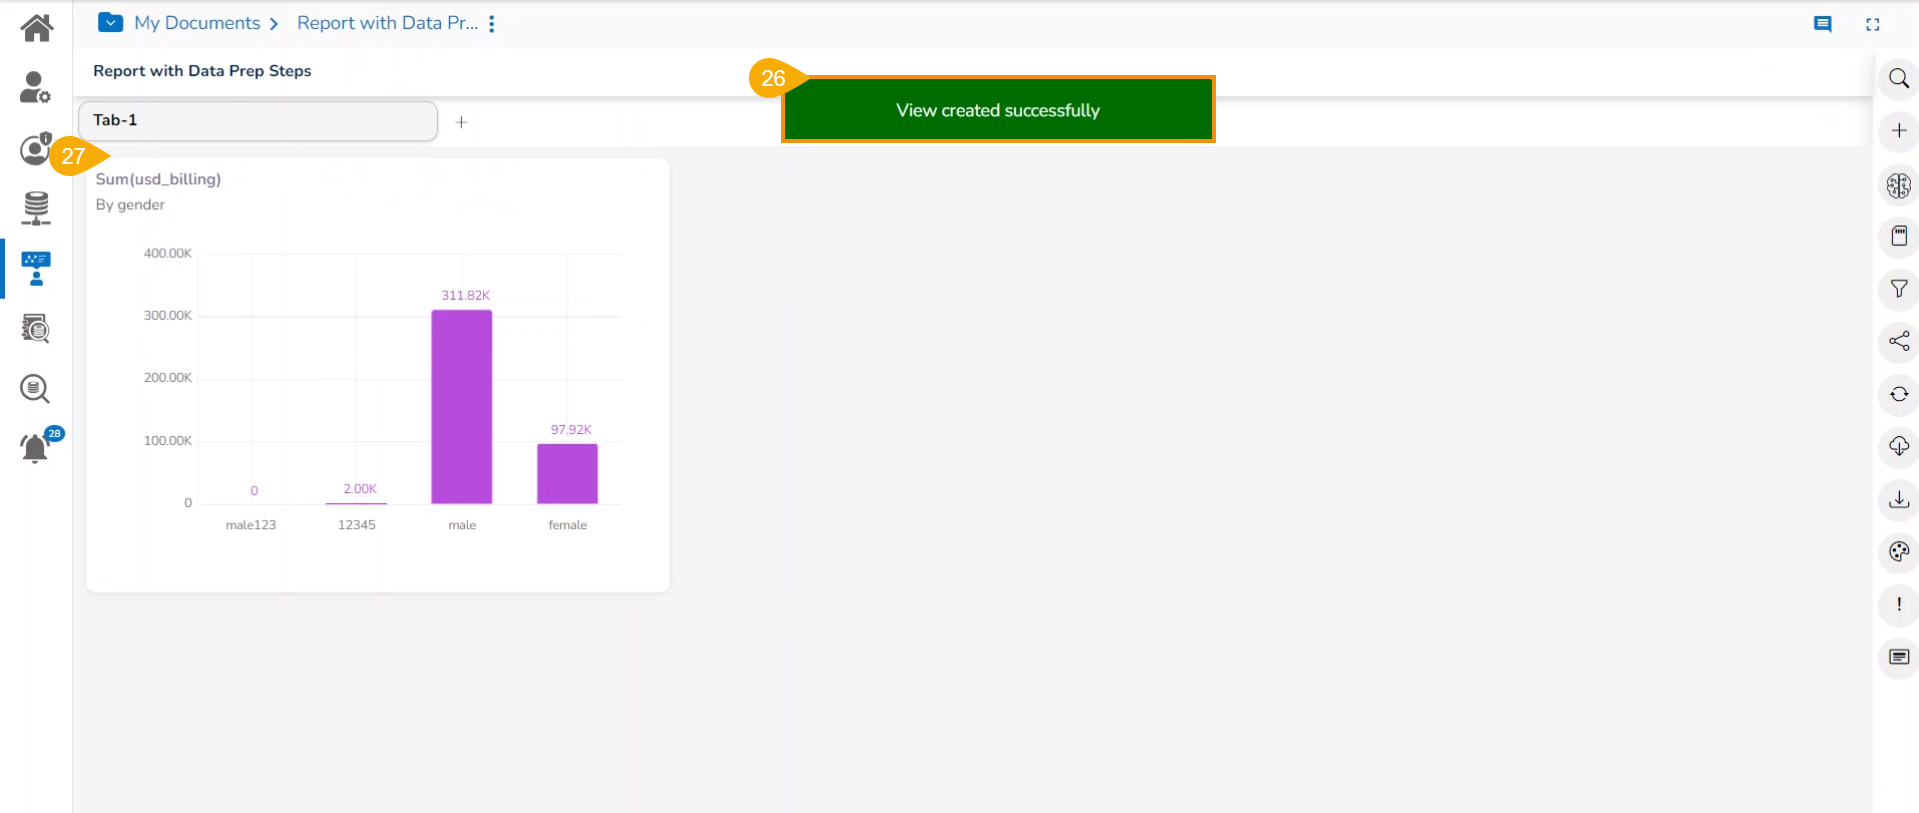
  • The report gets created under My Documents, and the Design canvas of the report opens by default.

  • Create a View by drag and drop of the required Dimensions and Measures.

  • Click the Save option to save the View.

  • A notification message appears to ensure that the View has been created successfully.

  • The newly created View gets Saved to the final screen of the Report.

Please Note: The same steps can be applied to an uploaded Excel file to create a Report.

Creating a new Report based on an uploaded file with Data Preparation steps