Dimension Profiling
This functionality has been introduced to provide users with some more insights into a dimension.
Check out the walk-through on Dimension Profiling.
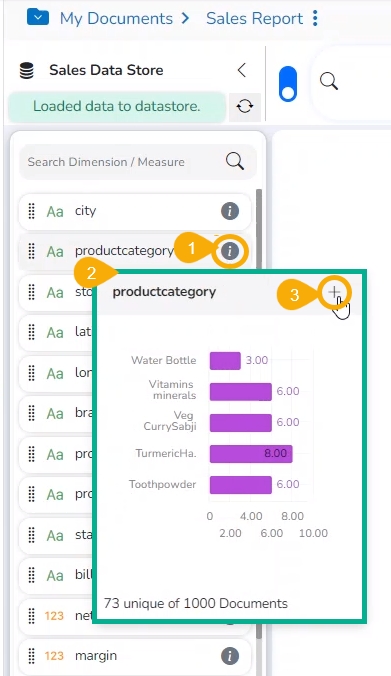
Select the Information icon from the list of displayed Dimensions on the Design page.
A new window opens with the Data Profile information displaying the count of the selected dimension value.
Click the MOVE TO DESIGN option.

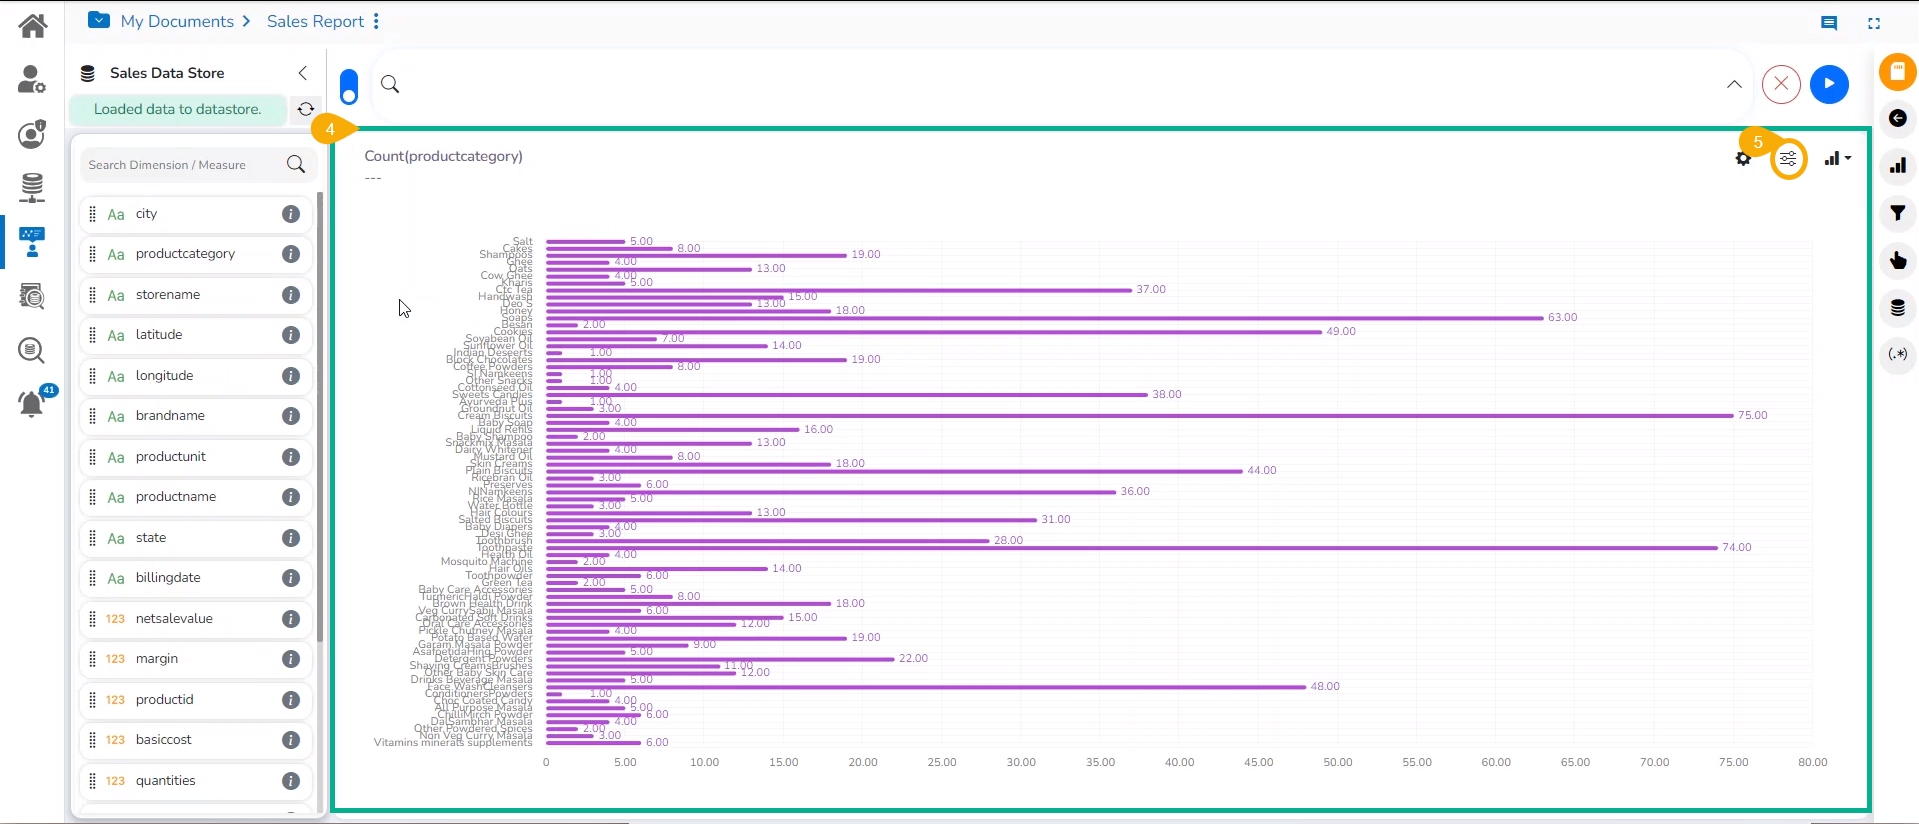
The data profile chart gets added to the design canvas.
Click the Chart Properties icon.

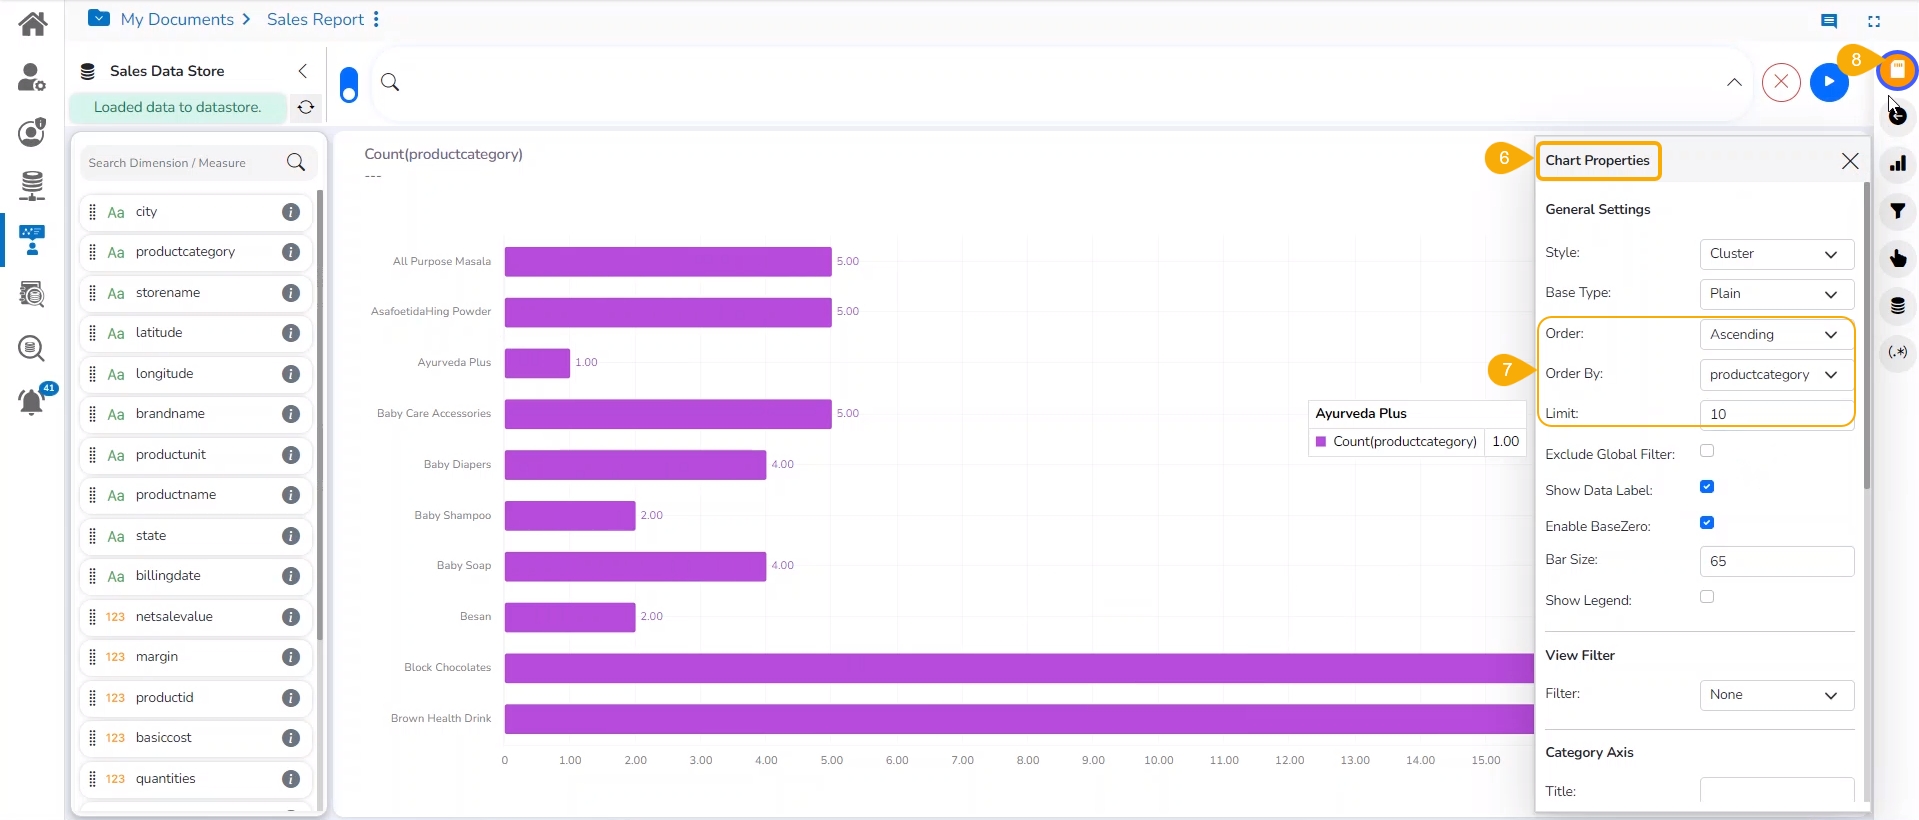
The Chart Properties window opens.
The user can apply the various modification options to the View from the Design page (E.g., The below-given image displays the View after applying for the ascending order, order by option, and limiting the display to 10 records).
Click the Save View option to save it to the report.

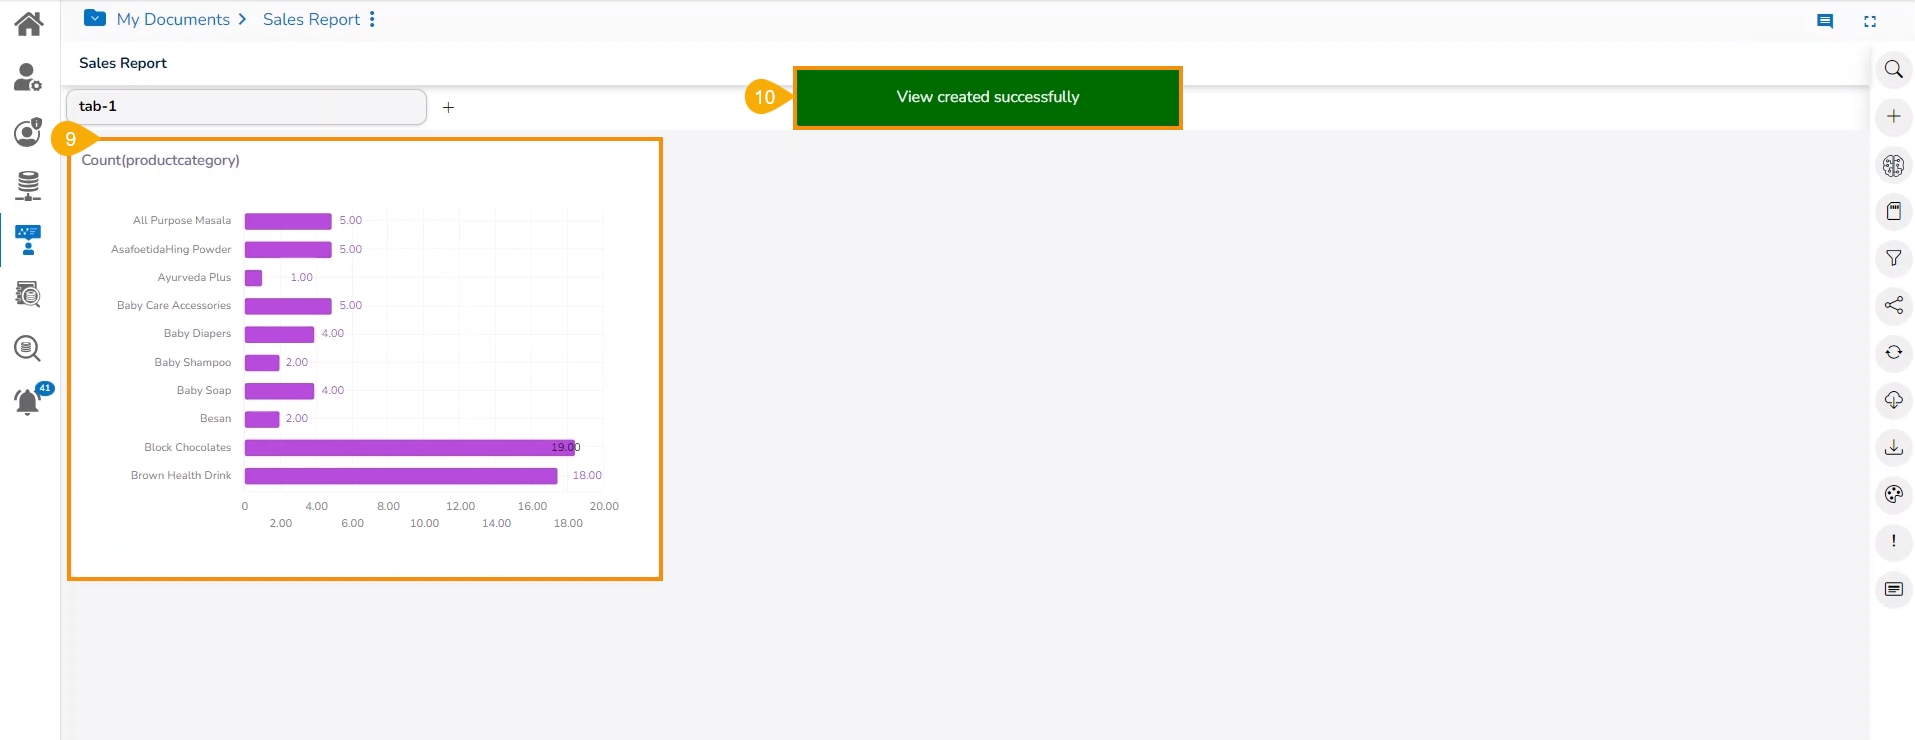
The user gets redirected to the final report screen, the selected View gets saved to the final Report screen.
A notification message appears to convey that the View has been saved to the report.
