Governed Dashboards
  • About Dashboard Designer
    • What is Dashboard Designer?
    • Why is it used?
  • Getting Started
    • Accessing the Designer Module
    • Overview of Designer Module
      • Homepage
        • Guided Tour
        • Left Menu Panel
          • New
          • Manage
          • Open Dashboard
          • Preferences
          • Save As
          • Help
          • Exit
      • Dashboard Canvas Page
        • Right side Panel
          • Connection Page
          • Chart Container
          • Manage Window
          • Script Window
          • Guided Tour
        • Canvas Properties
          • Global Properties
          • Dashboard Themes
        • Context Menu Properties
  • Create New Workspace
    • Workspace Creation: Complete Flow
    • Creating a Workspace
    • Renaming a Workspace
    • Deleting a Workspace
  • Create New Dashboard
    • Dashboard Creation: Basic Workflow
    • Adding a New Dashboard
    • Create Connection
    • Drag and Drop Charts
    • Associate the Dataset
    • Preview the Dashboard
    • Save the Dashboard
    • User Alert Notification
  • Managing Options for a Dashboard
    • Open Dashboard in Designer
    • Publish a Dashboard
    • Share a Dashboard
    • Dashboard Version Control
    • Action Menu
      • Preview Dashboard
      • Export to Local Disk
      • Rename
      • Delete
      • Moving a Dashboard
      • Information Icon
      • Dashboard as Template
  • Connecting to a Data Source
    • Accessing the Data Connectors
    • Establishing a Data Connection
      • CSV Connection
      • Excel Connection
      • Data Service Connection
      • Data Store Connection
      • Data Sheet Connection
        • Data Sheet Enhancements
      • WebSocket Connection
      • Merged Connection
  • Charts Gallery
    • Charts
      • Area chart
      • Bar Chart
      • Bubble Chart
      • Circumplex Chart
      • Column Chart
      • Funnel Chart
      • Histogram Chart
      • Inverted Funnel
      • KPI Tile
      • Line Chart
      • Map Chart
      • Mito Plot
      • Mixed Chart
      • Pie Chart
      • Project Timeline
      • Pyramid Chart
      • Scatter Plot
      • Spark Line
      • Spider Chart
      • Waterfall Chart
    • Grids
      • Data Grid
      • Paging Grid
      • Data Sheet
      • Scorecard
      • Pivot Grid
    • Filters
      • Checkbox
      • Combobox
      • Hierarchical Combobox
      • List
      • Radio Button
    • Advanced Charts
      • Box Plot
      • Candle Stick
      • Chevron
      • Data Search
      • Decision Tree
      • Group Bar
      • Group Column
      • Heat Map
      • Sankey
      • Text Analyzer
      • Time Series
      • Decomposition
      • Knowledge Graph
      • Tree Map
      • Trellis
      • Word Cloud
      • New Word Cloud
    • Other Charts
      • Box
      • Bullet
      • Date Picker
      • Export
      • Filter Chips
      • Filter Saver
      • Gauge
      • Graphics
      • Guided Tour
      • H-Slider
      • Image
      • Info Button
      • Input Box
      • Label
      • Legend
      • Progress Pie
      • Semi Gauge
      • Stepper
      • SVG Image
      • Text Box
      • Trend
      • URL Button
      • V-Slider
      • Tab Component
      • Inputbox component
      • Button component
    • Custom Charts
    • Common Chart Properties
      • Background
      • Title & Sub-title
      • X & Y Axis Properties
      • Legend Properties
      • Formatter
      • Axis Setup
      • Export Options
      • Copy Paste Chart Properties
  • Dashboard Objects
    • Manage Dashboard Components
    • Dashboard Objects Properties
  • Configurations
    • Filtering the Data
    • Drill Through
      • Drill Highlighter
    • Dataset Properties
    • Indicators in Charts
    • Tooltip(Default & Custom)
    • Data Label
    • Geo Mapping
    • Language Mapping
    • Legend Mapping
    • Alerts in Grids
  • Script Help Section
    • Navigate to Script Help page
    • How to use Scripts?
Powered by GitBook
On this page
  • Publishing to Portal
  • Republish
  • Publish as New
  1. Managing Options for a Dashboard

Publish a Dashboard

PreviousOpen Dashboard in DesignerNextShare a Dashboard

Last updated 1 year ago

​The below-given illustration will help you to understand how to publish a Dashboard.

Dashboards need to be published for end-users to access them. This section explains the steps to publish dashboards.

Publishing to Portal

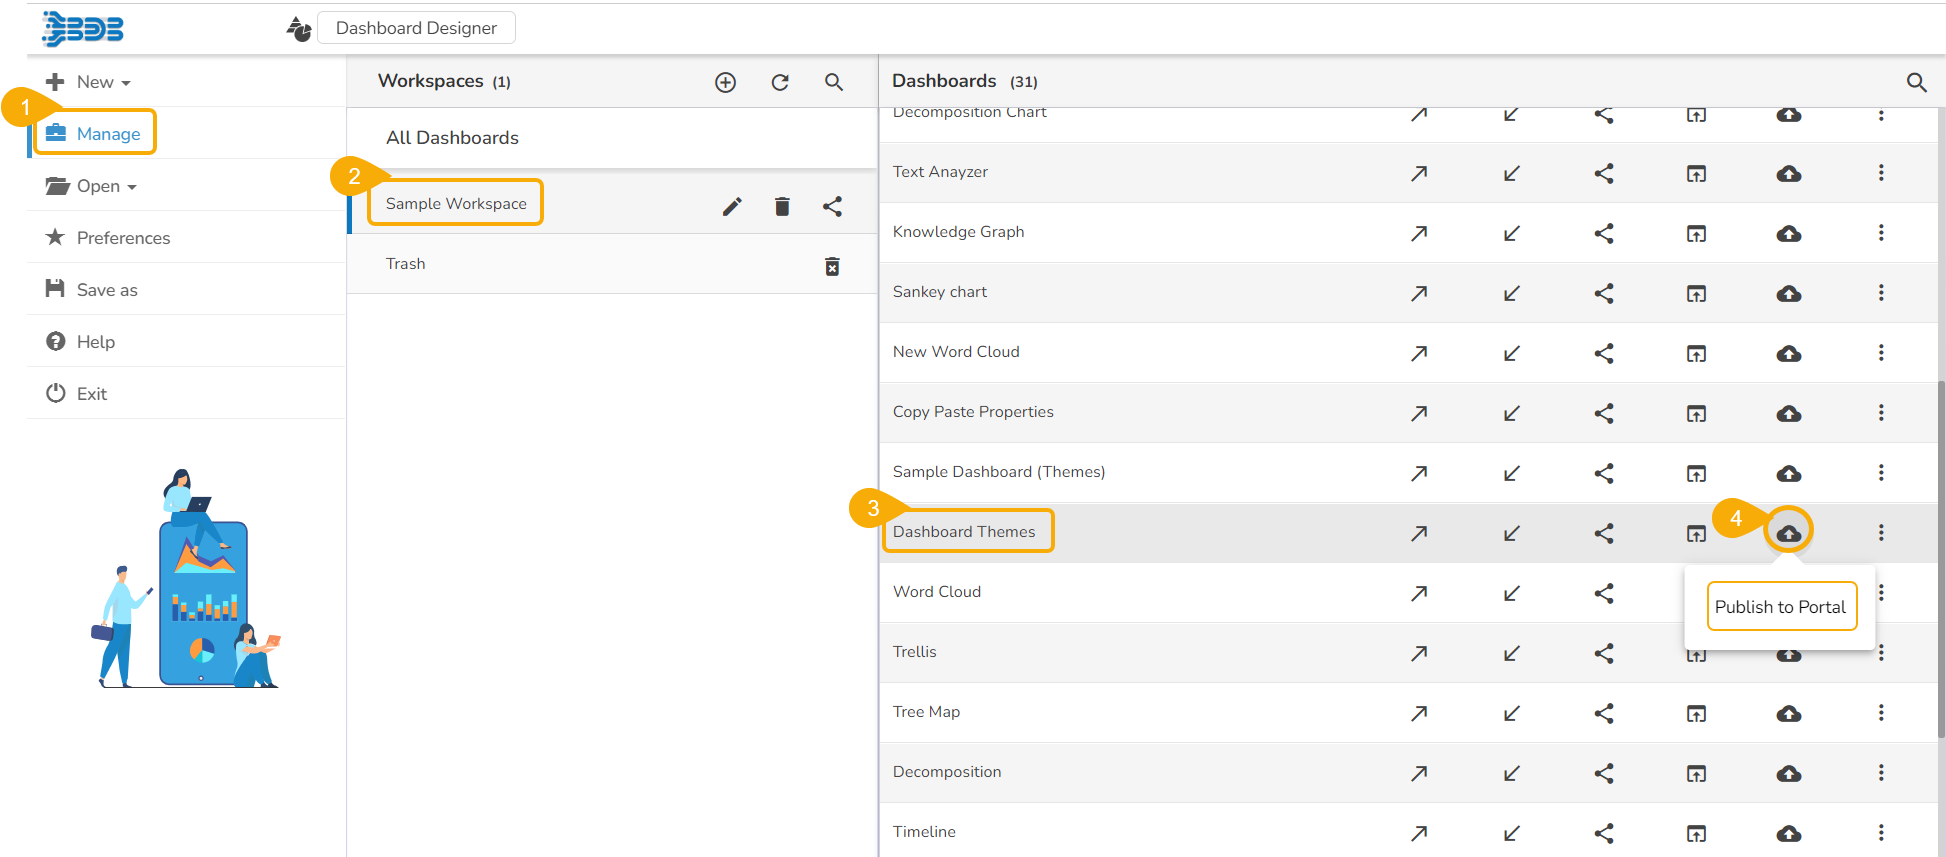
  • Click the Manage option on the Designer homepage.

  • Select and click on a workspace from the list of Workspaces.

  • Select a Dashboard from the list of the saved dashboards under the selected workspace.

  • Click the Publish to Portal icon.

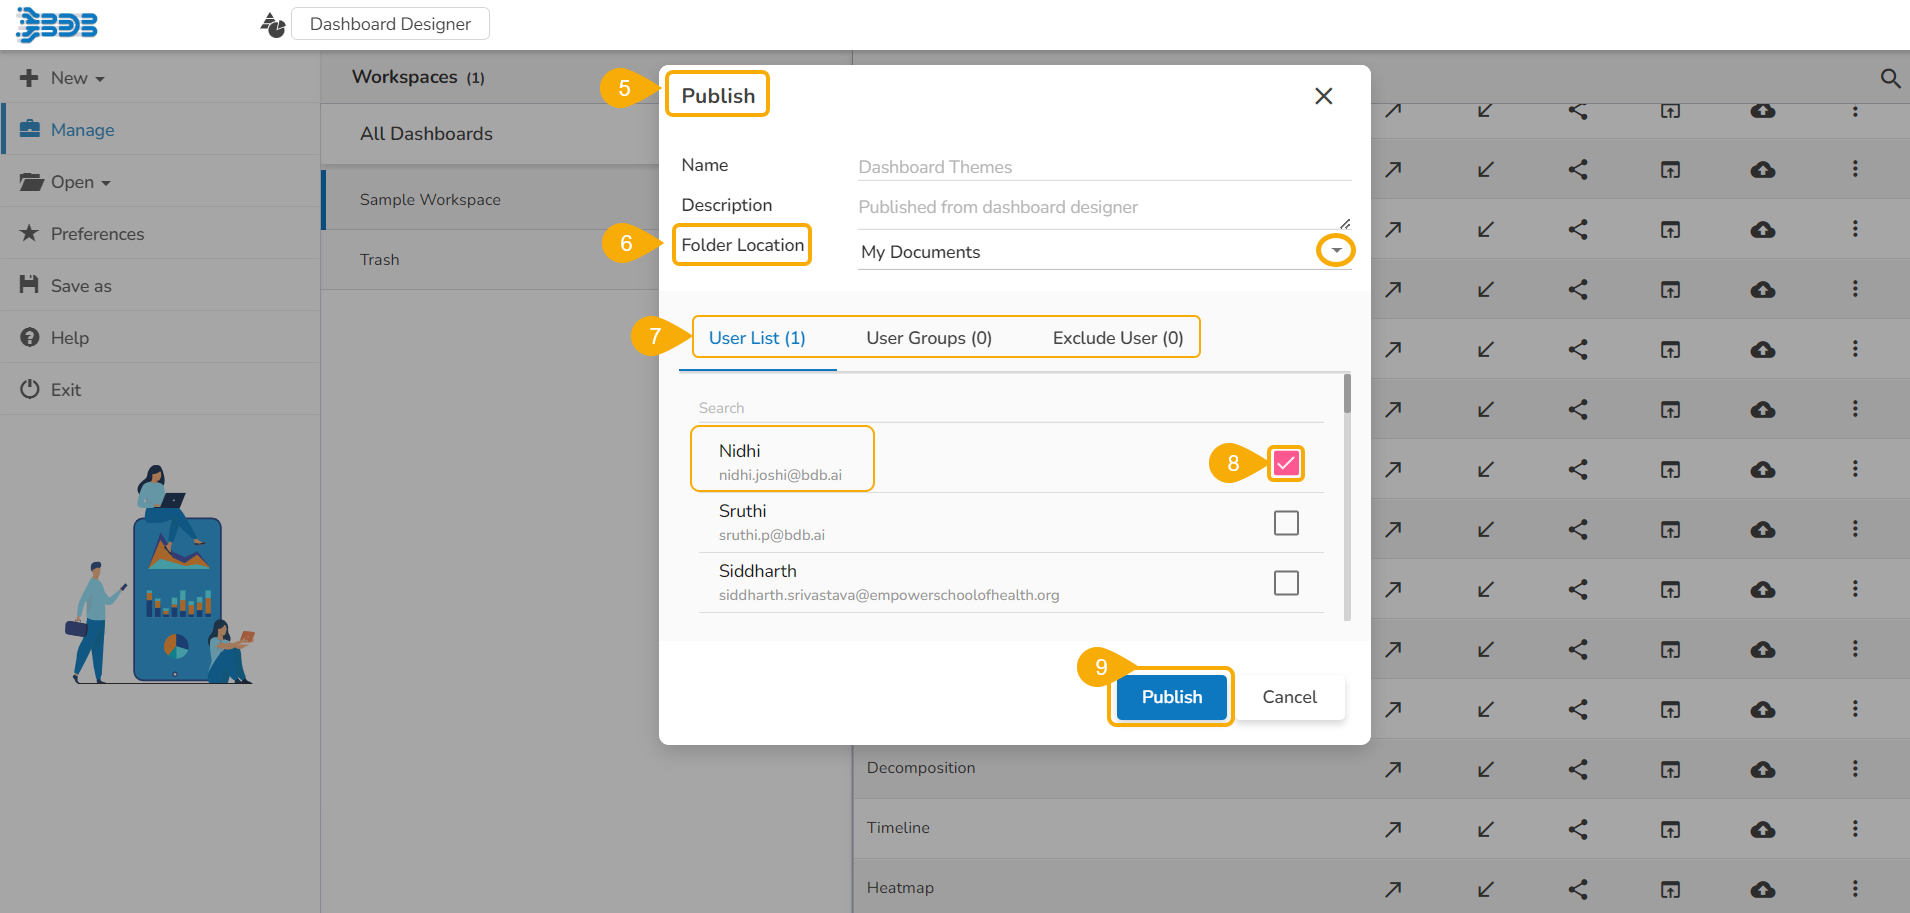
  • The Publish dialog box appears to assure the action with the dashboard name and description.

  • Select Folder Location using the drop-down icon.

    • The supported folders are My Documents and Public Documents.

  • The user needs to specify a user or user group using the following options:

    • User List: To select a user or multiple users by using a checkmark in the box.

    • User Groups: To select a user group or multiple user groups by using a checkmark in the box.

    • Exclude User: To exclude a user or multiple users by using a checkmark in the box.

  • Click the Publish option.

  • Two consecutive notification messages appear to assure the completion of the action.​

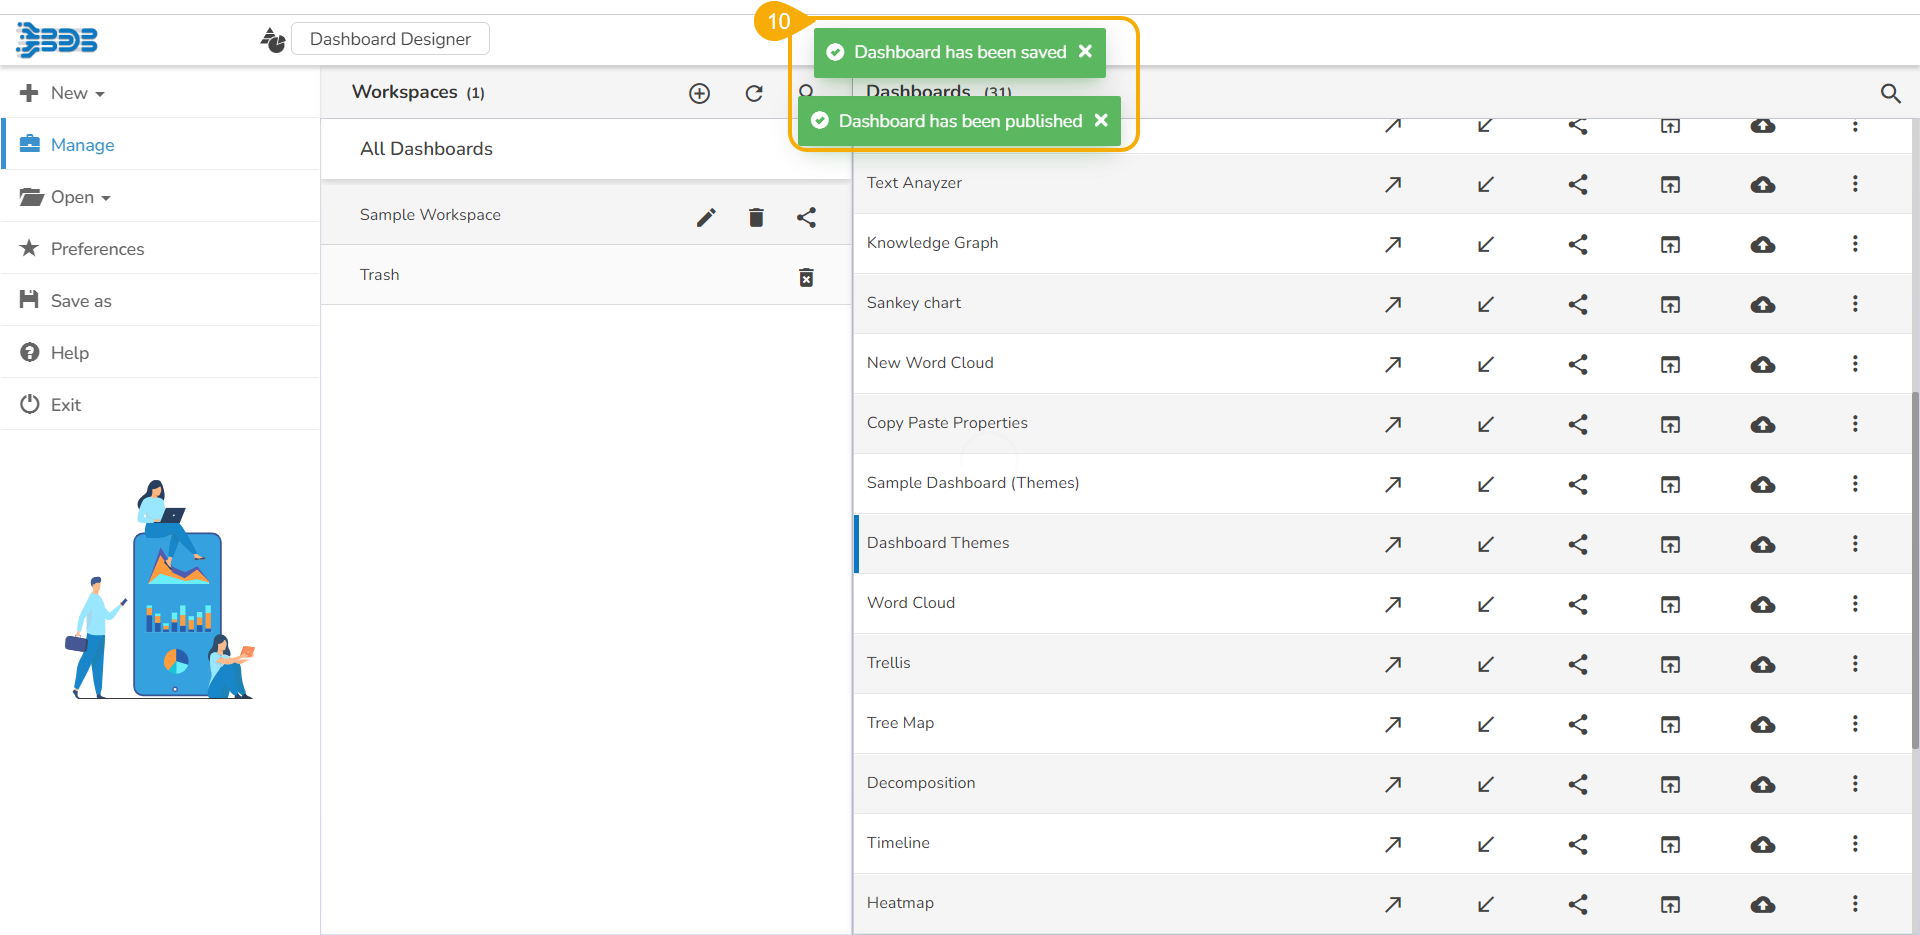
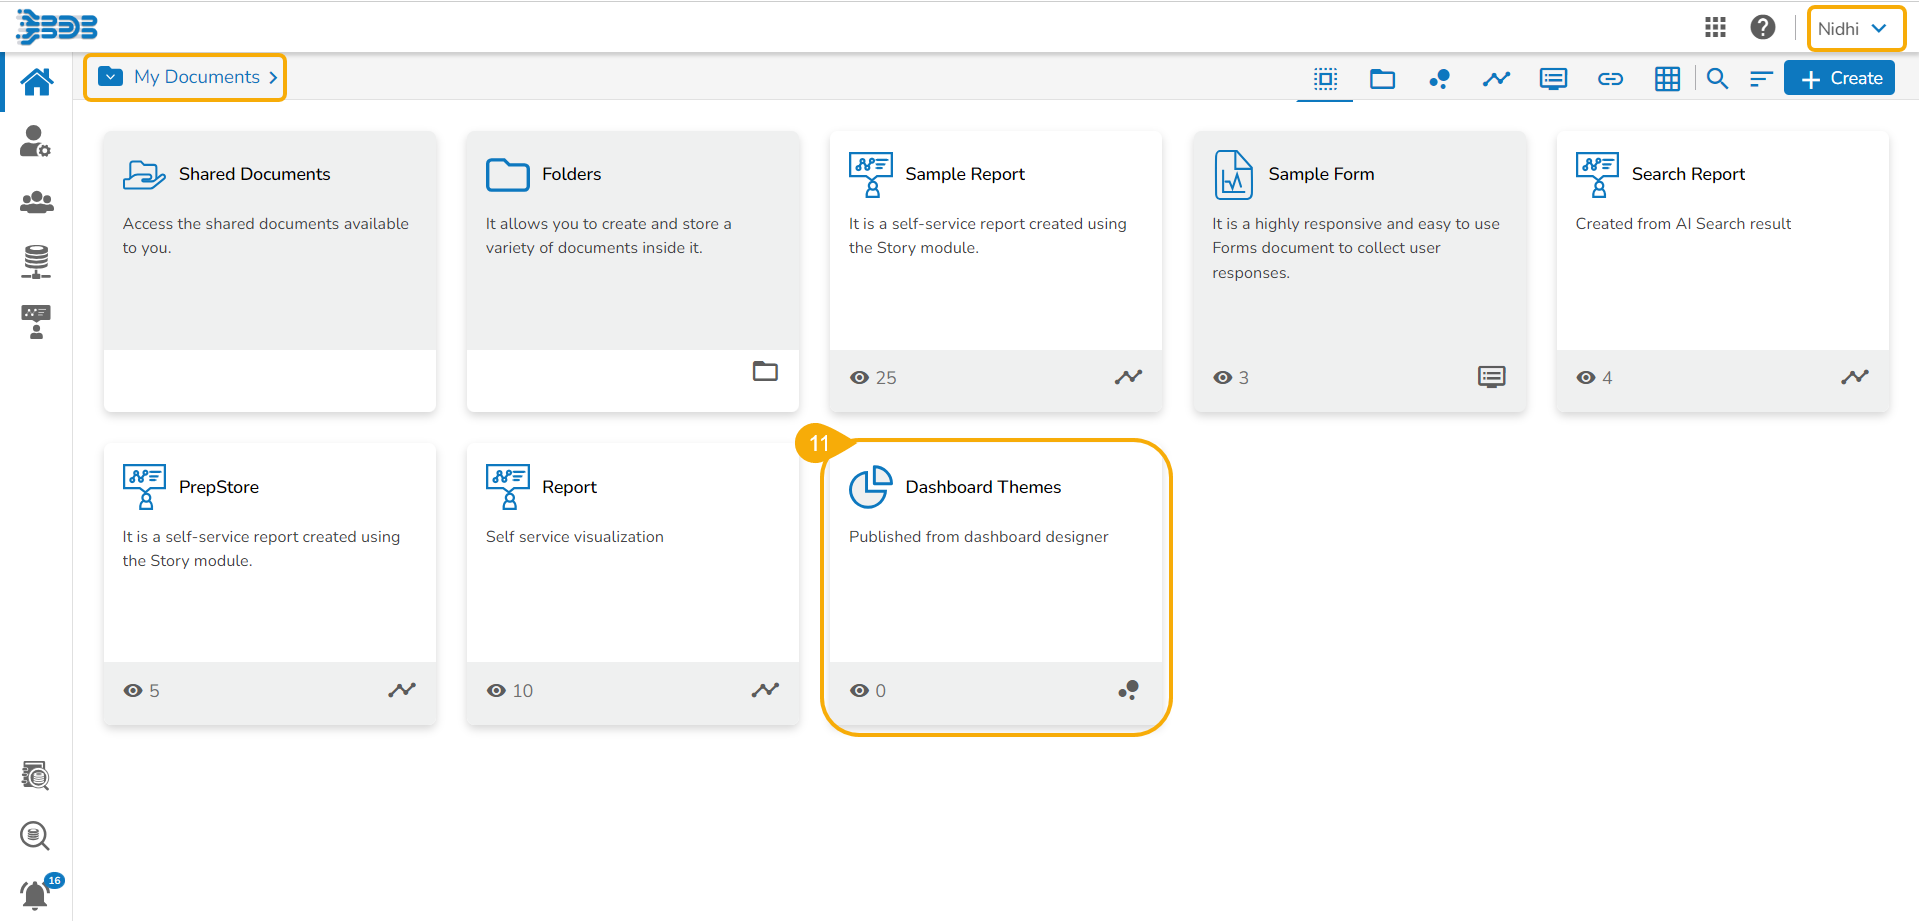
  • The selected dashboard gets published at the desired place.
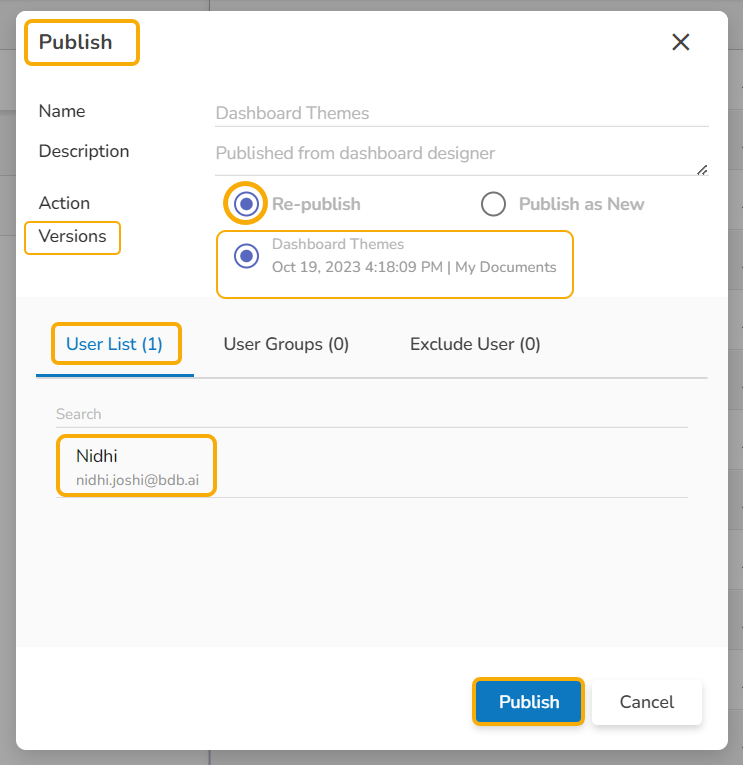
Republish

  • For the published dashboard, the below-given dialog box appears while clicking the Publish to Portal icon.

  • Select an action option out of Re-Publish or Publish as New.

    • The Republish option if selected displays the following details:

      • The available version(s) of the published dashboard. The user can select a version to republish.

      • The selected user(s) or user group(s) gets appeared in the dialog box.
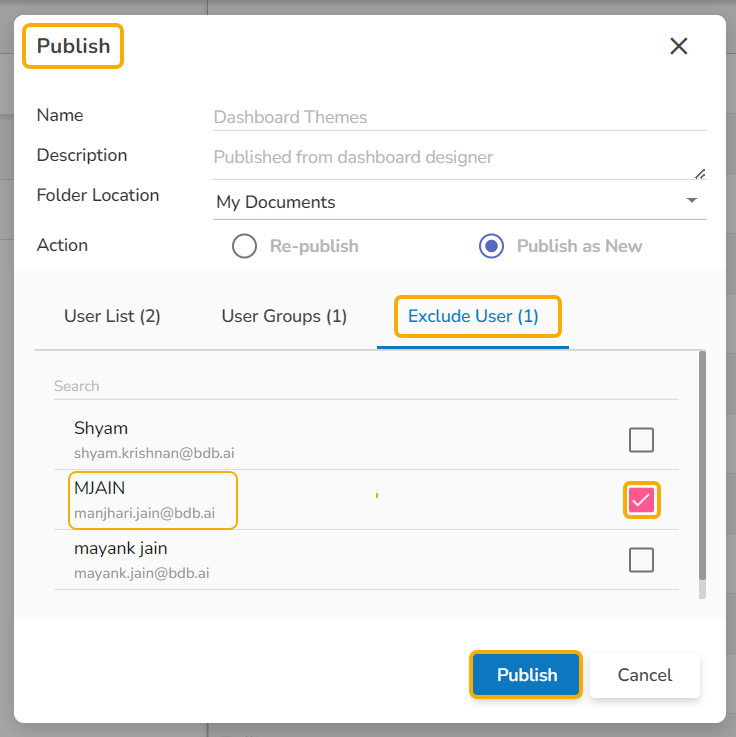
      ​

    ​

Publish as New

  • The Publish as New action allows the user to publish the selected dashboard as new.

  • Select Use(s) or User Group(s) using either USER LIST or USER GROUPS tab.

  • Select the desired user(s) or user group(s) using check marks in the given check boxes.

Please Note:

  • Click the Publish option to complete the action of republishing a dashboard or Publishing a Dashboard as New.

  • Click the Publish option even to Exclude a user from the rights to access a dashboard.

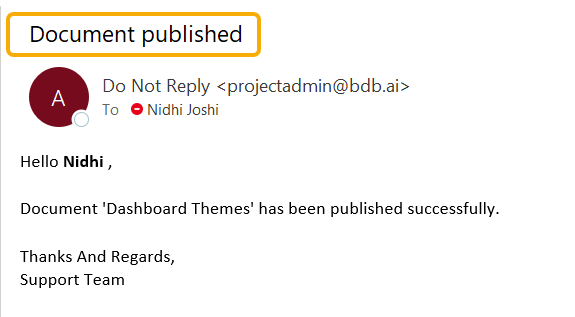
  • The selected user receives an email from the BDB Support Team after the selected Dashboard gets ​published to the user.

​

​

Each published Dashboard gets a set of options to be performed on it. Refer to section provided under the to get more details on it.

Options for a Published Dashboard
Document Options
Publishing a Dashboard
Accessing the Publish to Portal option for a dashboard