
New Word Cloud
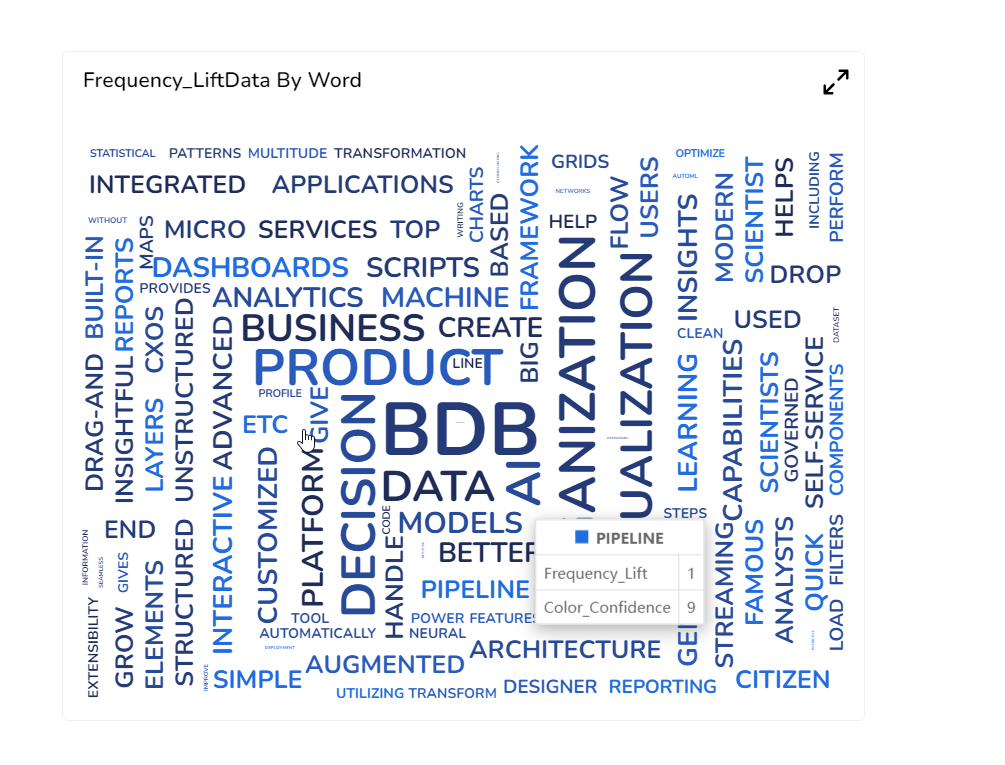
Word Cloud is a visual representation of text data where the font size of a word depicts the frequency of this word in a set of text data. Even though Word clouds are not a perfect tool for data analysis and business data visualizations, they definitely have their place in info graphics. Word clouds can also reveal patterns in your responses that may guide future analysis.
Best Situations to Use a New Word Cloud chart
To analyze text data
To identify trends and patterns that would otherwise be unclear or difficult to see in a tabular format
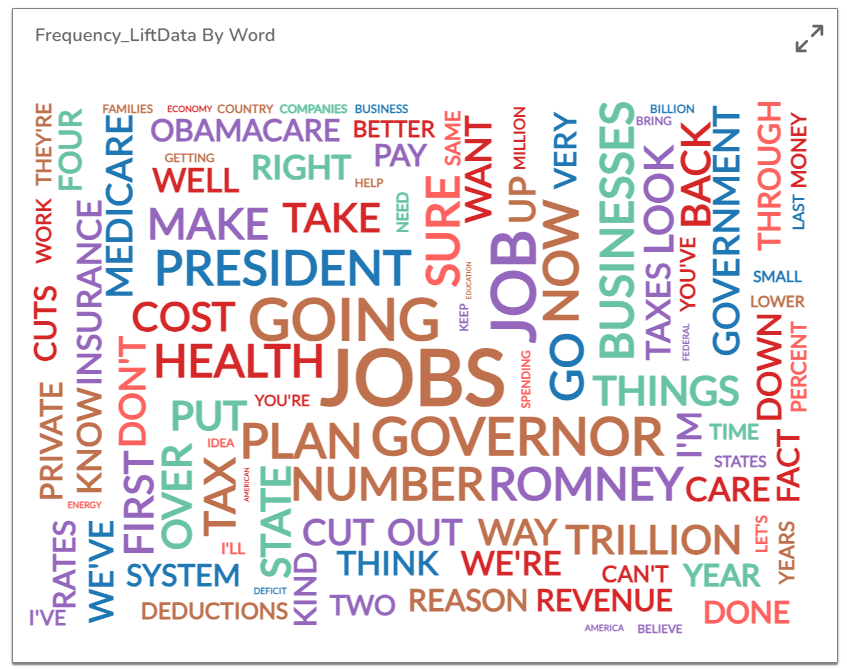
Default Chart Image
Properties of the New Word cloud chart
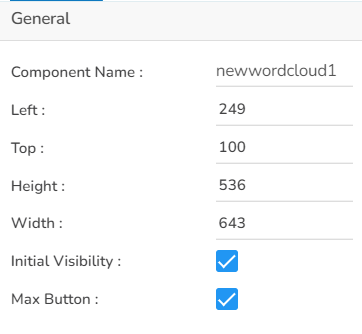
General
The user can change the height, width, top, left, chart type, column type & Line form. In this case, we have changed the scroll view to disable.
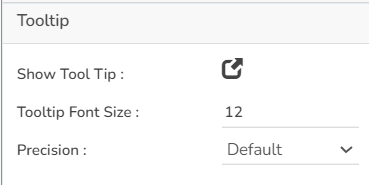
Tooltip
The user can show the description of the series can use the tooltip by enabling it.
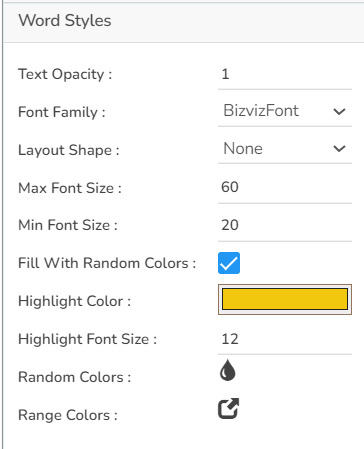
Word Styles
The user can enable the shuffle text, rotate text, show limited words, can change the highlighter color, can change the words to upper case, lower case.
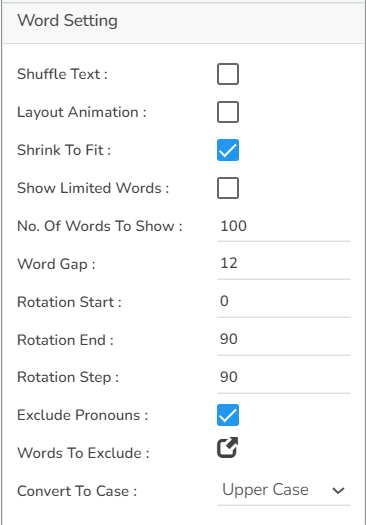
Word Setting
This Properties help the users to configure various settings such as Shuffle Text, Layout Animation, Shrink To Fit, Show Limited Words. The users can also decide on the number of words to show, the gap to be maintained between two words, Rotation properties. It is possible to exclude the synonyms of the words that have multiple synonyms. The text case can also be selected using the Convert To Case option.
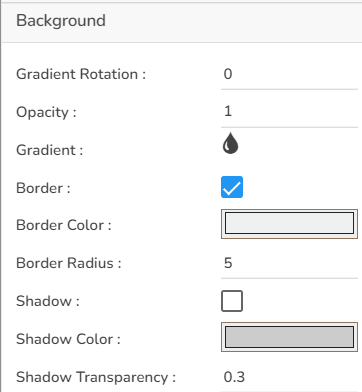
Background
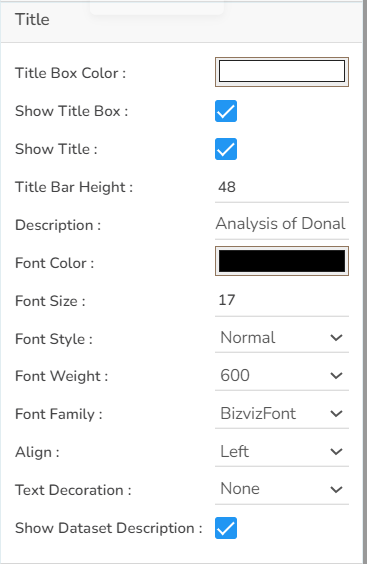
Title
The user can insert or modify the inserted (default) Title text (description), Font color, size, style, etc. The user can also enable or disable the Title box or title text using this properties option. By enabling the Show Dataset Description option the Title will get added from the mapped dataset.
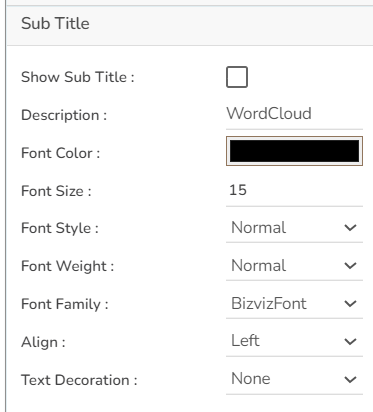
Sub Title
The user can enable the subtitle to display the second title. The user can change the Name, Font color, size, style for the subtitle.
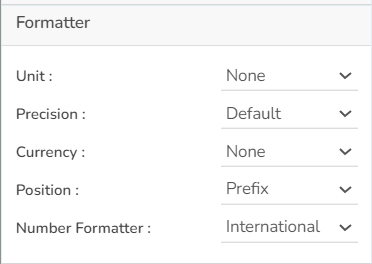
Formatter
The user can set formatter properties such as Unit, Precision, Currency, Position, and Number Formatter properties for the New Word Cloud chart.
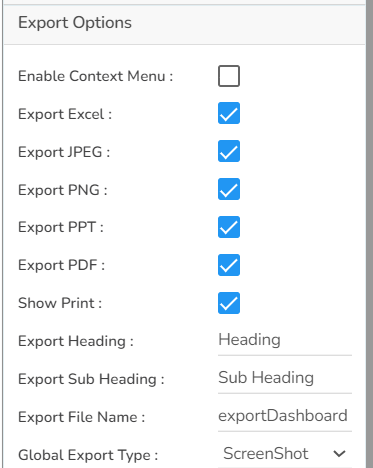
Export Options
The user can enable the Enable Context Menu to download the reports in different formats if we click on the chart from the preview section. The heading and sub heading of that downloaded chart and the name of the downloaded file can be change from this section.
Word Cloud chart by changing the Properties
Sample Data
Download the given sample data and map it as mentioned below to plot your New Word Cloud chart:
Select the Word column as Rules, Color_Confidence column as Confidence, and Frequency_Lift column as Lift.