# Decision Tree
## Decision Tree
{% hint style="success" %}
*Check out the below given walk-through on how to use the Decision Tree chart component in Designer module.*
{% endhint %}
A Decision Tree chart that helps determine a course of action or show a statistical probability. The chart is called a decision tree due to its resemblance to the namesake plant, usually outlined as an upright or a horizontal diagram that branches out.
The Decision Tree chart is made up of various nodes. It contains three types of nodes: Decision nodes, chance nodes, and outcome nodes. Starting from the Decision node, each ***branch*** of the Decision Tree represents a possible decision, outcome, or reaction. The furthest branches on the tree represent the end results of a certain decision pathway and are called the "leaves".
## **Best Situation to use Decision Tree chart**
* To classify the data based on a condition
* To display continuous nodes as endpoints in a Regression Tree
Some examples where Decision Tree may be used:
* To predict the Customer's action/reaction
* To forecast Stock market movements
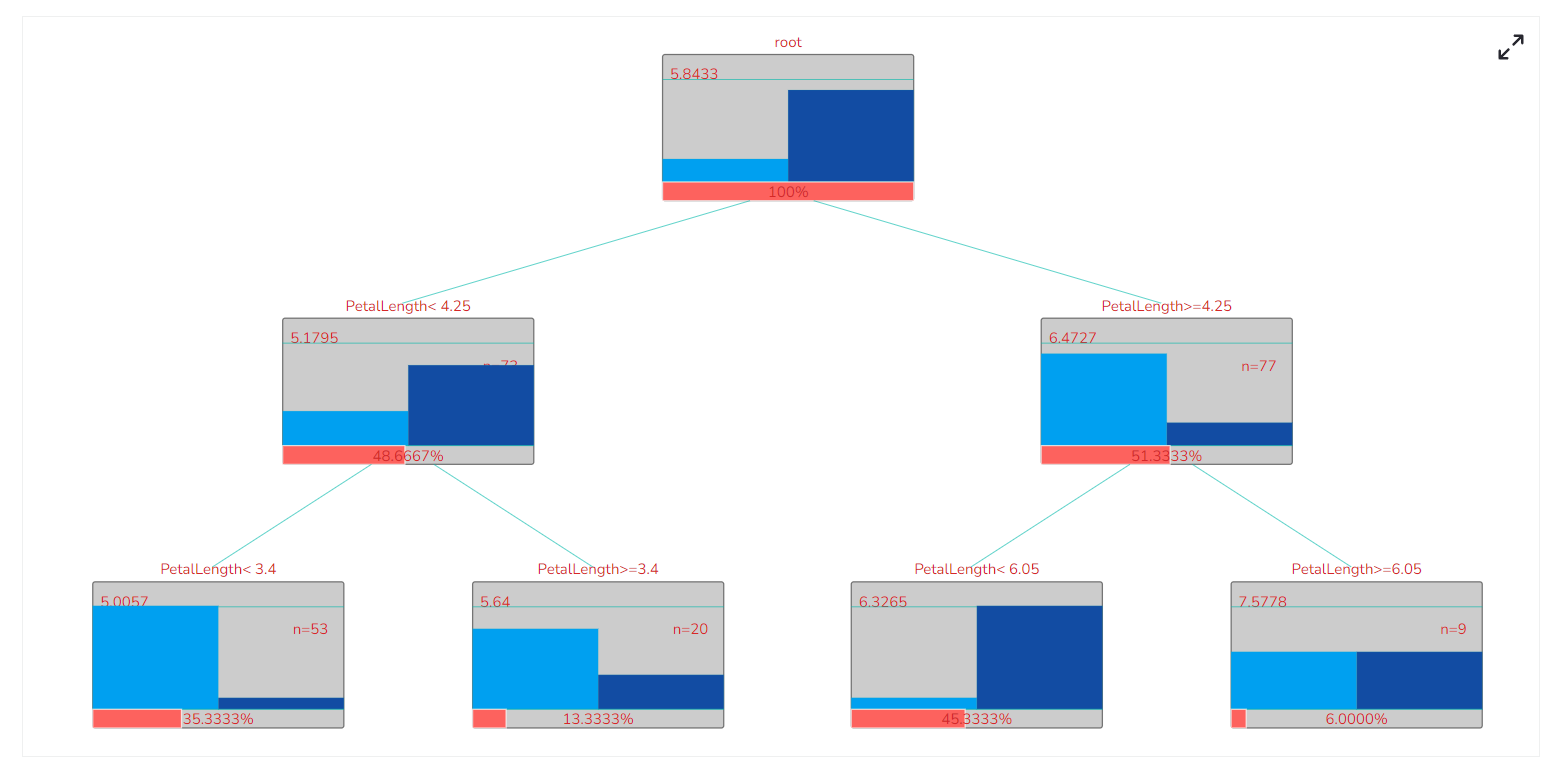
## **Default Chart Image**
## **Properties of the Decision Tree chart**
### **Background**
The user can change the background color of the chart, can get the border for the chart and can change the border color, can get the reflection of the chart by enable the shadow option can also change the color and increase & decrease the transparency of the shadow.
### **Export Options**
The user can enable the ***Enable Context Menu***, then it is possible to download the reports in different formats if we click on the chart from the preview section. The heading and sub heading of that downloaded chart and the name of the downloaded file can be change from this section.
### **General**
The user can change the height, width, top, left, chart type, column type & Line form. In this case we have only Chevron chart.

### **Styling Properties**
The user can change the Box color, font color, Node color, Percentage box value color and line color.

### **Tooltip**
The user can show the description of series can use tooltip by enabling it.
## **Property Tab for Dataset Properties Pallet**

## **Decision Tree chart by changing the Properties**
## Sample Data
Download the given sample data and map it as mentioned below to plot your ***Decision*** chart:
The Data has been selected for specific field based on their names
{% file src="" %}