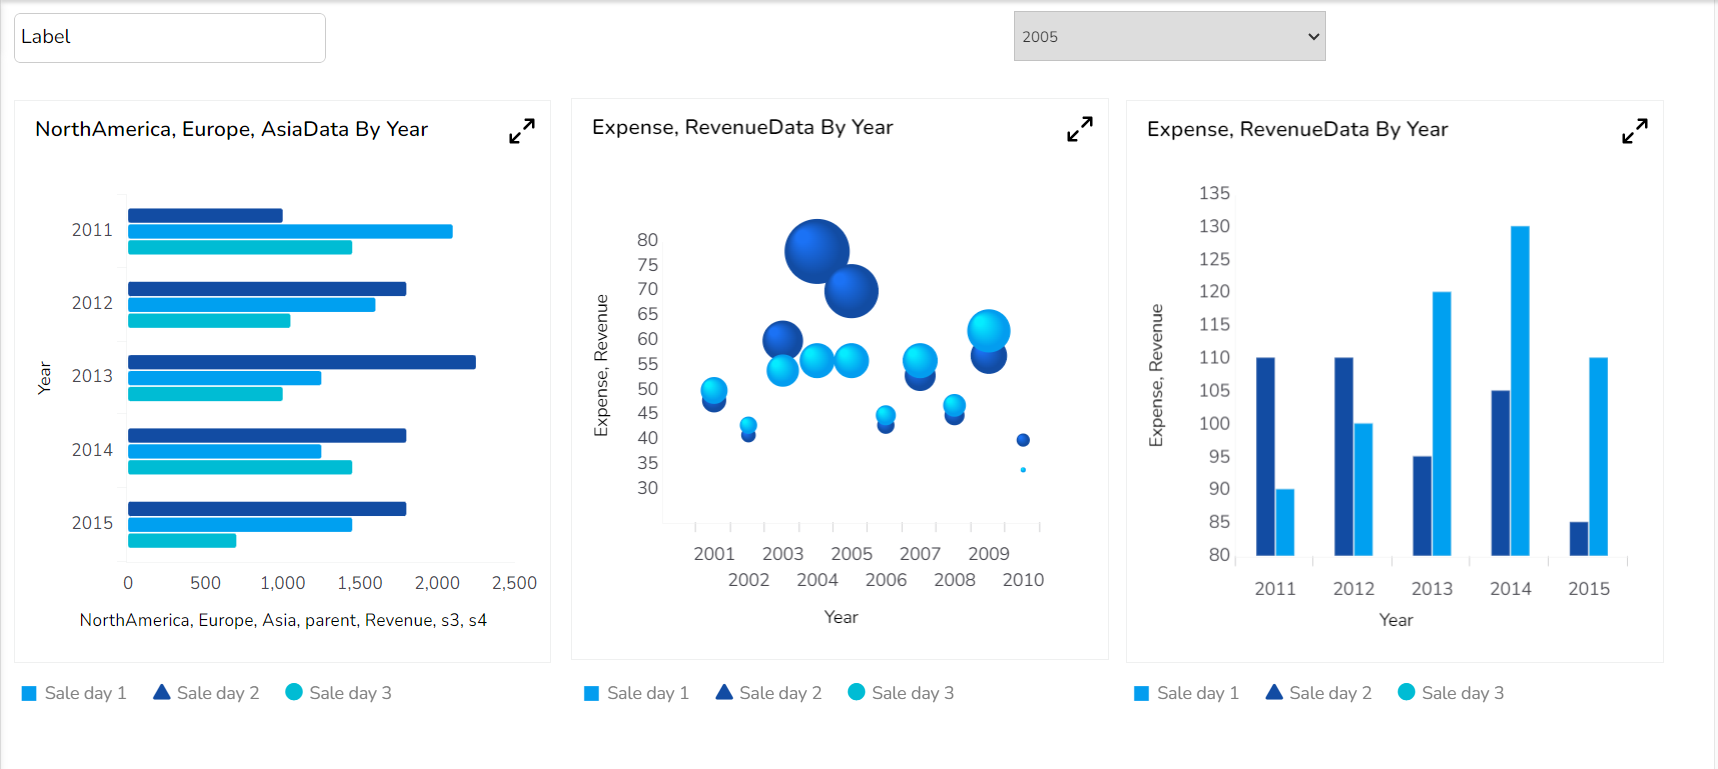
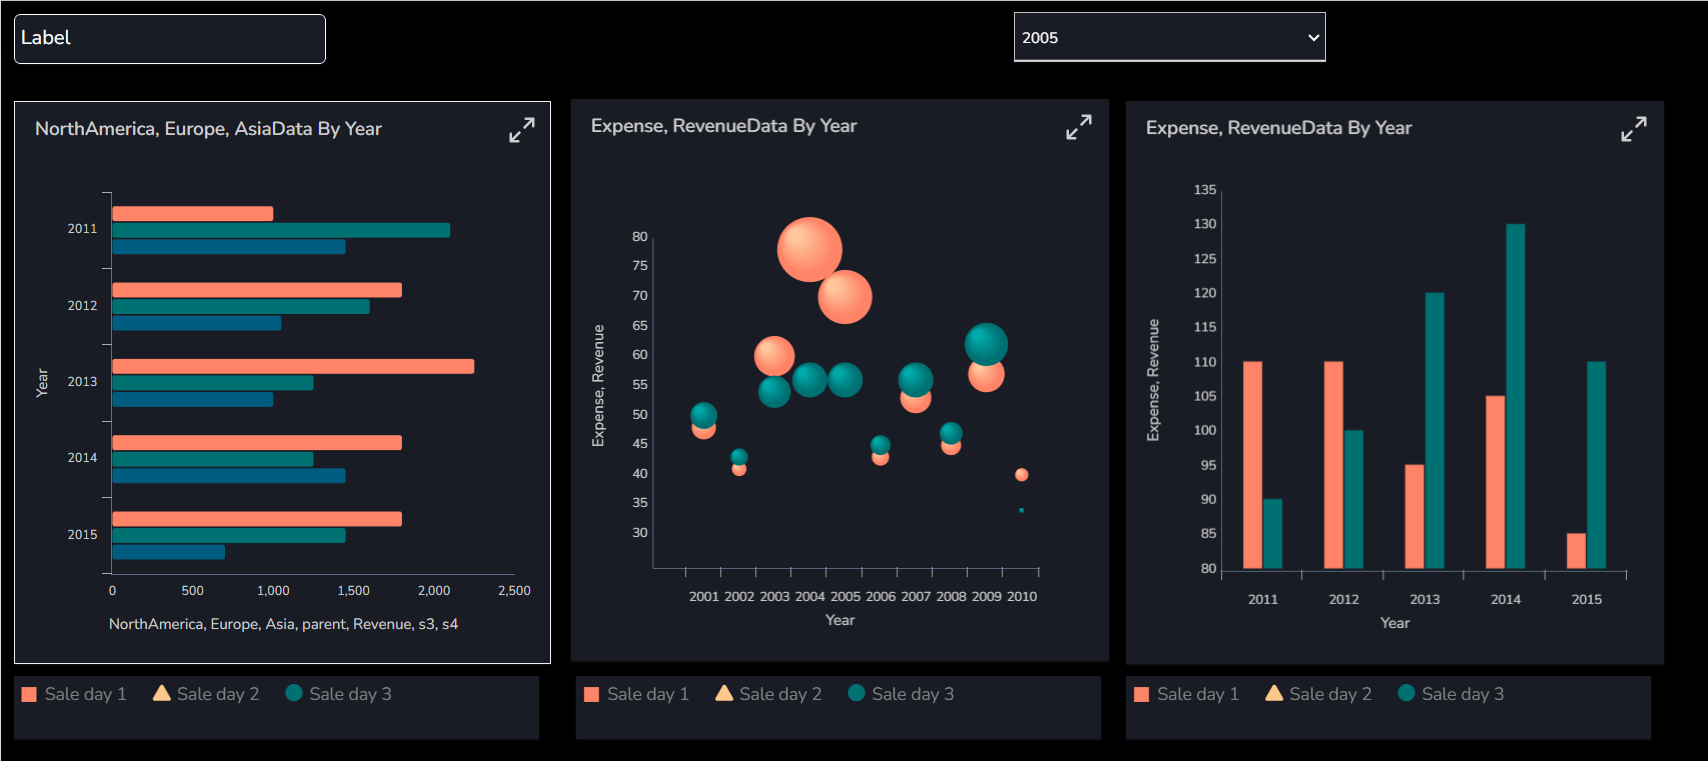
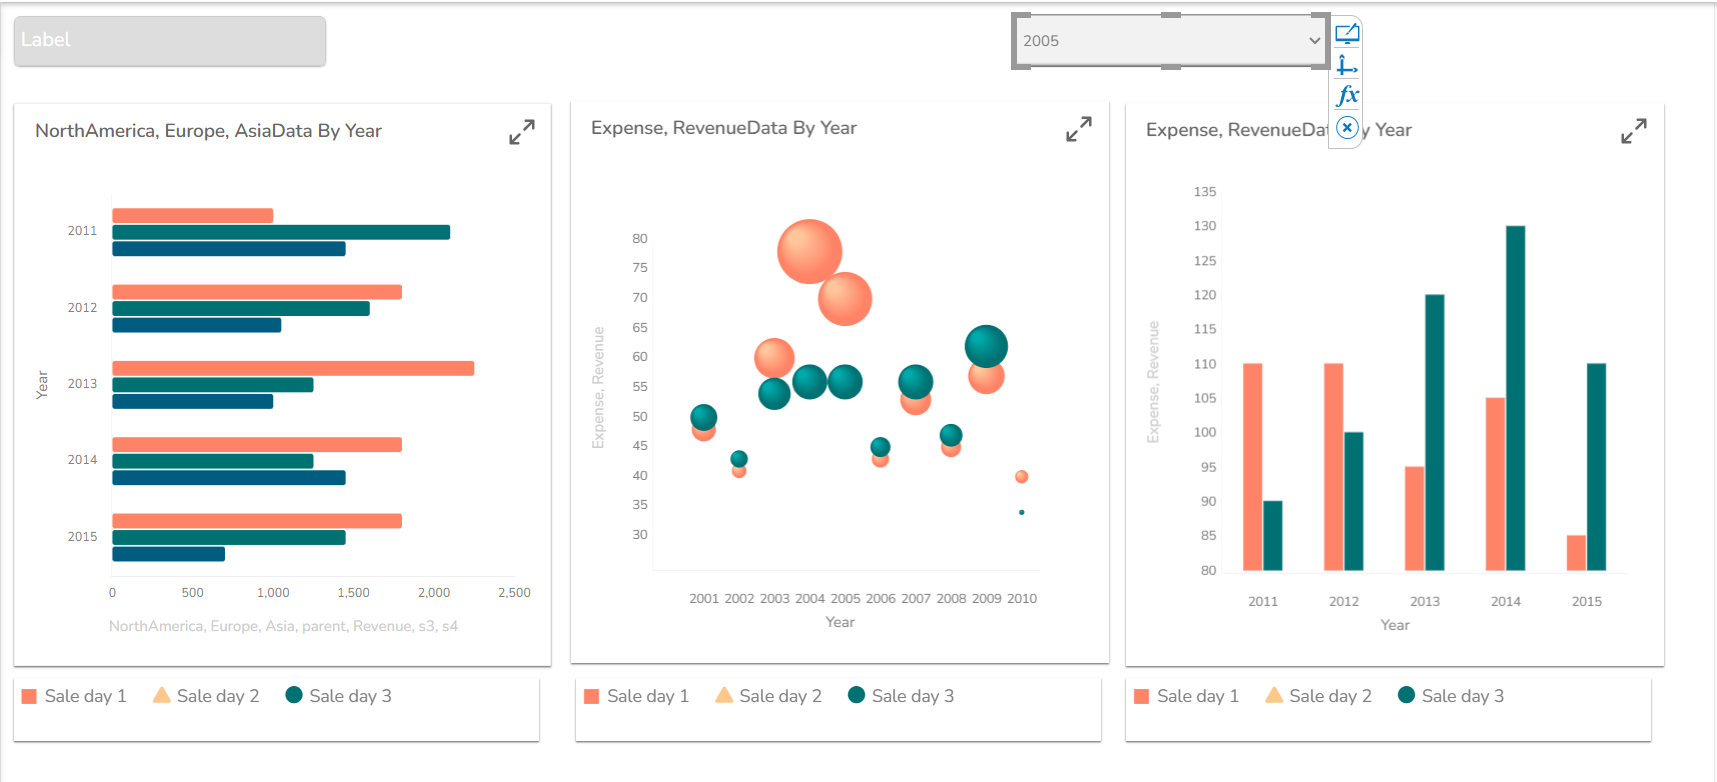
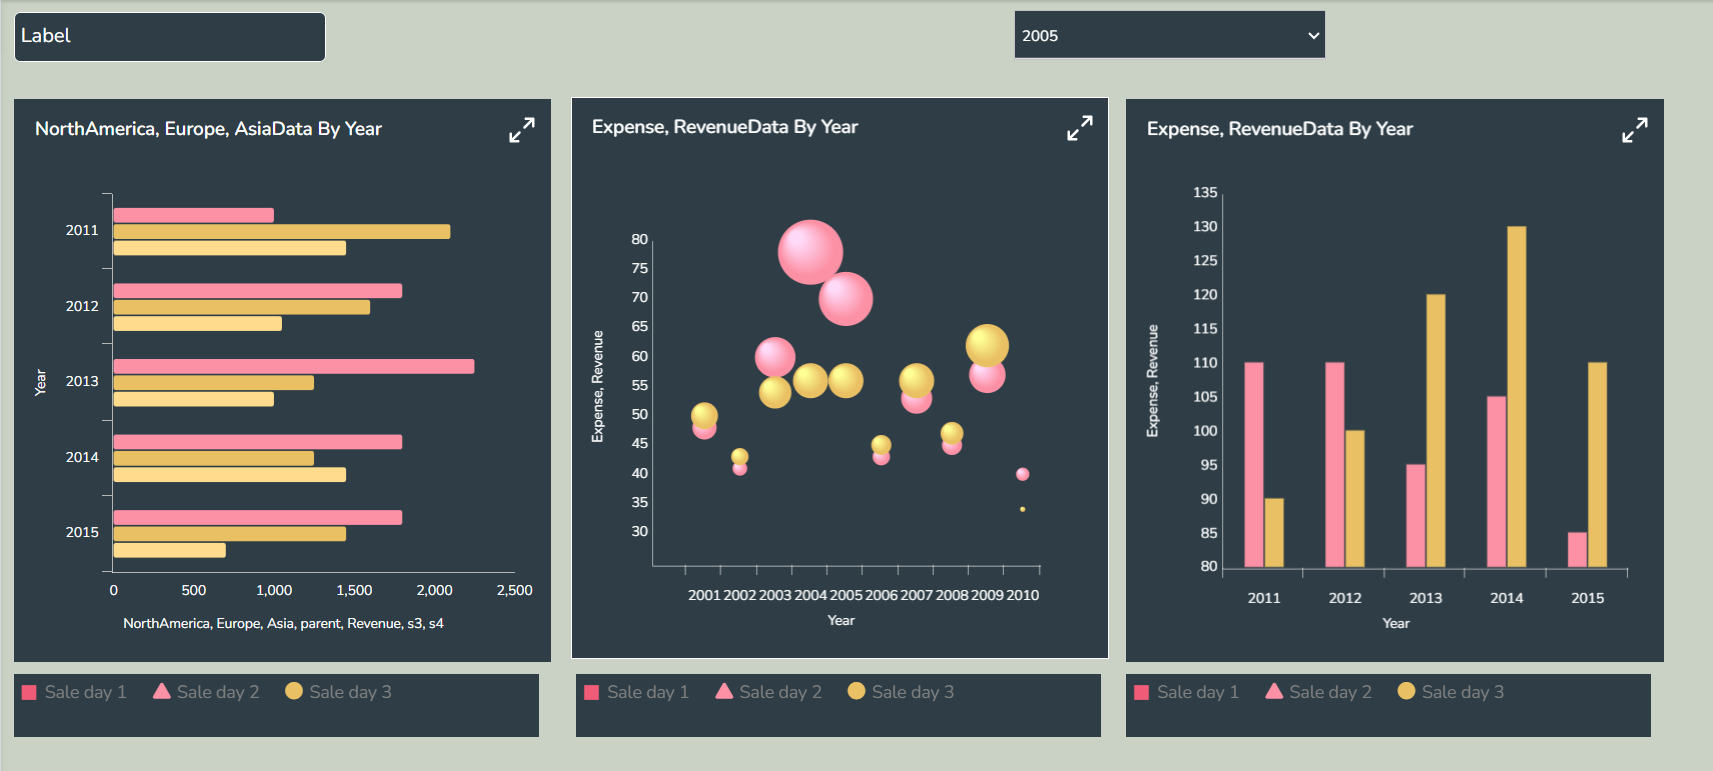
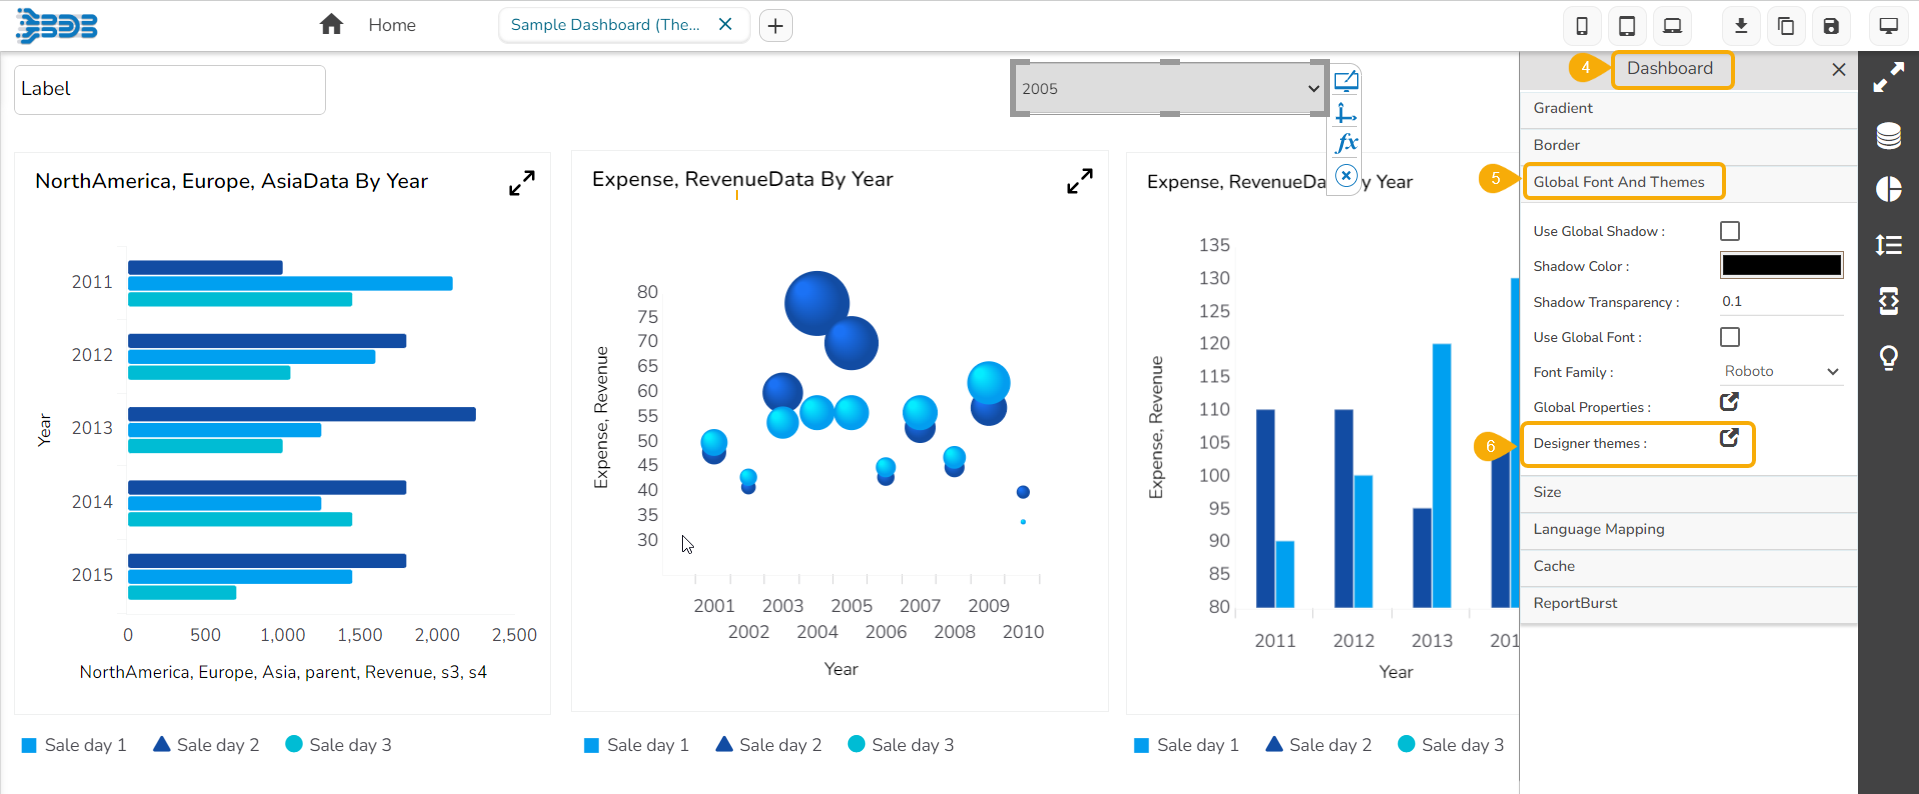
Dashboard Themes
Access the pre-defined dashboard themes to instantly change the visual display of your dashboard.
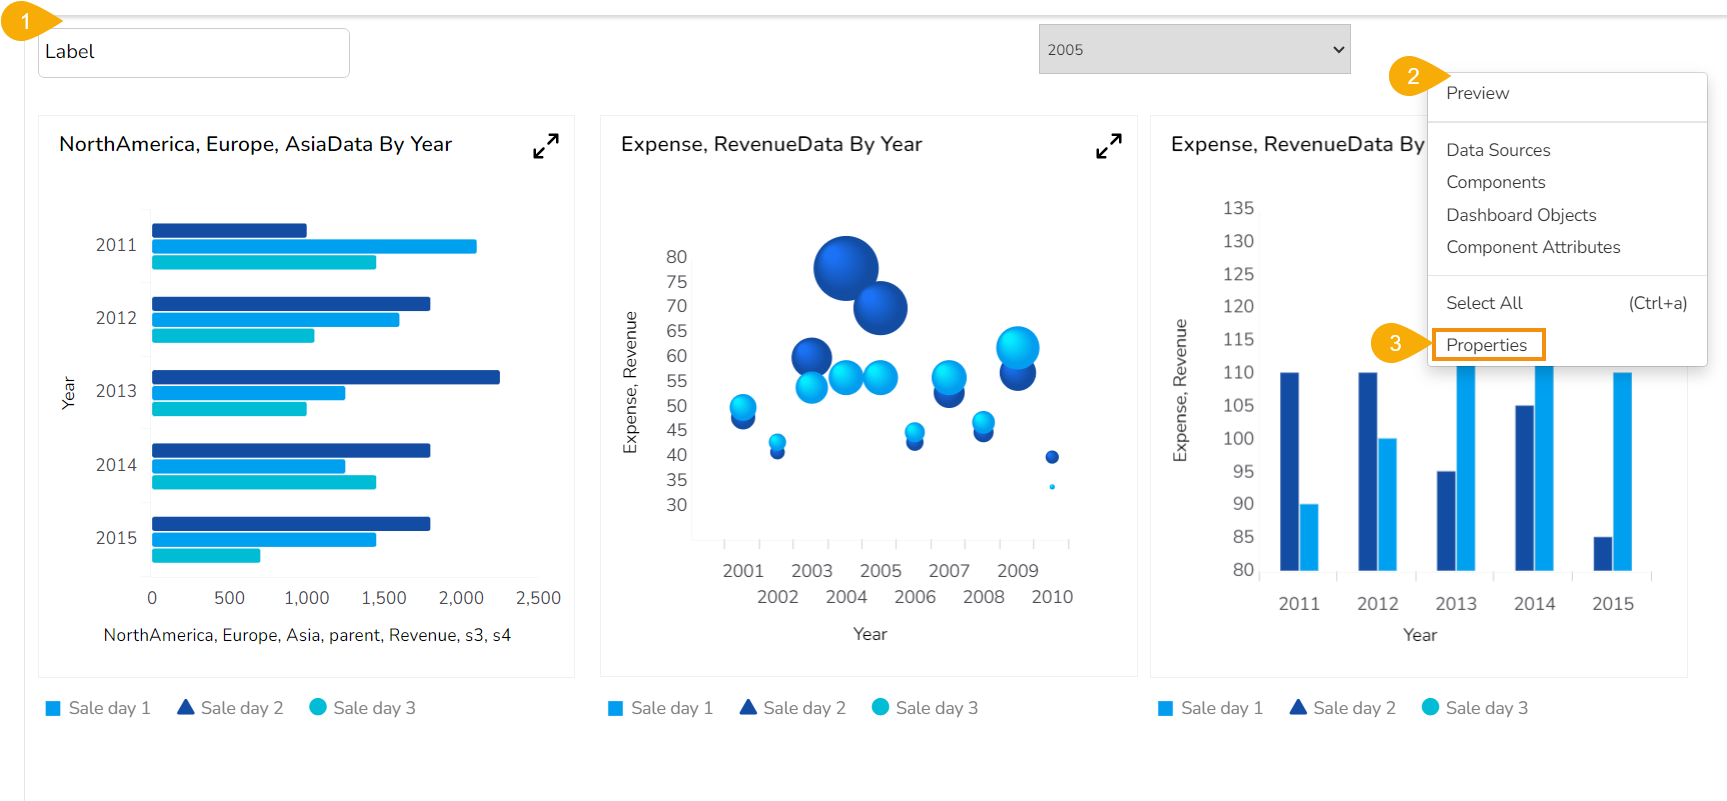
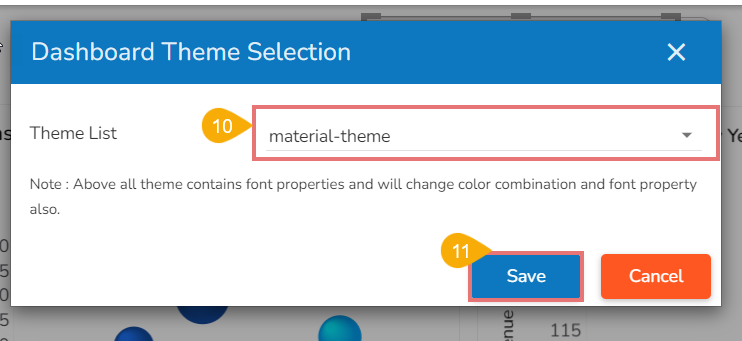
Steps to Apply Various Themes on a Dashboard
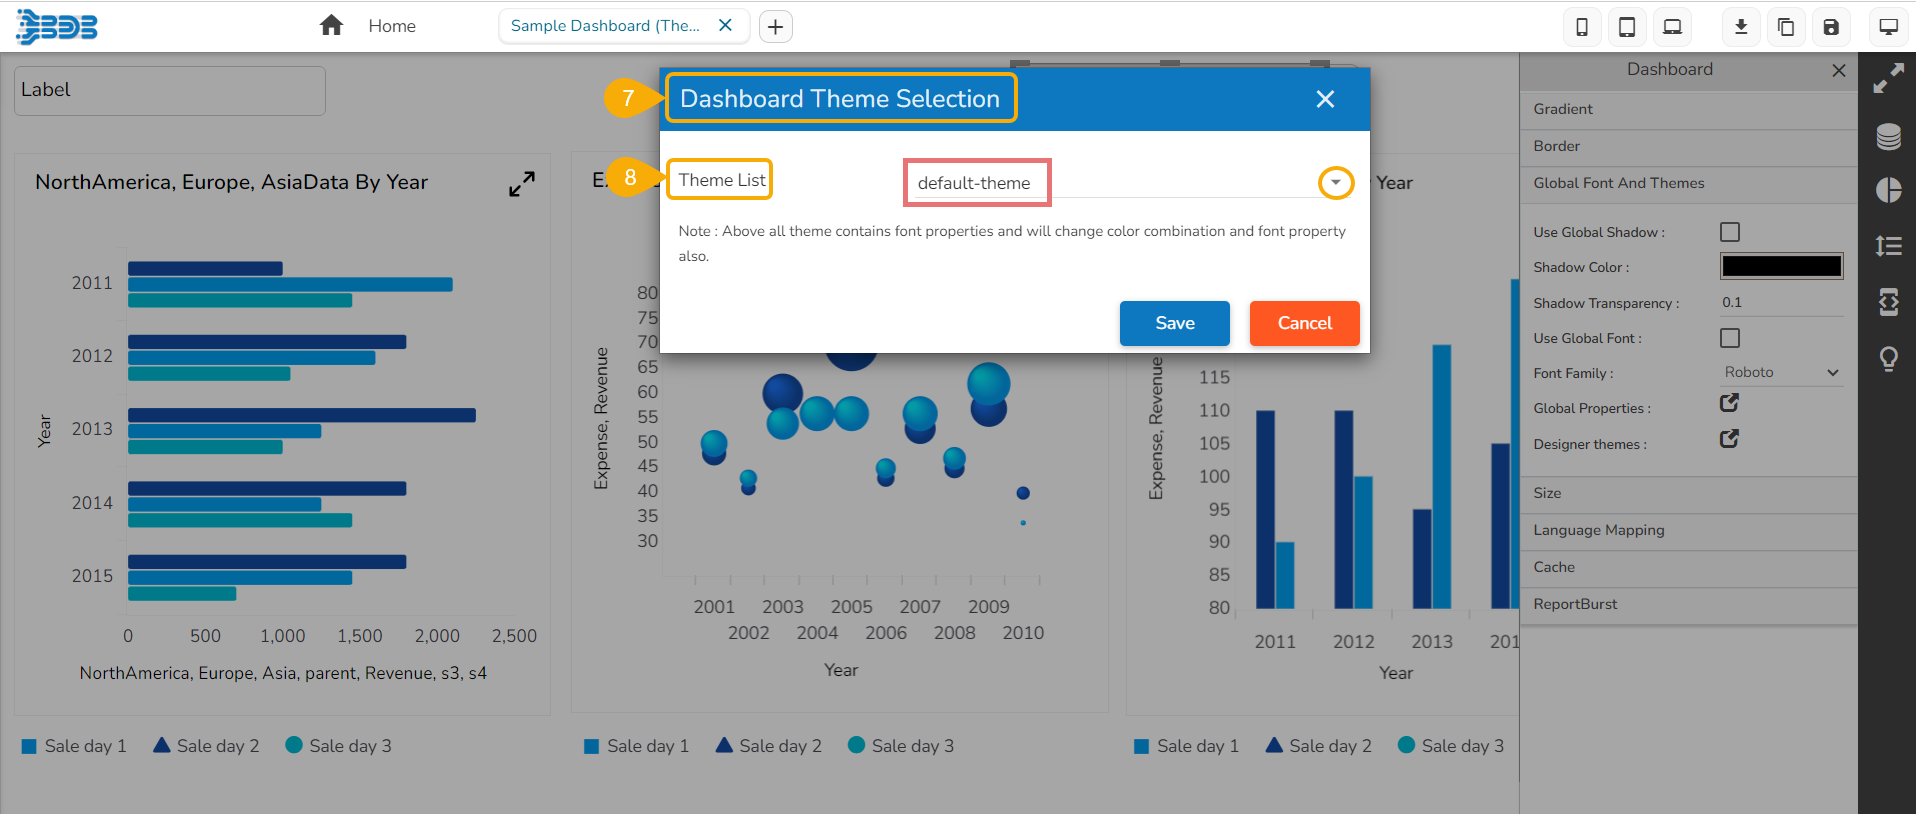
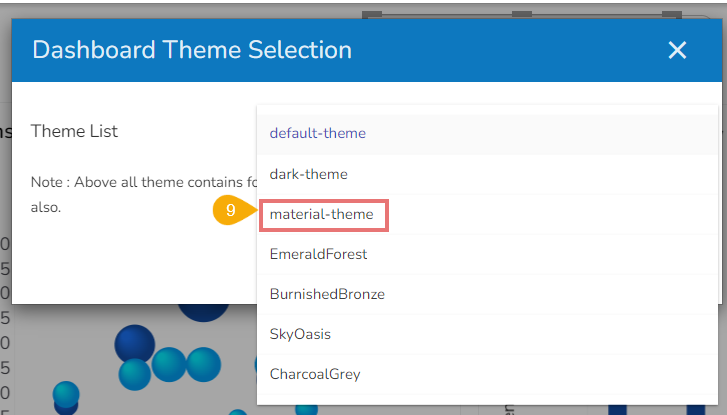
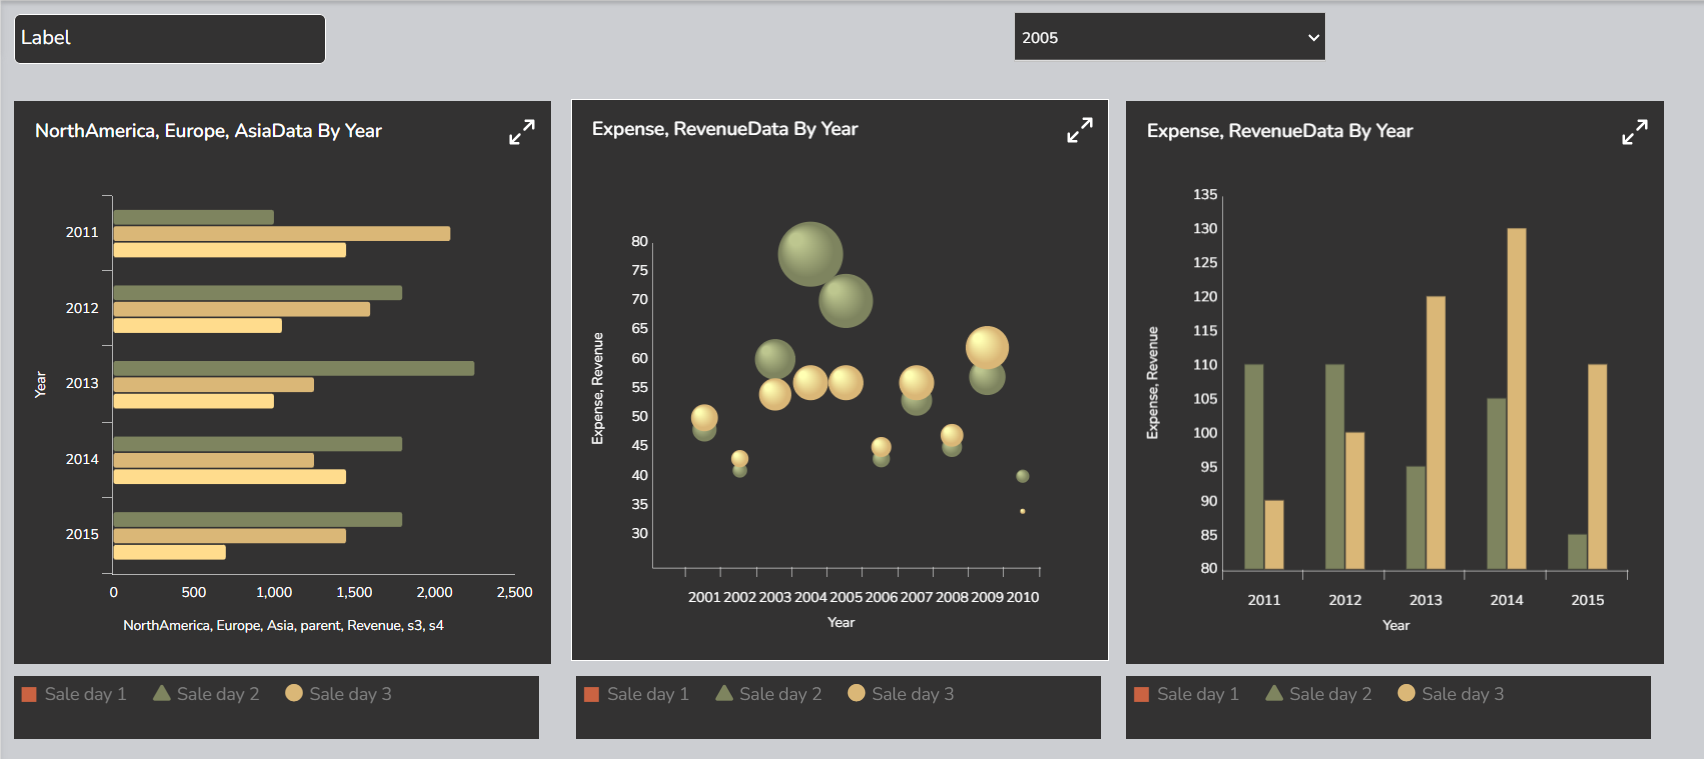
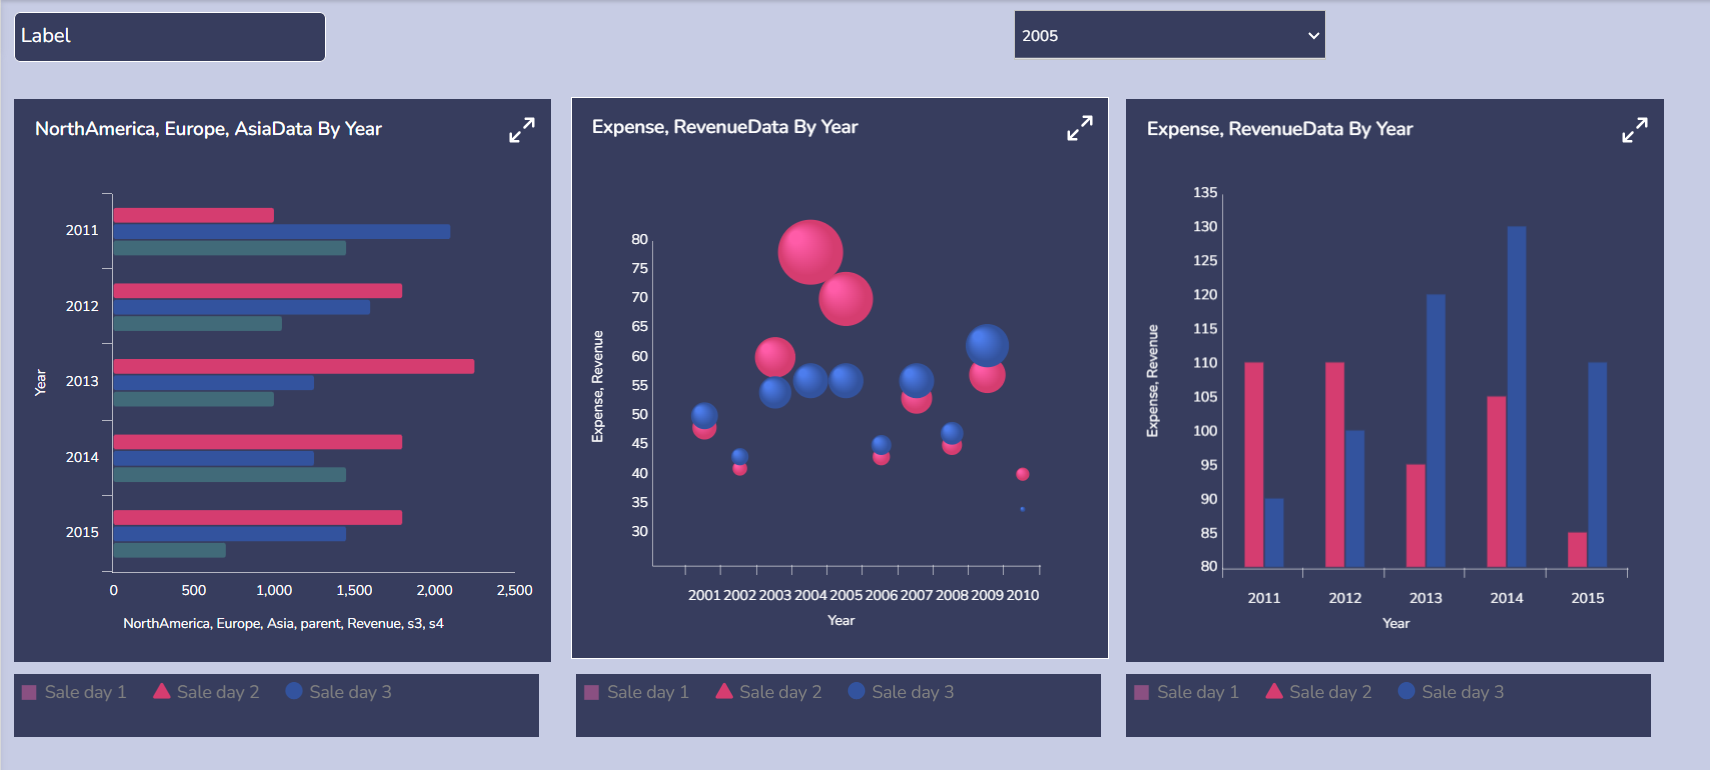
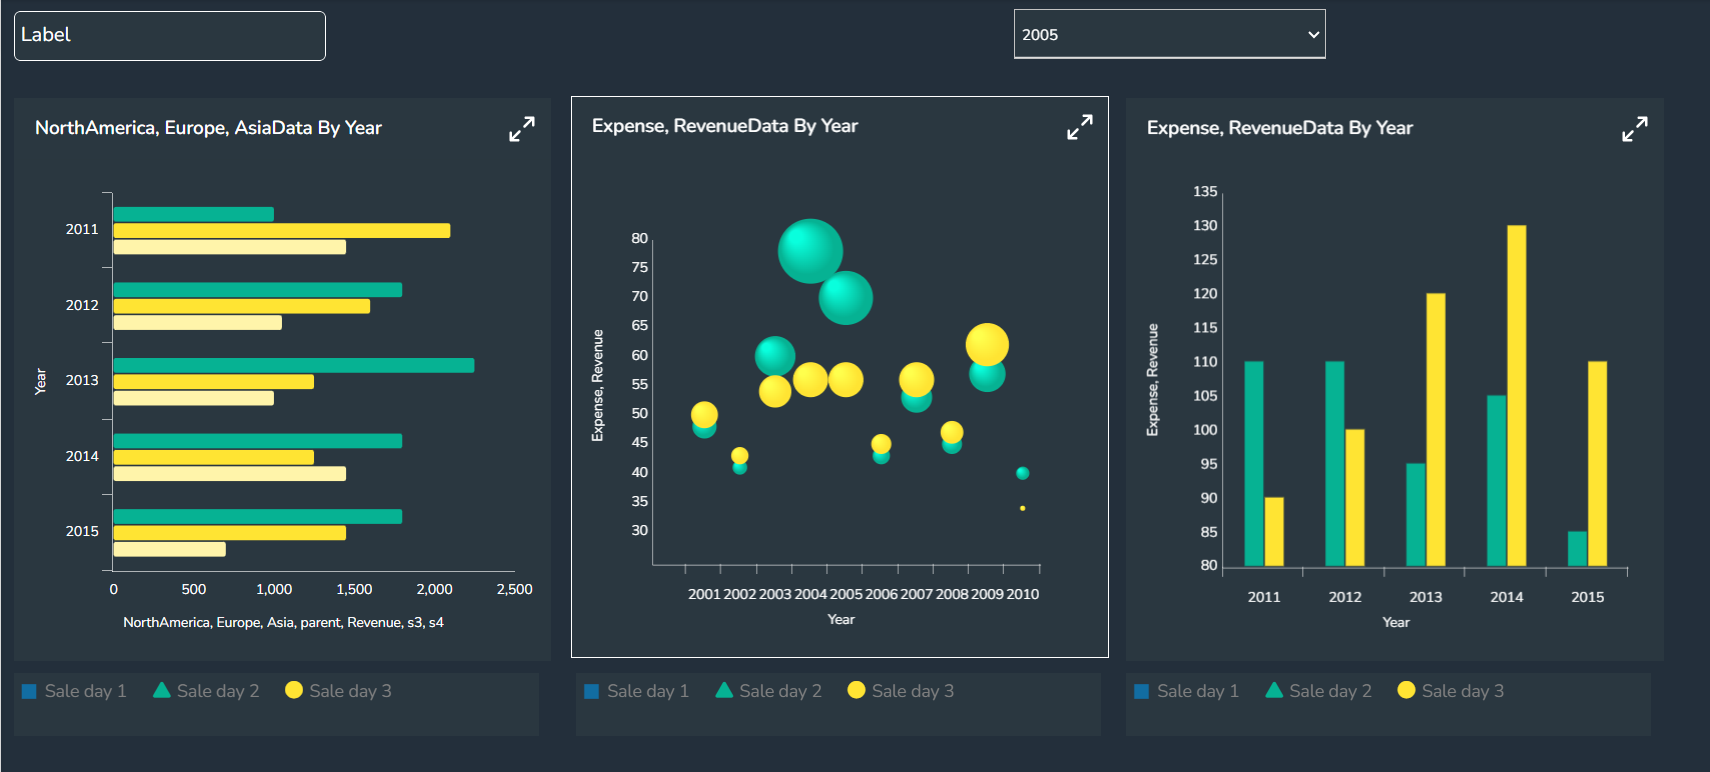
Available Pre-defined Themes