Checkbox
Check out the given walk-through to understand the Check Box filter component.

Check Box is used to filter data on any associated components. Enabling a check box will change the data displayed in the associated components.
Best Situation to use Check Box
To filter data displayed in the associated components
To select multiple items at a time
Default Checkbox Image

Properties of the Check Box filter
General
The user can change the height, width, top and left position of the check box filter component.
The user can set a name to the label and change its font color-style-weight-family from the General Properties.
If the Show Checked option is enabled, then by default a checkmark will get enabled.
Chrome color is used to set the component background, also the user can change its transparency.
A value can be set to the Checked Value so that when the user clicks on the check box, this value will get passed.
Please Note: If initial visibility is not enabled, then the chart won’t be available for the first preview.

Background
The user can get the reflection of the chart by enabling the shadow option.
The user can also change the color and increase/decrease the transparency of the shadow.

Modified Check box filter after changing its properties

Check Box Use Case
The following use case explains how to connect and use a Checkbox with a Data Grid component.
Drag a Data Grid component to the Designer canvas.
Associate a Data Connection with it.

Drag a Check Box component from the Filter group to the canvas.

Open the Check box Properties, provide the necessary properties, and apply them.
Provide the text for the Label.
Provide the Checked Value.
Keep the Unchecked Value blank.

Use the component object page to write the required script at the component level.

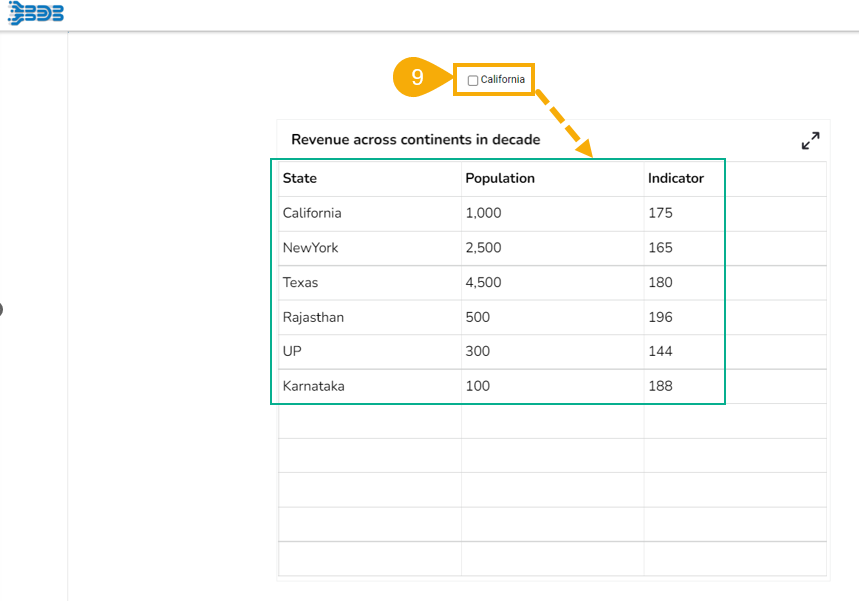
Configure the Condition tab by providing a field value for the conditions (the field State is chosen in the given image).

Click the Preview icon to preview the Dashboard.

Use a check mark in the given box to display the Checked Value in the chart.

Uncheck the Check Box to display the Unchecked Value in the chart (In this case, no value has been assigned as Unchecked Value so it will display all the records).