# Model Summary
*The Model Summary/ Run Summary displays the basic information about the trained top model.*
The Model Summary/ Run Summary will display the basic information about the trained top model. It opens by default by clicking the View Explanation option for the selected model.
The ***Model Summary*** page displays the details based on the selected Algorithm types:
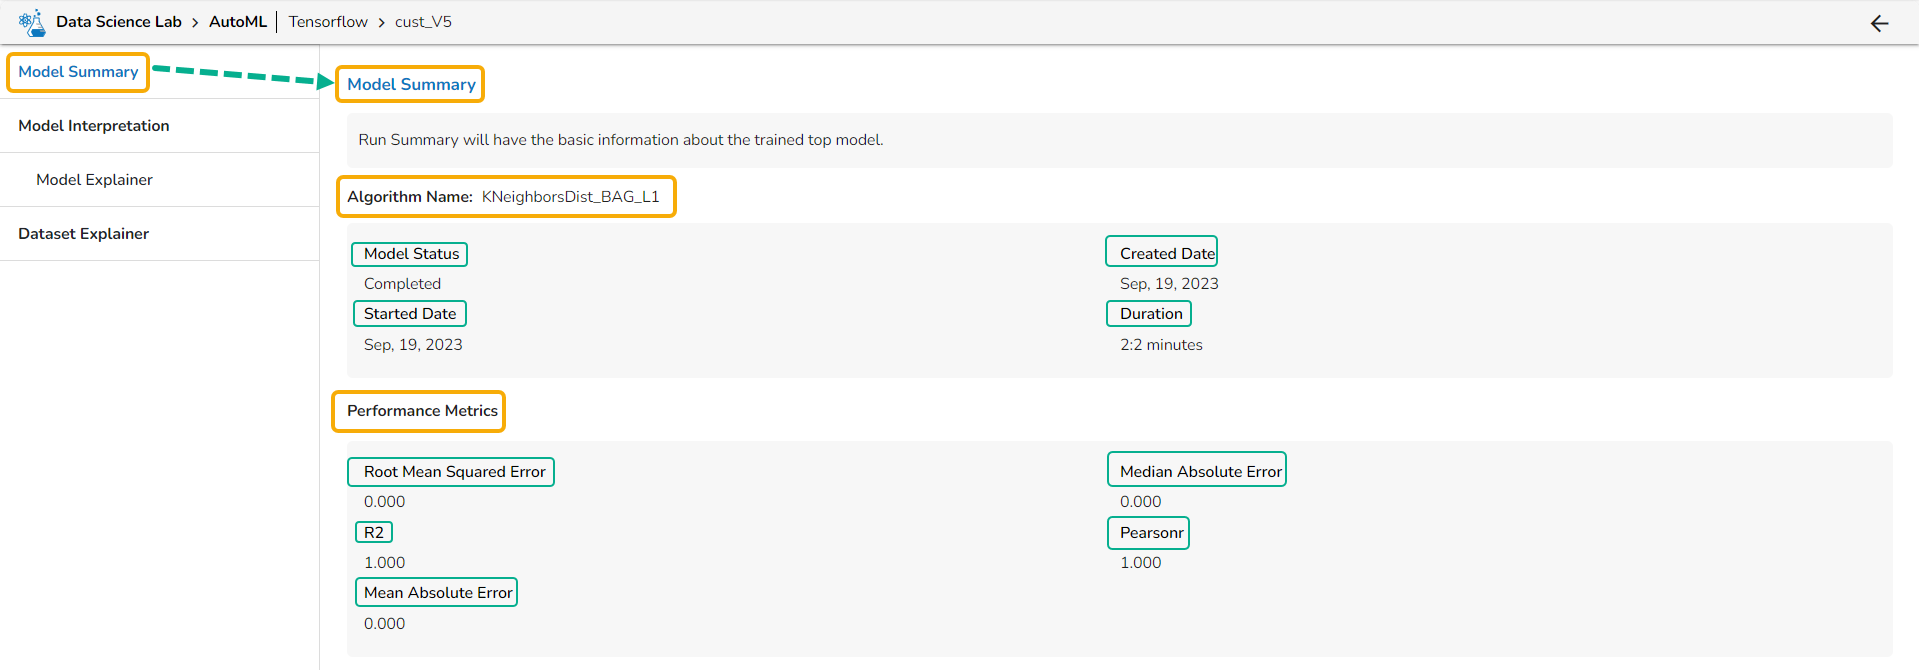
### Summary Details for a Regression Model
* **Algorithm Name**
* Model Status
* Created Date
* Started Date
* Duration
* **Performance Metrics** are described by displaying the below-given metrics:
* **Root Mean Squared Error (RMSE)**: RMSE is the square root of the mean squared error. It is more interpretable than MSE and is often used to compare models with different units.
* **Median Absolute Error (MAE)**: MAE is a performance metric for regression models that measures the median of the absolute differences between the predicted values and the actual values.
* **R-squared (R2)**: R-squared measures the proportion of the variance in the dependent variable that is explained by the independent variables in the model. It is a popular metric for linear regression problems.
* **Pearsonr**: Pearsonr is a function in the SciPy. Stats module that calculates the Pearson correlation coefficient and its p-value between two arrays of data. The Pearson correlation coefficient is a measure of the linear relationship between two variables.
* **Mean Absolute Error (MAE)**: MAE measures the average absolute difference between the predicted values and the actual values in the dataset. It is less sensitive to outliers than MSE and is a popular metric for regression problems.
Displaying the Model Summary tab for a Regression Model
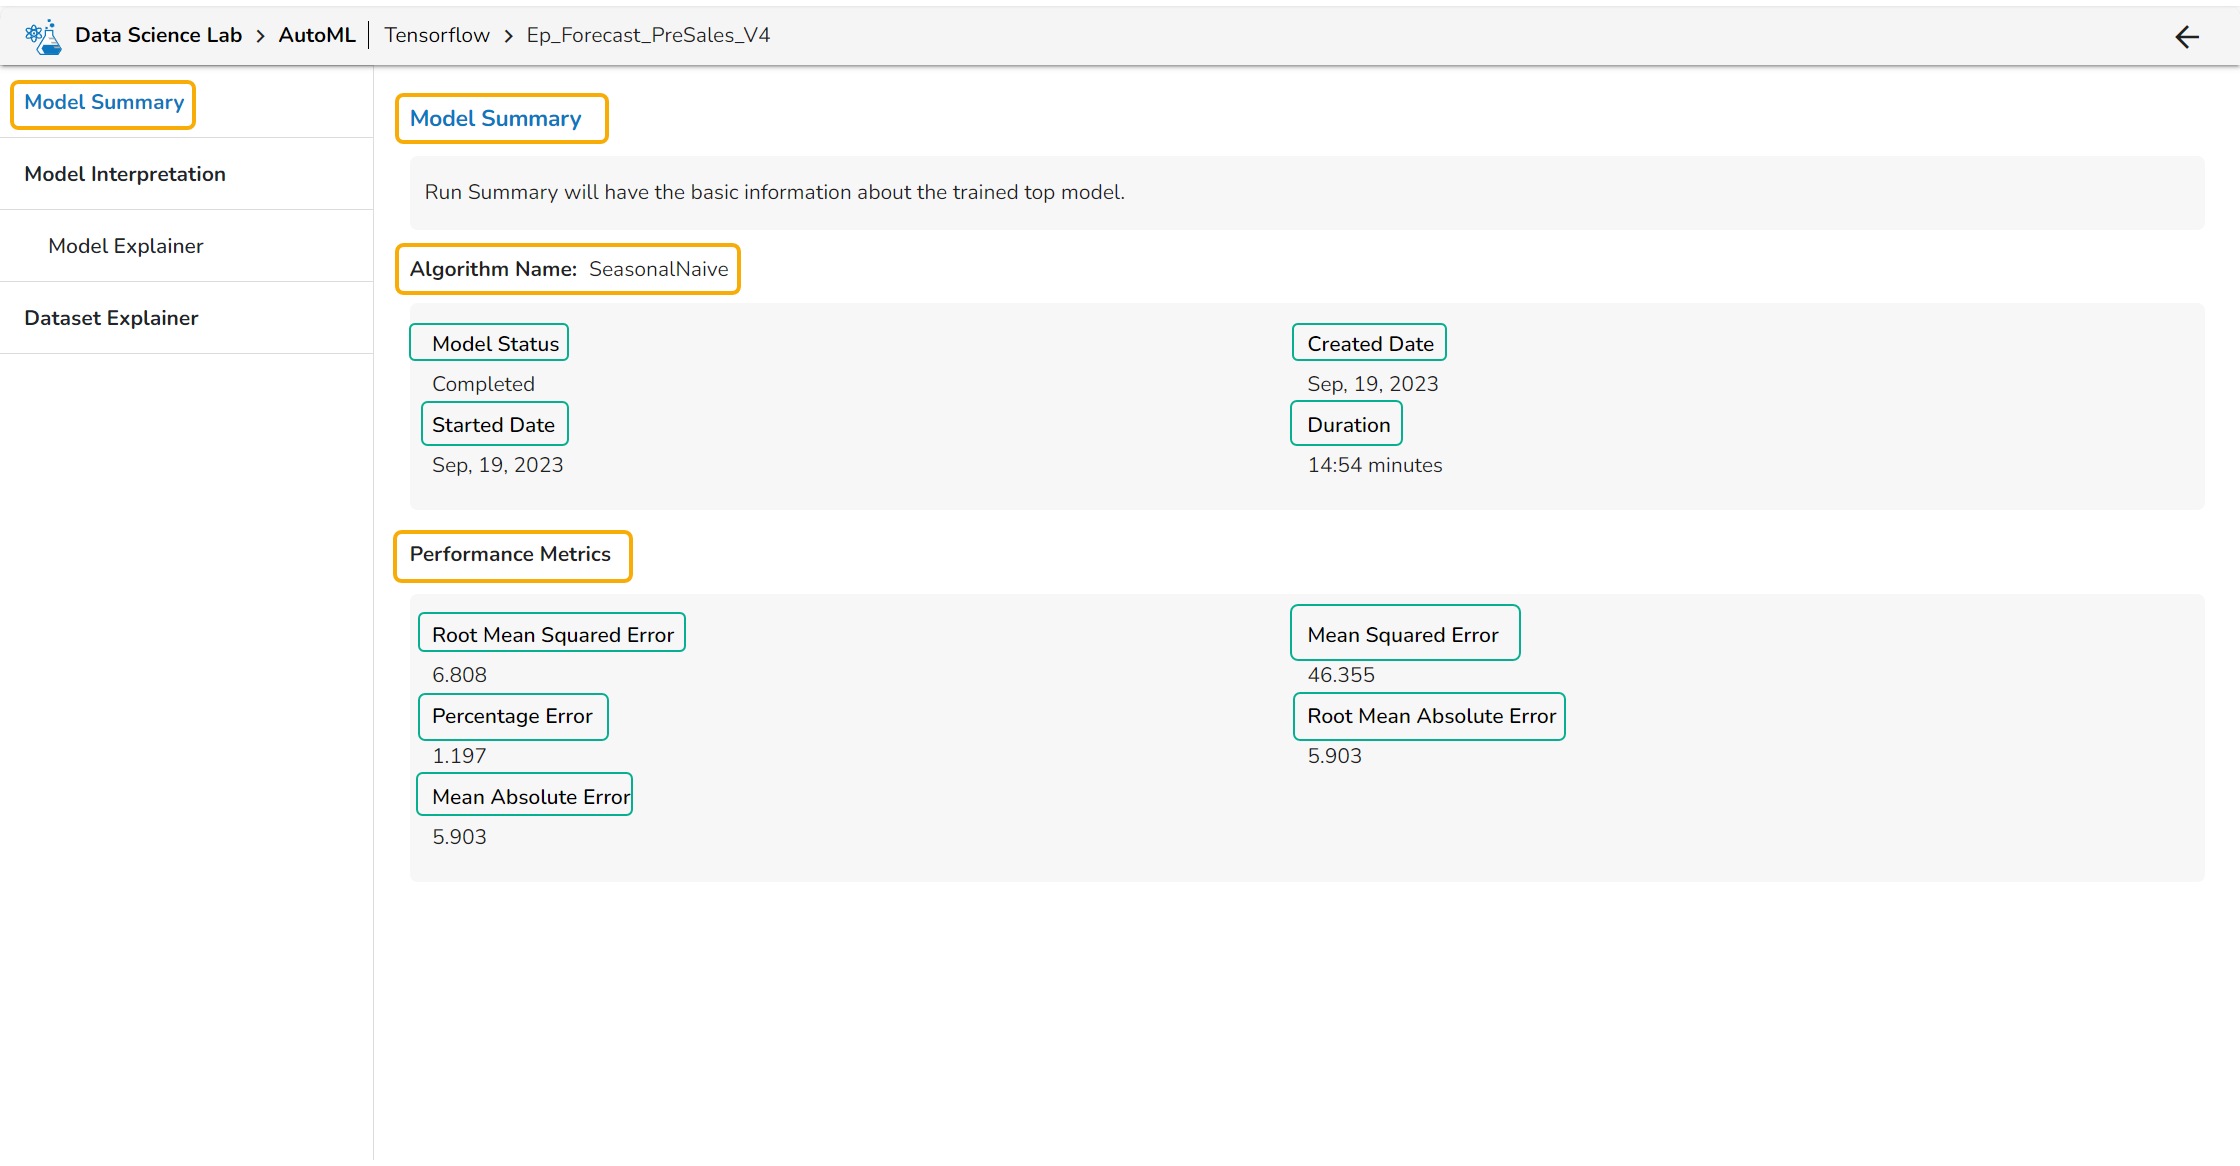
### Summary Details for a Forecasting Model
* **Algorithm Name**
* Model Status
* Created Date
* Started Date
* Duration
* **Performance Metrics** are described by displaying the below-given metrics:
* **Root Mean Squared Error (RMSE)**: RMSE is the square root of the mean squared error. It is more interpretable than MSE and is often used to compare models with different units.
* **Mean Squared Error (MSE)**: MSE measures the average squared difference between the predicted values and the actual values in the dataset. It is a popular metric for regression problems and is sensitive to outliers.
* **Percentage Error (PE)**: PE can provide insight into the relative accuracy of the predictions. It tells the user how much, on average, the predictions deviate from the actual values in percentage terms.
* **Root Mean Absolute Error**: RMSE is the square root of the mean squared error. It is more interpretable than MSE and is often used to compare models with different units.
* **Mean Absolute Error (MAE)**: MAE measures the average absolute difference between the predicted values and the actual values in the dataset. It is less sensitive to outliers than MSE and is a popular metric for regression problems.
Displaying the Model Summary tab for a Forecasting Model
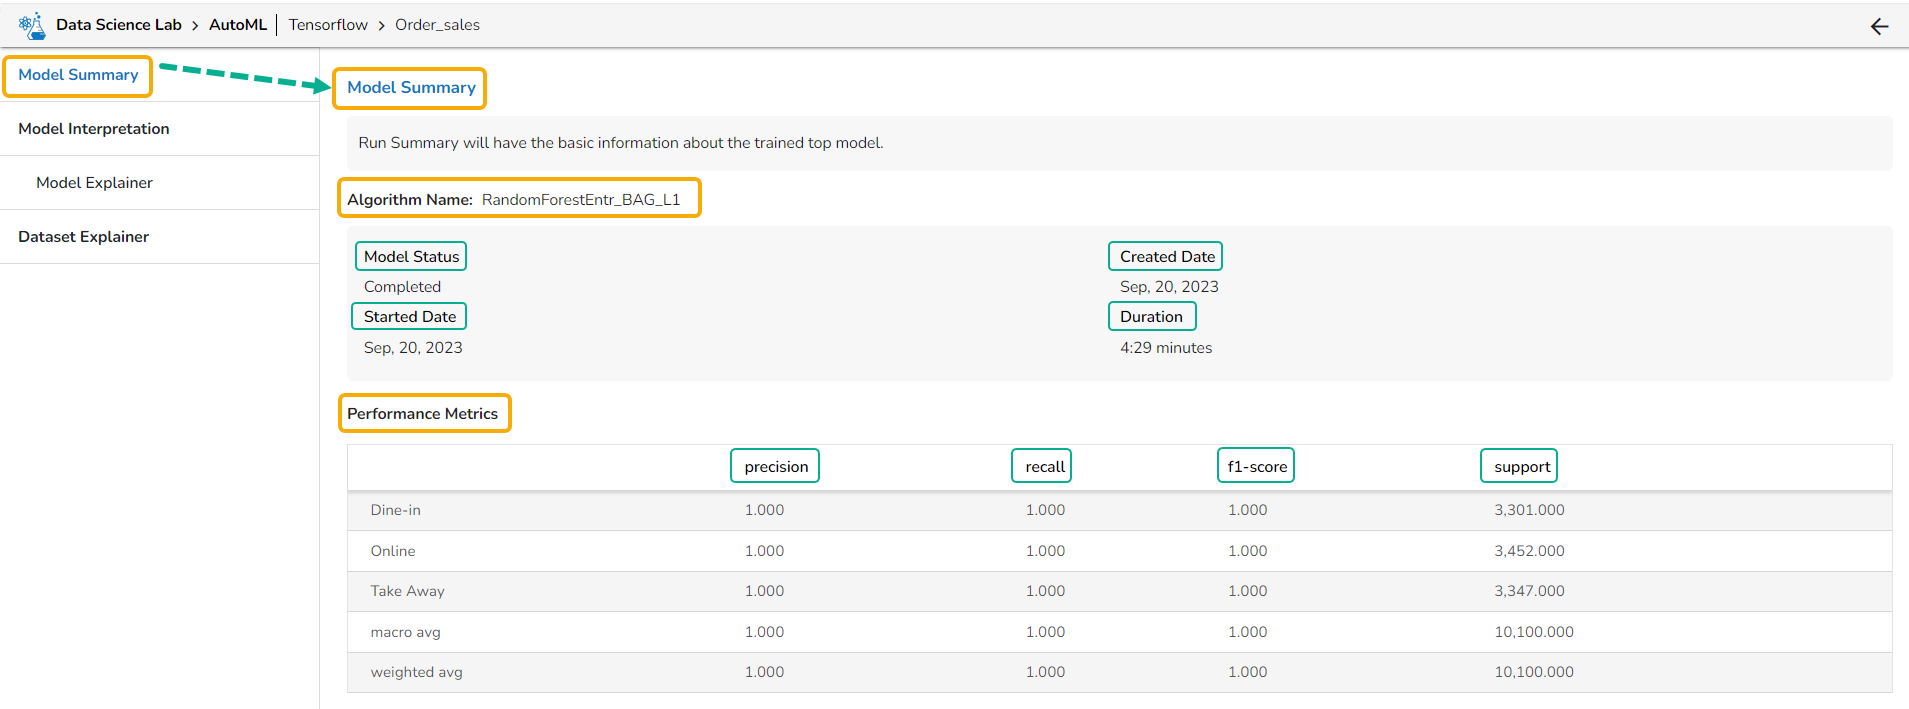
### Summary Details for a Classification Model
* Algorithm Name
* Model Status
* Created Date
* Started Date
* Duration
* **Performance Metrics** are described by displaying the below-given metrics:
* **Precision:** Precision is the percentage of correctly classified positive instances out of all the instances that were predicted as positive by the model. In other words, it measures how often the model correctly predicts the positive class.
* **Recall**: Recall is the percentage of correctly classified positive instances out of all the actual positive instances in the dataset. In other words, it measures how well the model.
* **F1-score**: The F1-score is the harmonic mean of precision and recall. It is a balance between precision and recall and is a better metric than accuracy when the dataset is imbalanced.
* **Support**: Support is the number of instances in each class in the dataset. It can be used to identify imbalanced datasets where one class has significantly fewer instances than the others.
Displaying Model Summary tab for a Classification Model