Classification Model Explainer
This page provides model explainer dashboards for Classification Models.
Check out the given walk-through to understand the Model Explainer dashboard for the Classification models.
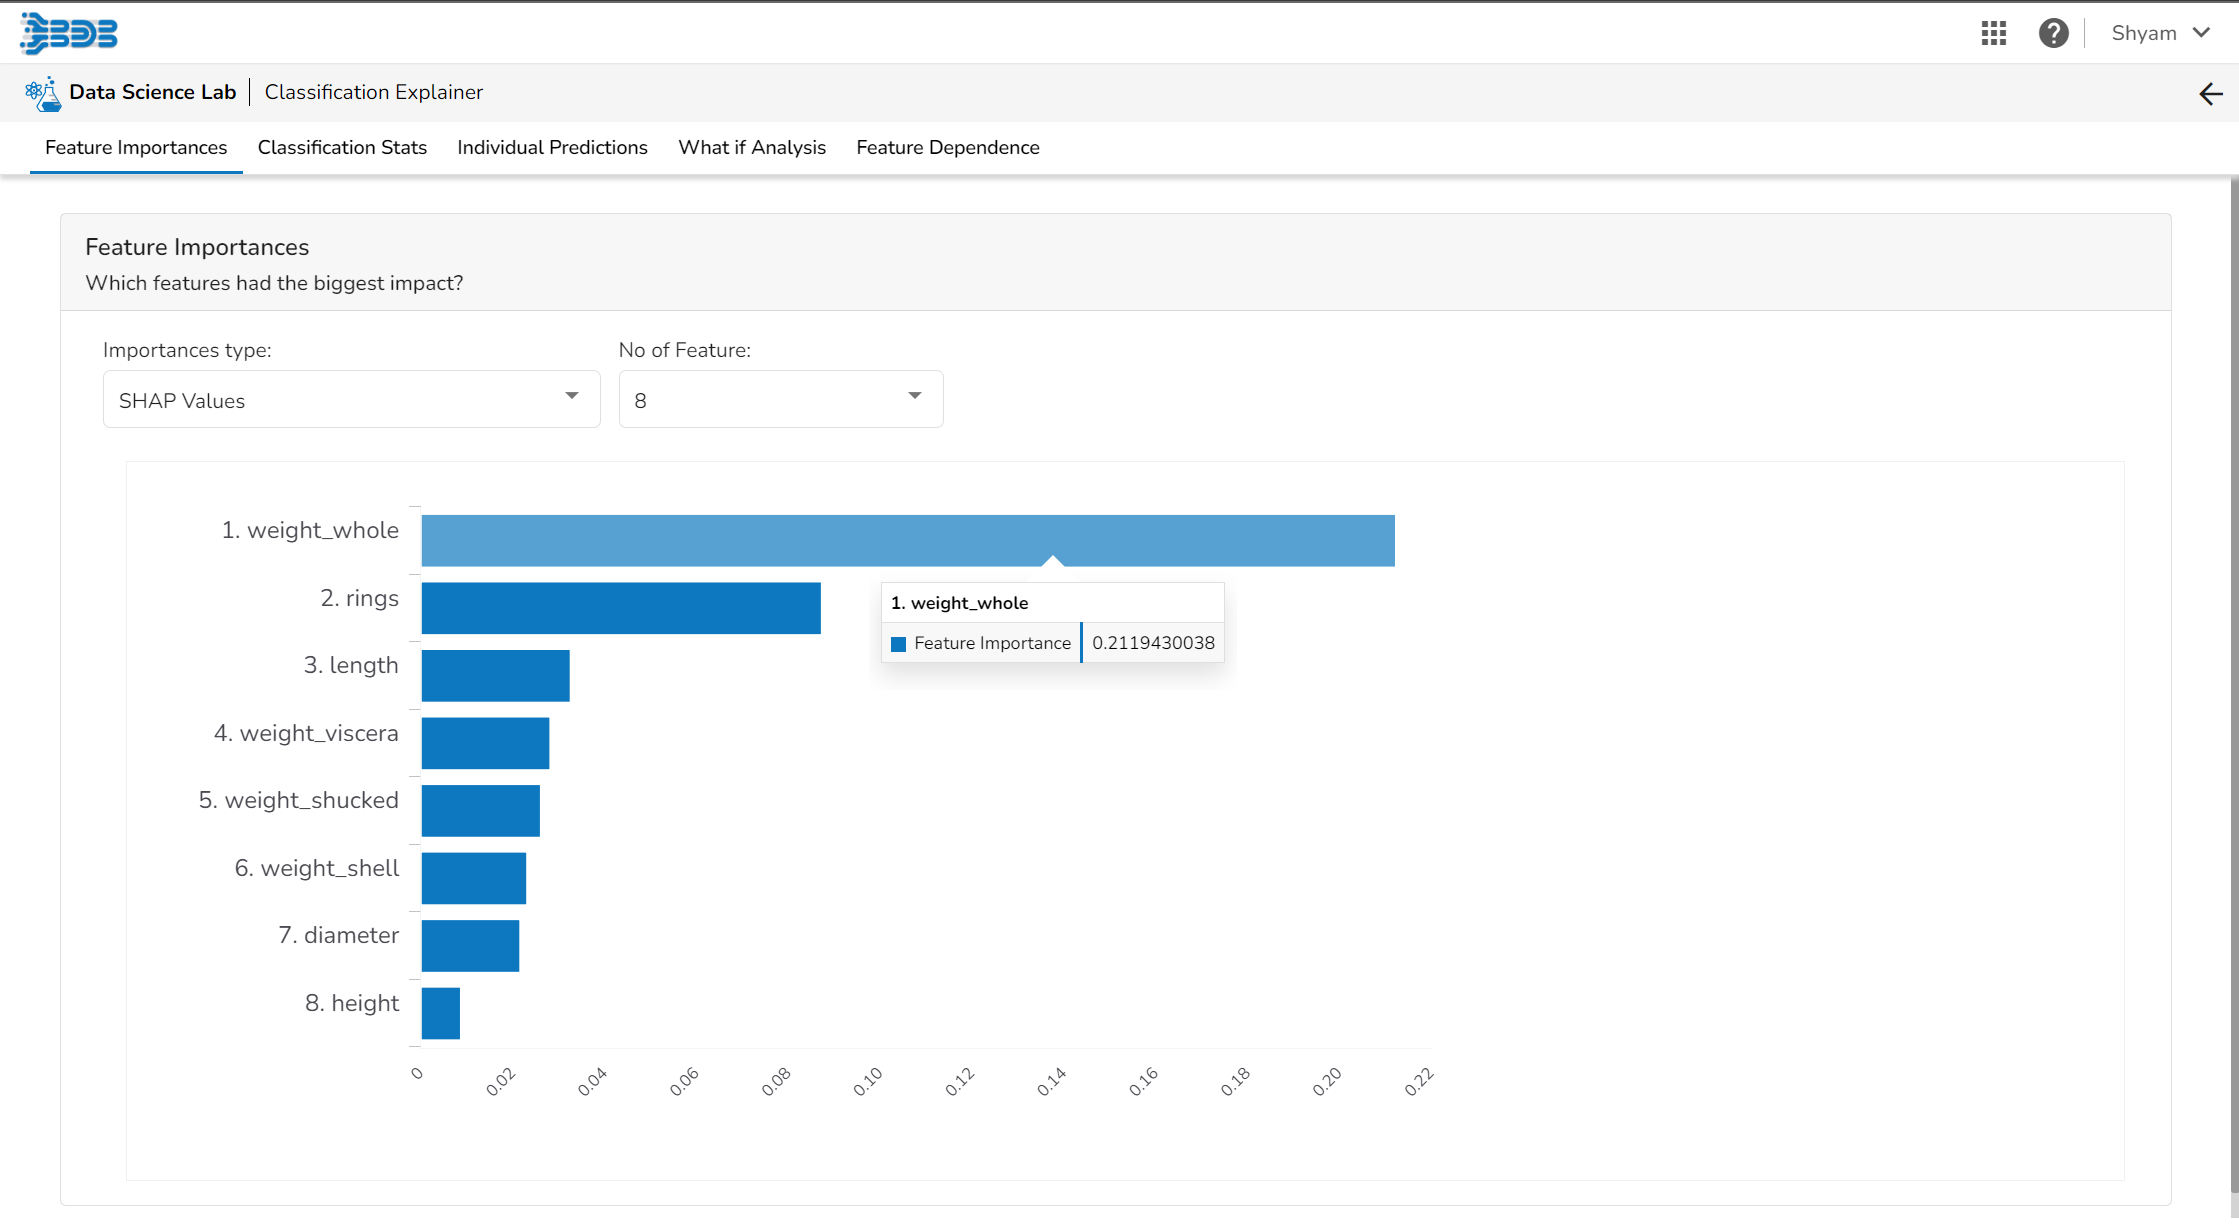
Feature Importance
This table shows the contribution each feature has had on prediction for a specific observation. The contributions (starting from the population average) add up to the final prediction. This allows you to explain exactly how each prediction has been built up from all the individual ingredients in the model.
Classification Stats
This tab provides various stats regarding the Classification model.
It includes the following information:
Global cutoff
Select a model cutoff such that all predicted probabilities higher than the cutoff will be labeled positive and all predicted probabilities lower than the cutoff will be labeled negative. The user can also set the cutoff as a percentile of all observations. By setting the cutoff it will automatically set the cutoff in the multiple other connected components.

Model Performance Metrics
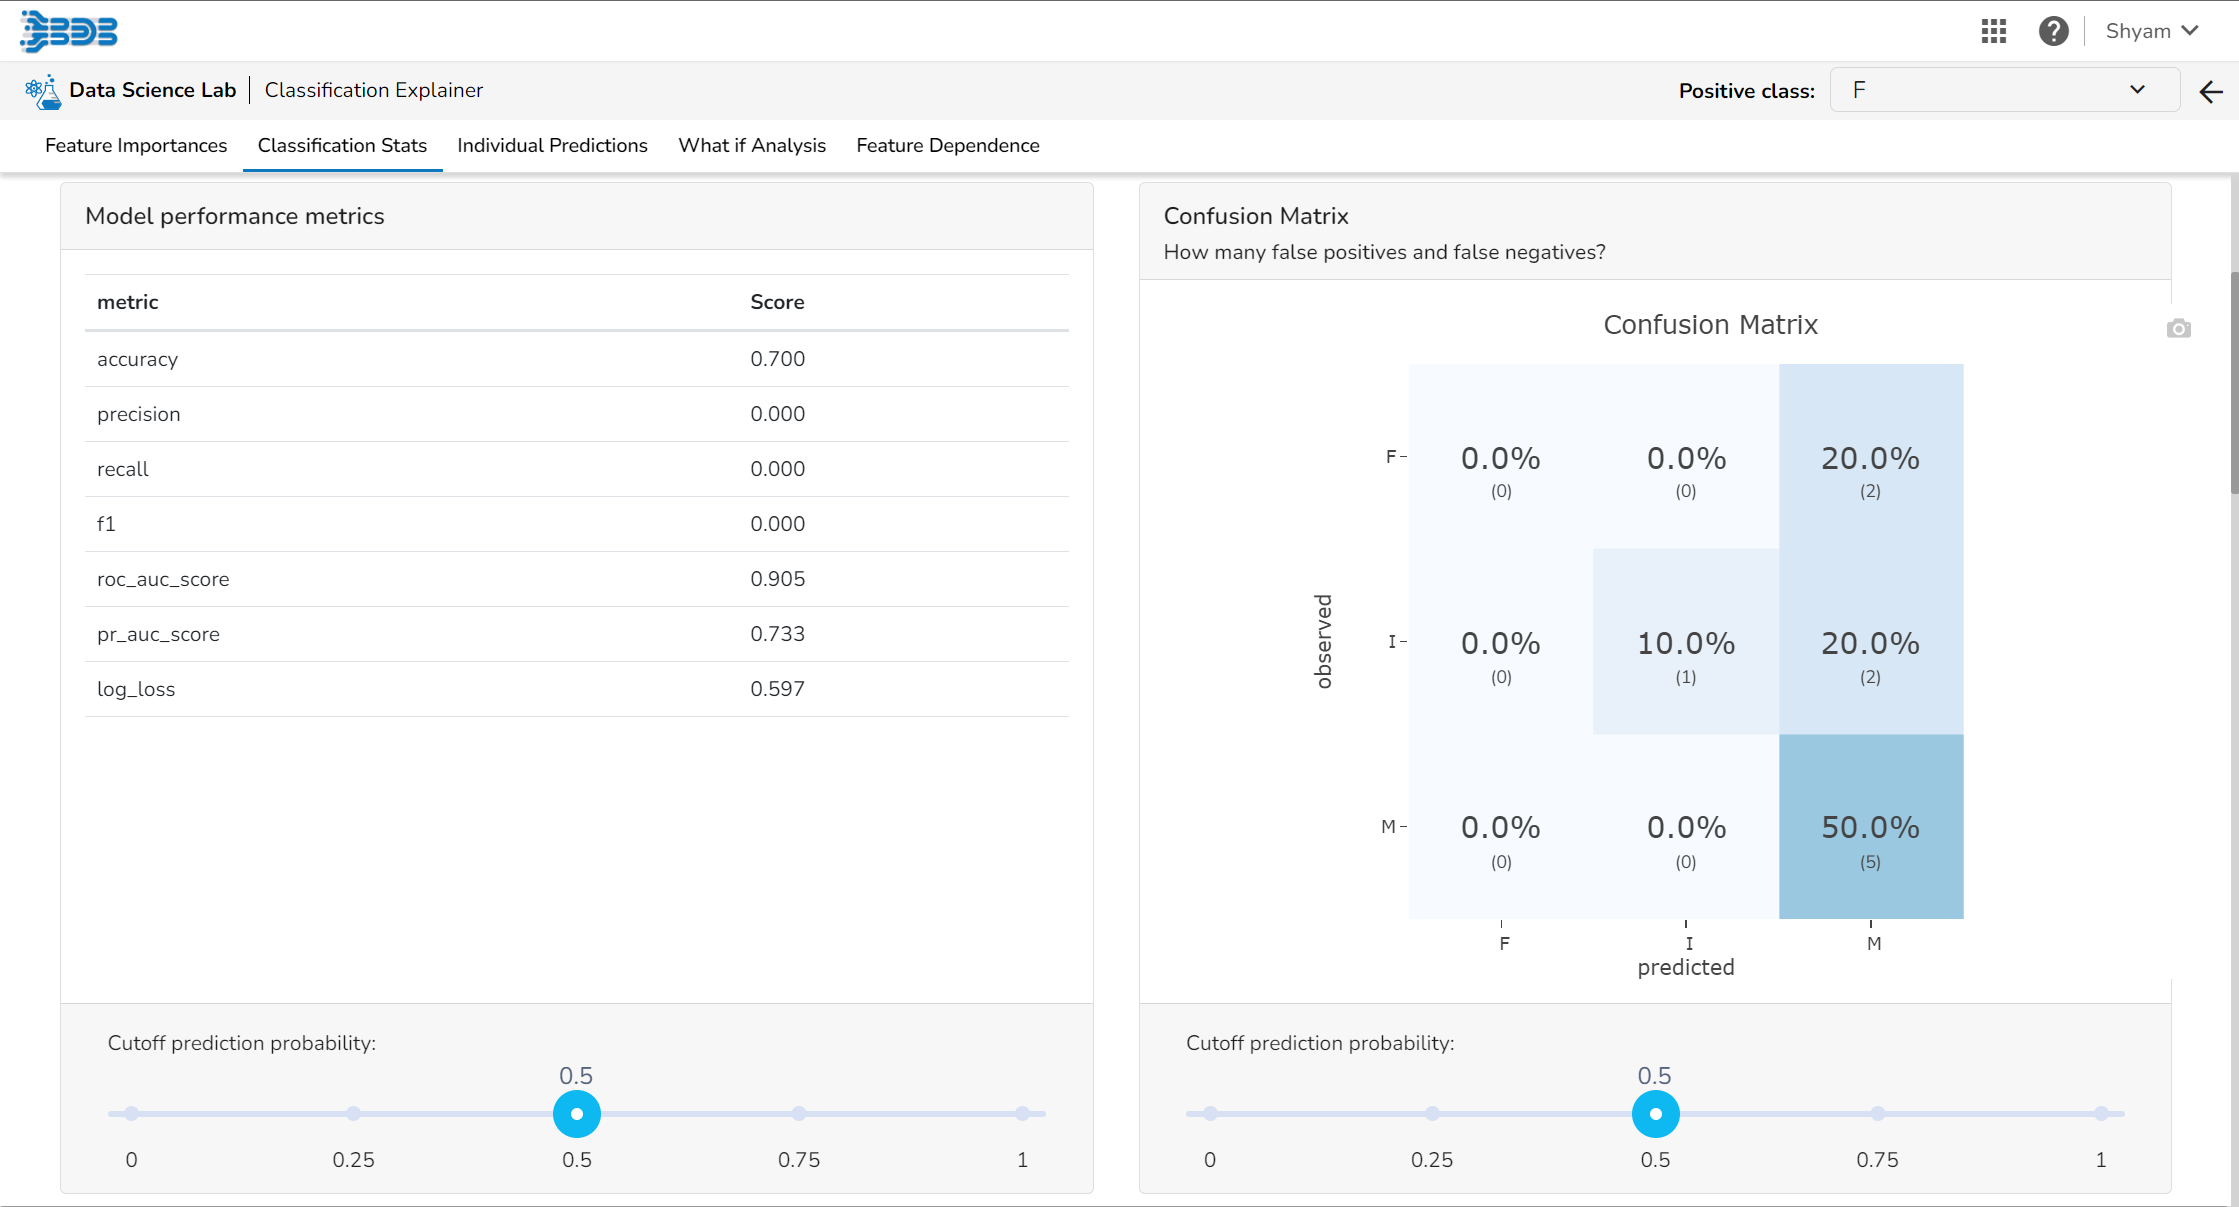
It displays a list of various performance metrics.
Confusion Matrix
The Confusion matrix/ shows the number of true negatives (predicted negative, observed negative), true positives (predicted positive, observed positive), false negatives (predicted negative but observed positive), and false positives (predicted positive but observed negative). The number of false negatives and false positives determine the costs of deploying an imperfect model. For different cut-offs, the user will get a different number of false positives and false negatives. This plot can help you select the optimal cutoff.
Precision Plot
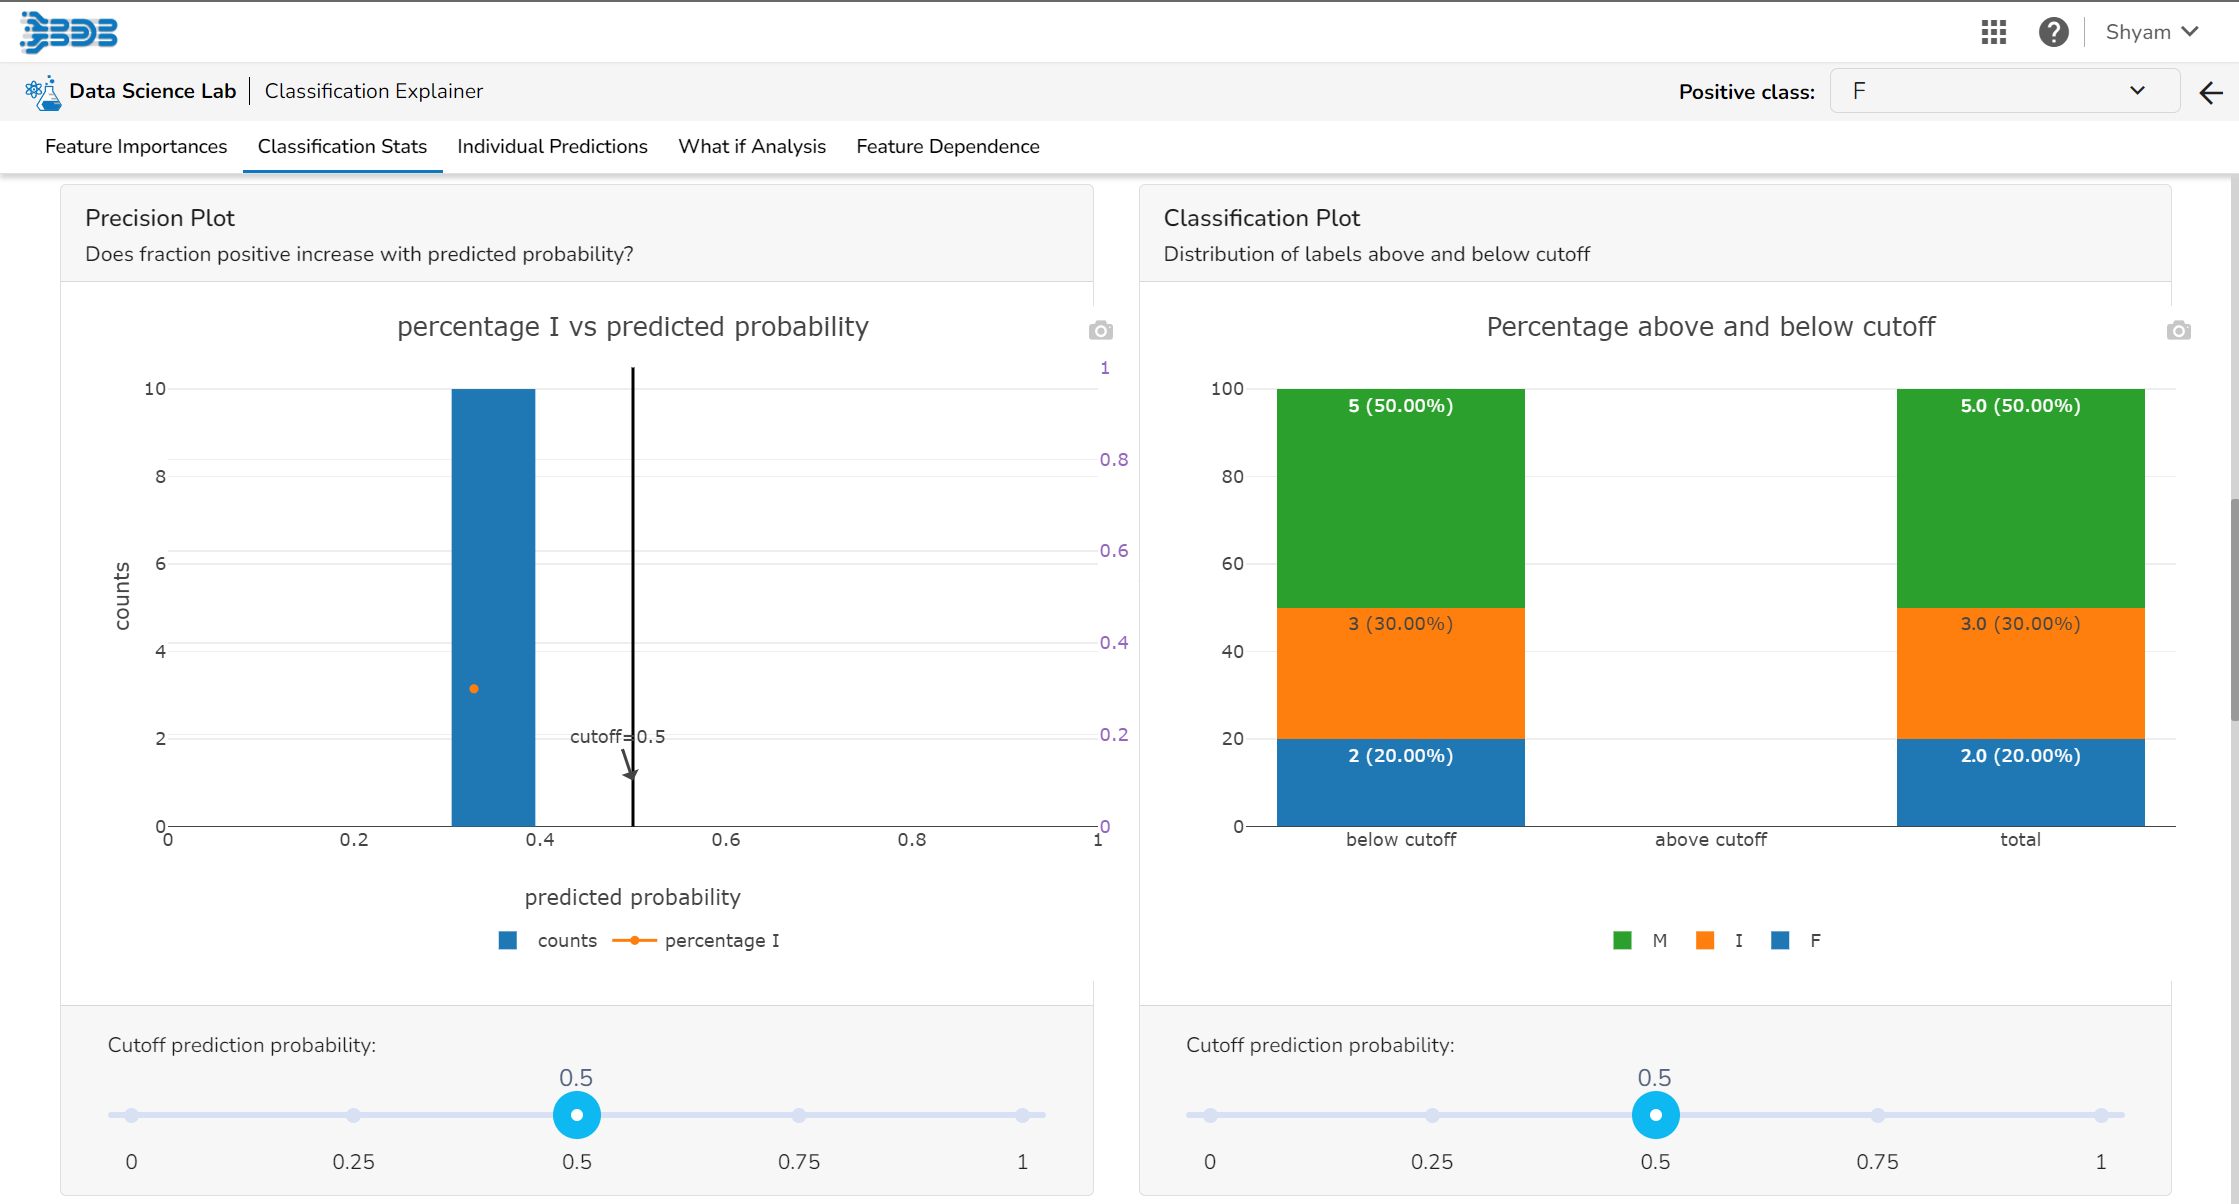
The user can see the relation between the predicted probability that a record belongs to the positive class and the percentage of observed records in the positive class on this plot. The observations get binned together in groups of roughly equal predicted probabilities and the percentage of positives is calculated for each bin. a perfectly calibrated model would show a straight line from the bottom left corner to the top right corner. a strong model would classify most observations correctly and close to 0% or 100% probability.
Classification Plot
This plot displays the fraction of each class above and below the cut-off.
ROC AUC Plot
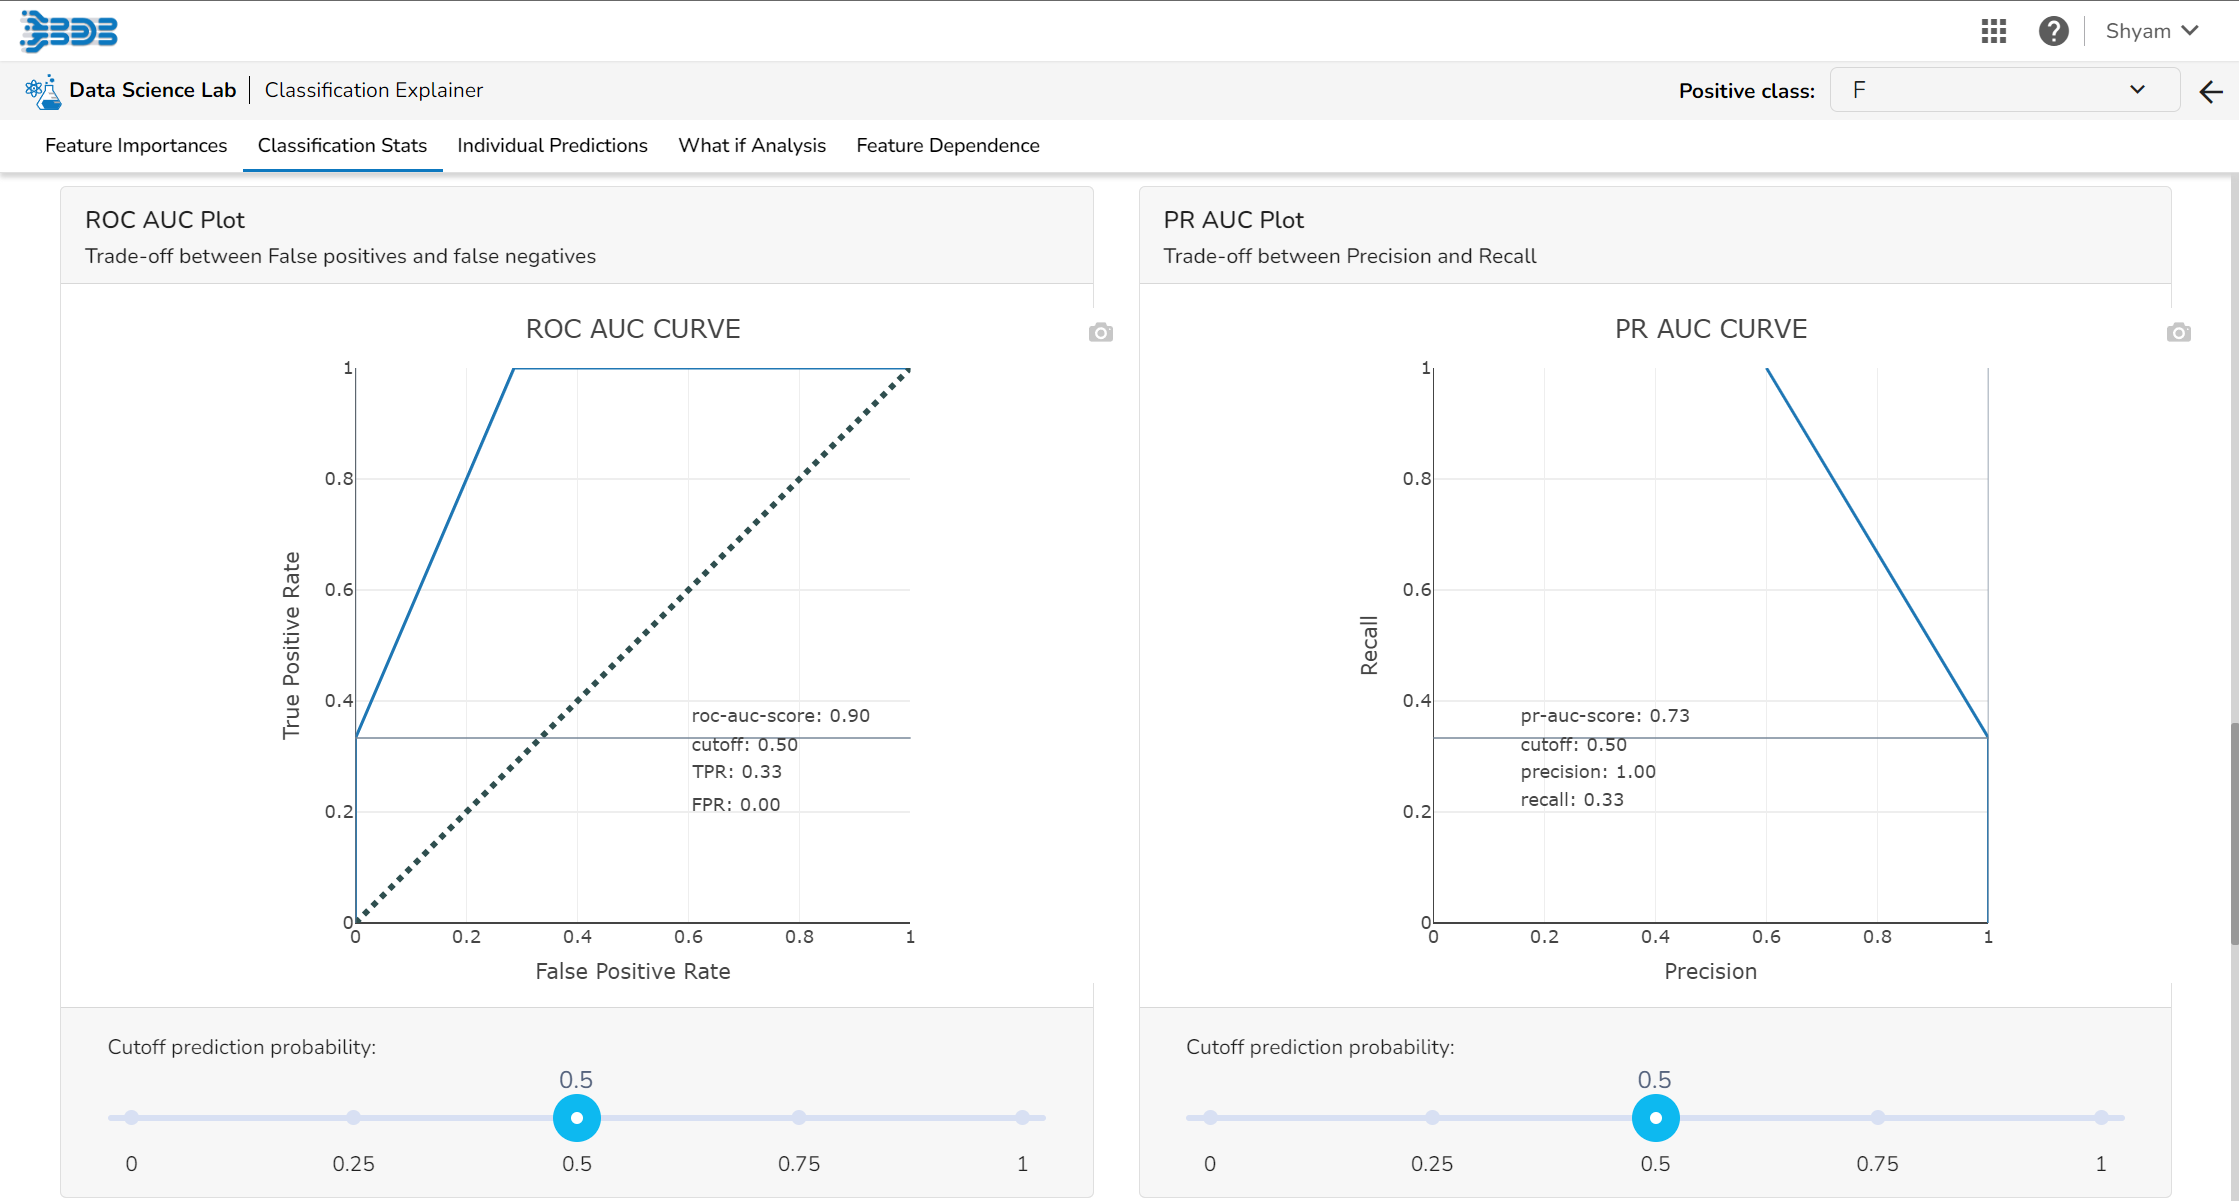
The ROC curve is created by plotting the true positive rate (TPR) against the false positive rate (FPR) at different classification thresholds.
The true positive rate is the proportion of actual positive samples that are correctly identified as positive by the model, i.e., TP / (TP + FN). The false positive rate is the proportion of actual negative samples that are incorrectly identified as positive by the model, i.e., FP / (FP + TN).
PR AUC Plot
It shows the trade-off between Precision and Recall in one plot.
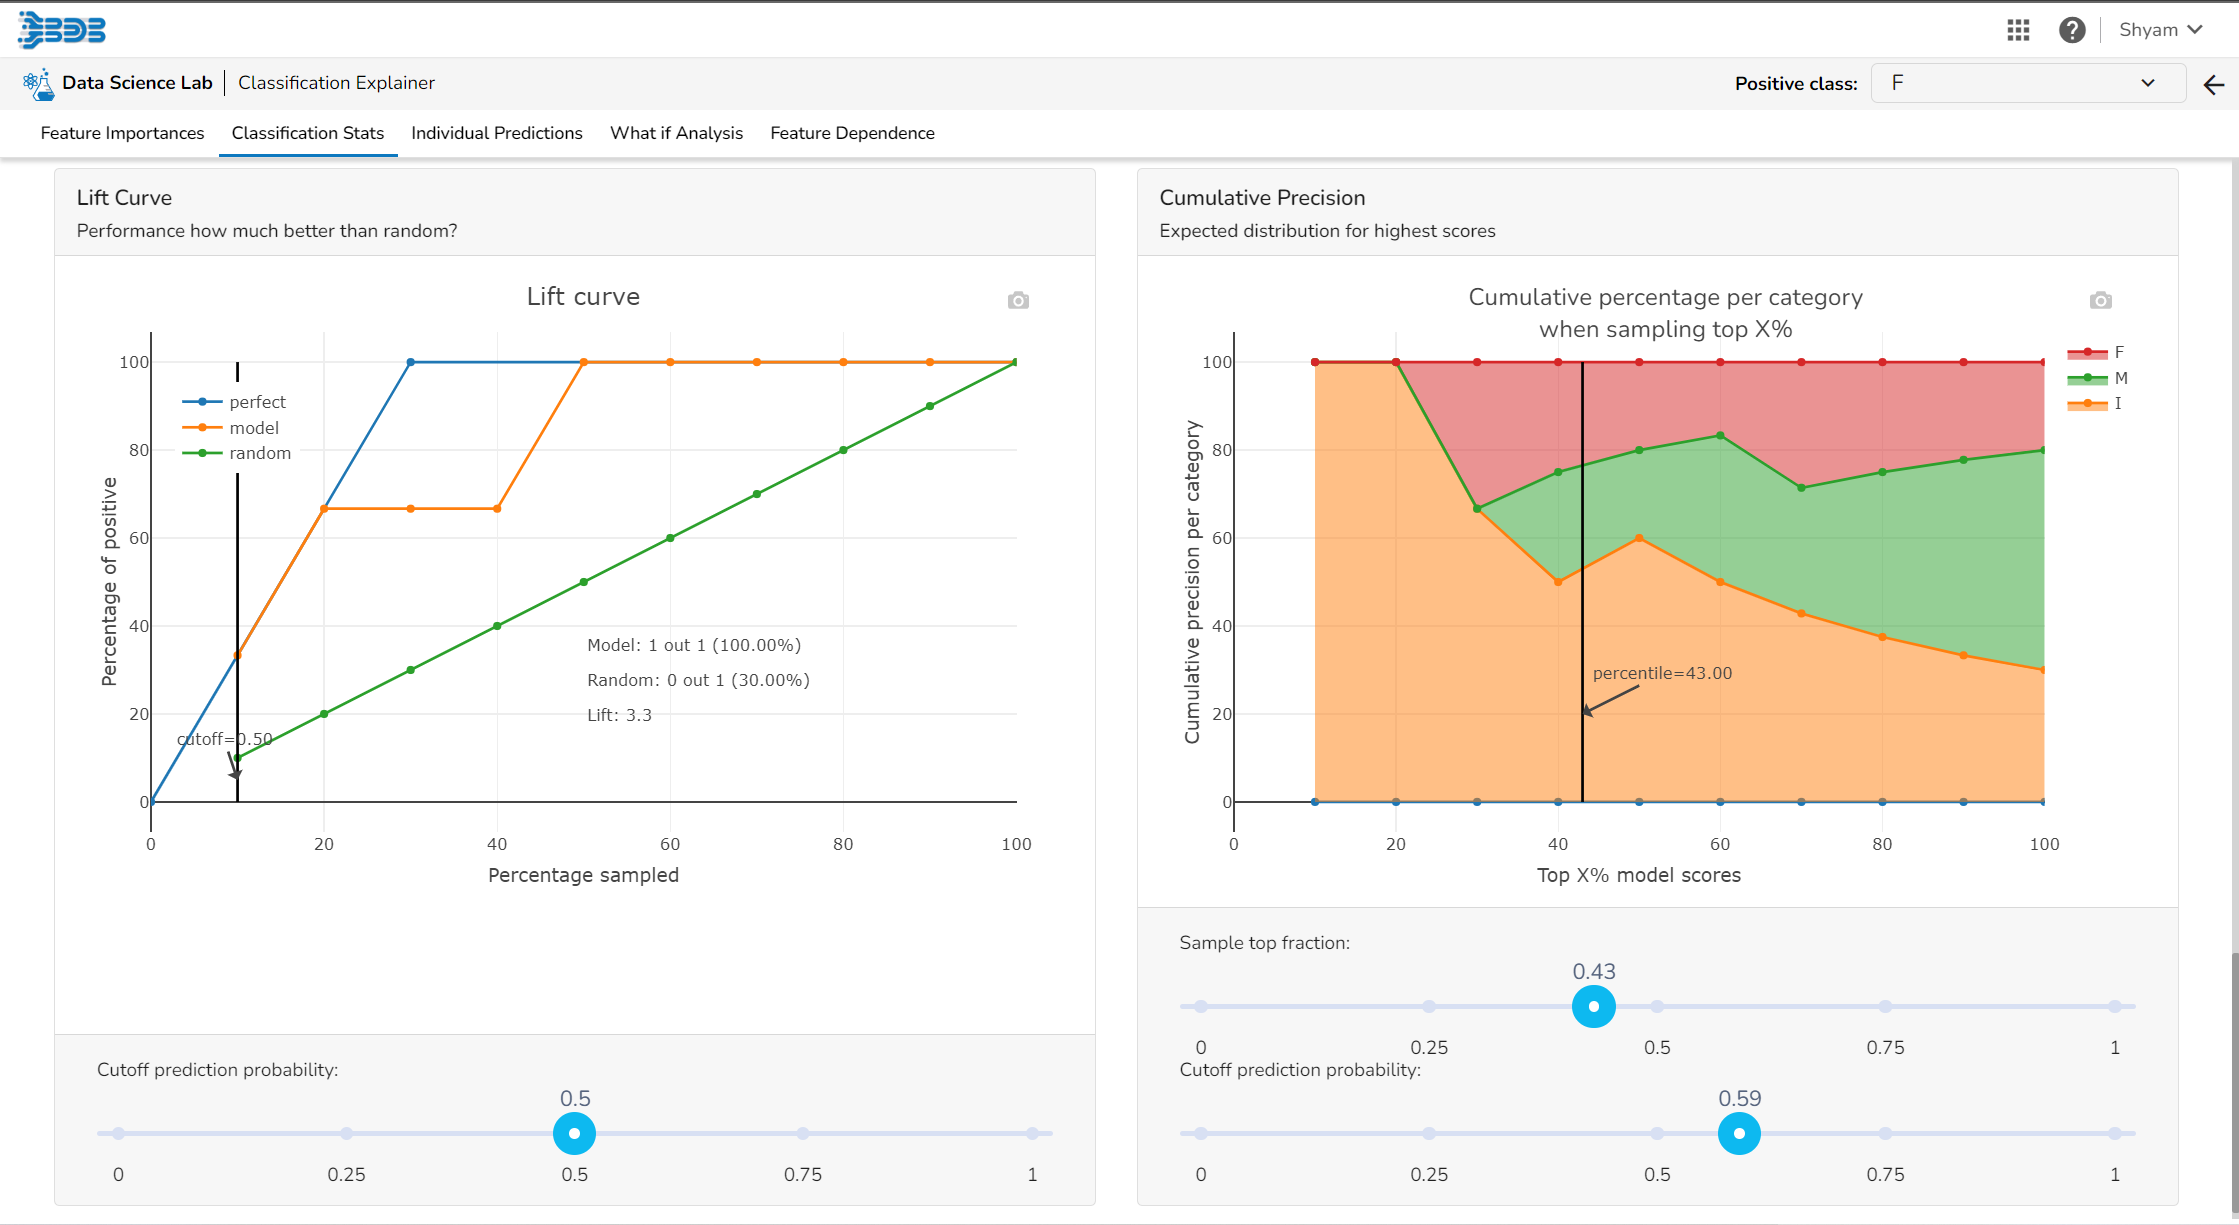
Lift Curve
The Lift Curve chart shows you the percentage of positive classes when you only select observations with a score above the cut-off vs selecting observations randomly. This displays to the user how much it is better than the random (the lift).
Cumulative Precision
This plot shows the percentage of each label that you can expect when you only sample the top x% with the highest scores.
Individual Predictions
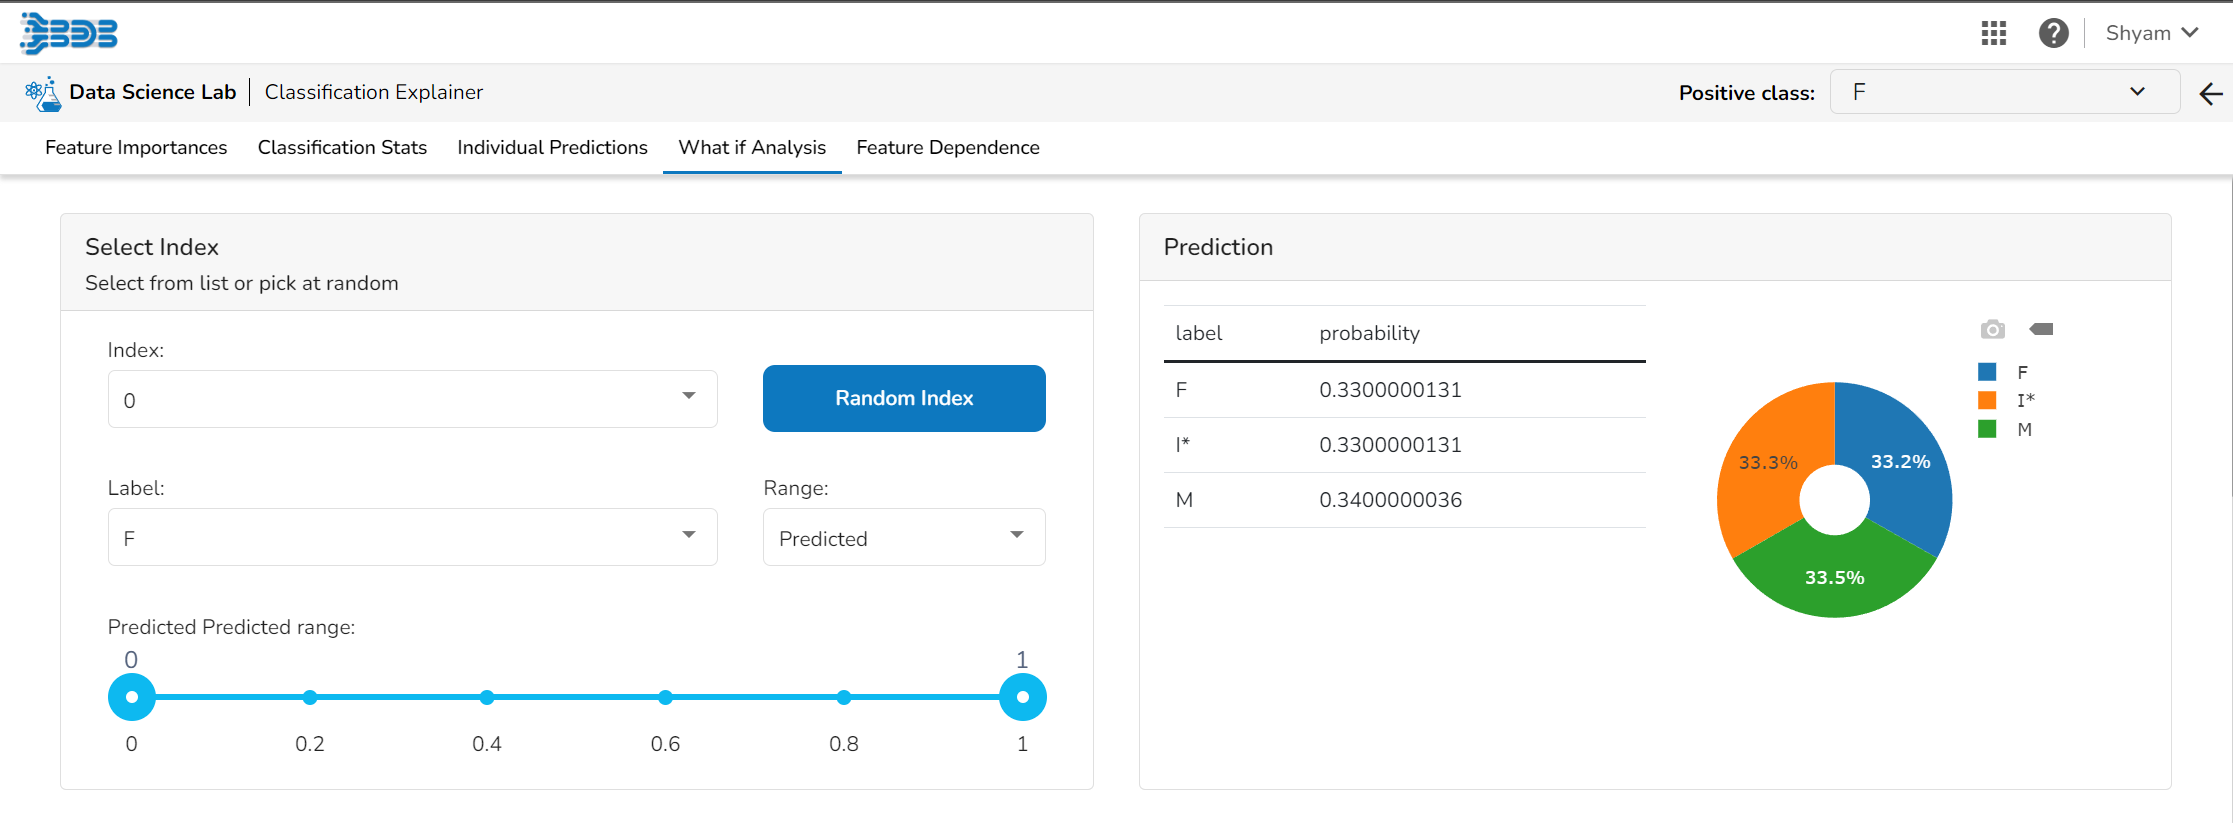
Select Index
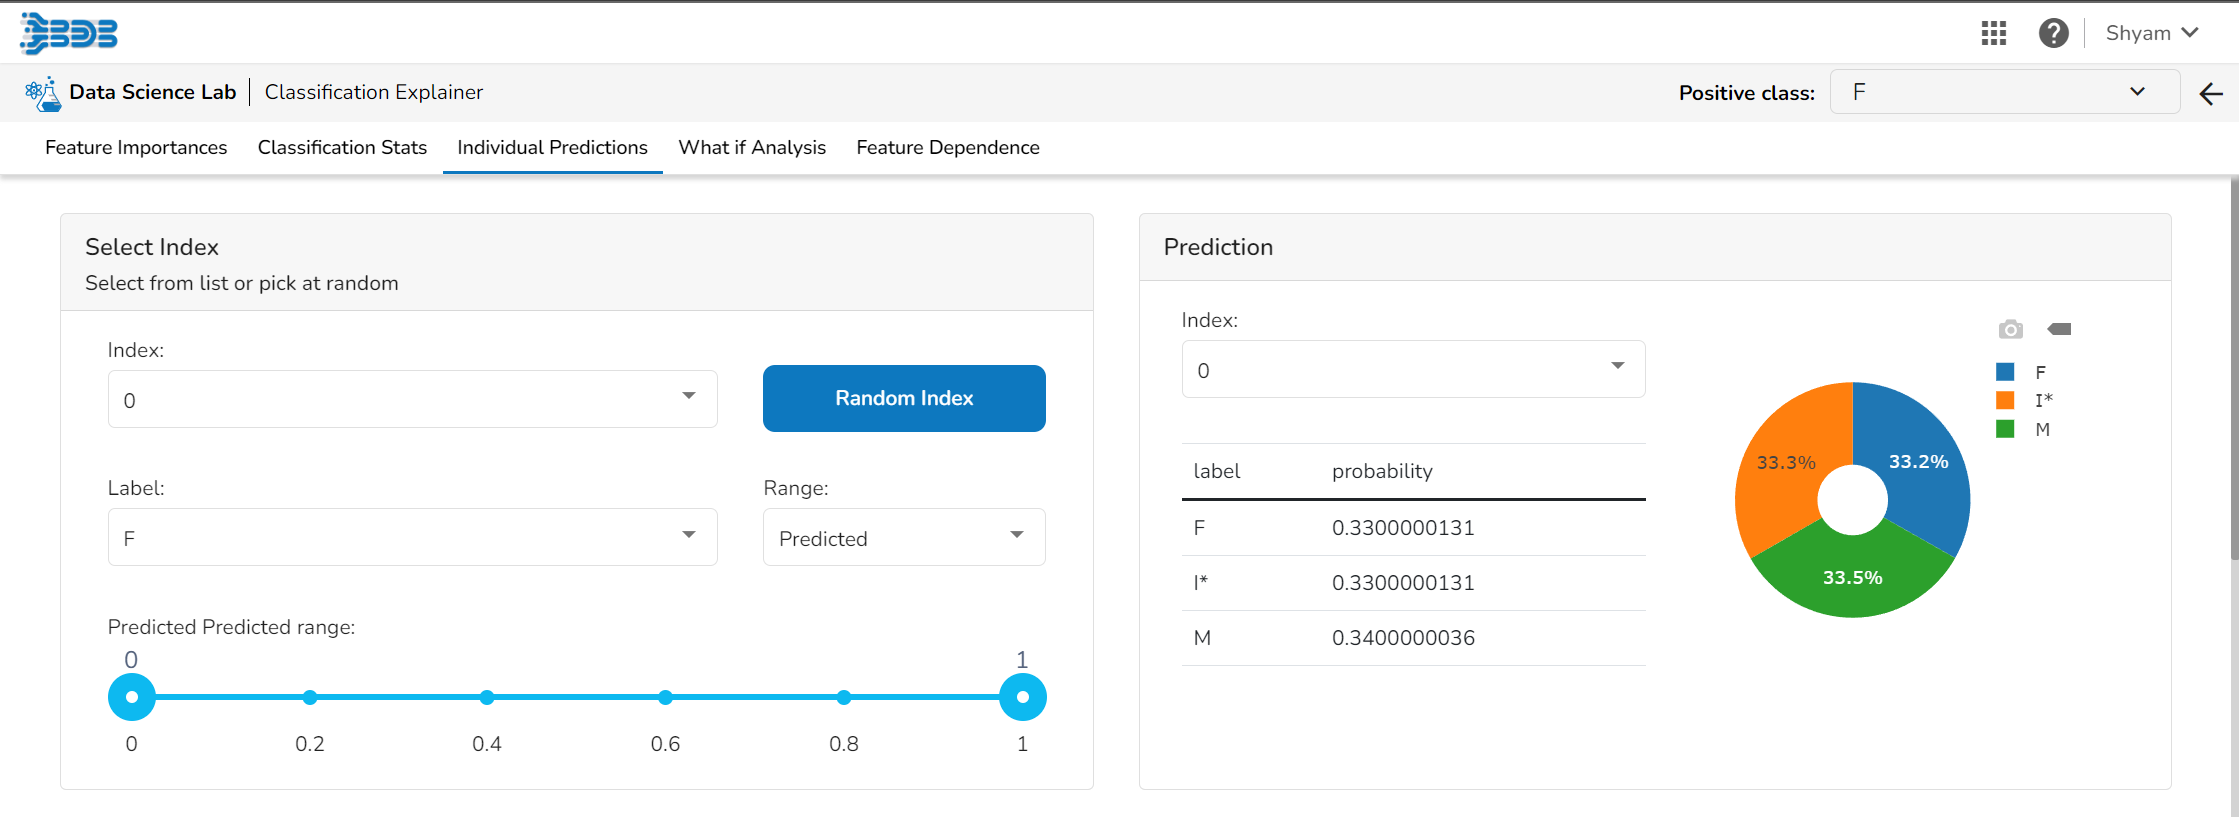
The user can select a record directly by choosing it from the dropdown or hit the Random Index option to randomly select a record that fits the constraints. For example, the user can select a record where the observed target value is negative but the predicted probability of the target being positive is very high. This allows the user to sample only false positives or only false negatives.
Prediction
It displays the predicted probability for each target label.
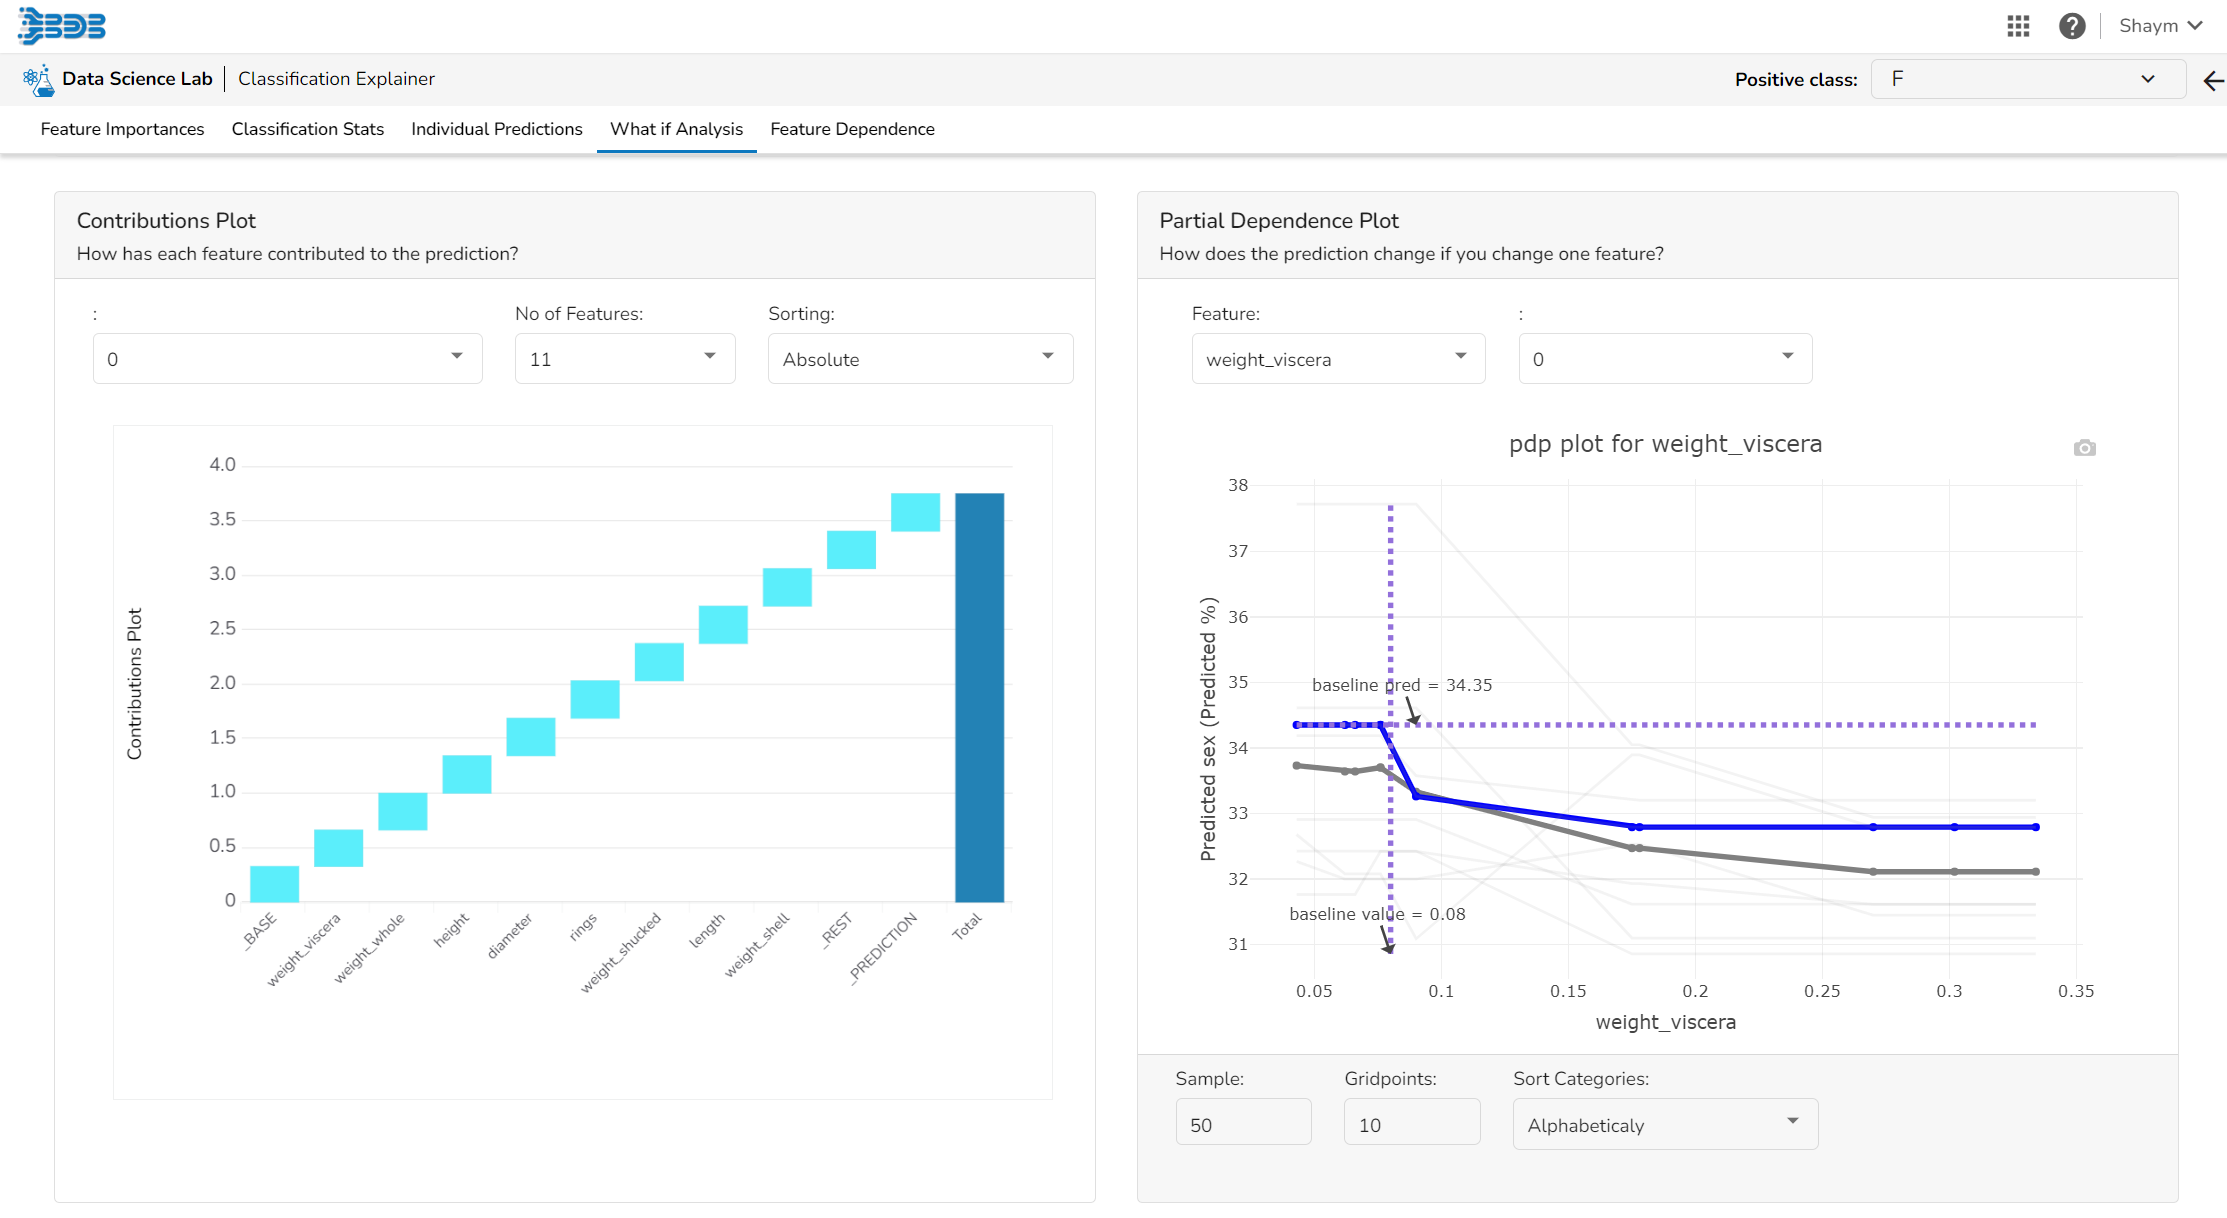
Contributions Plot
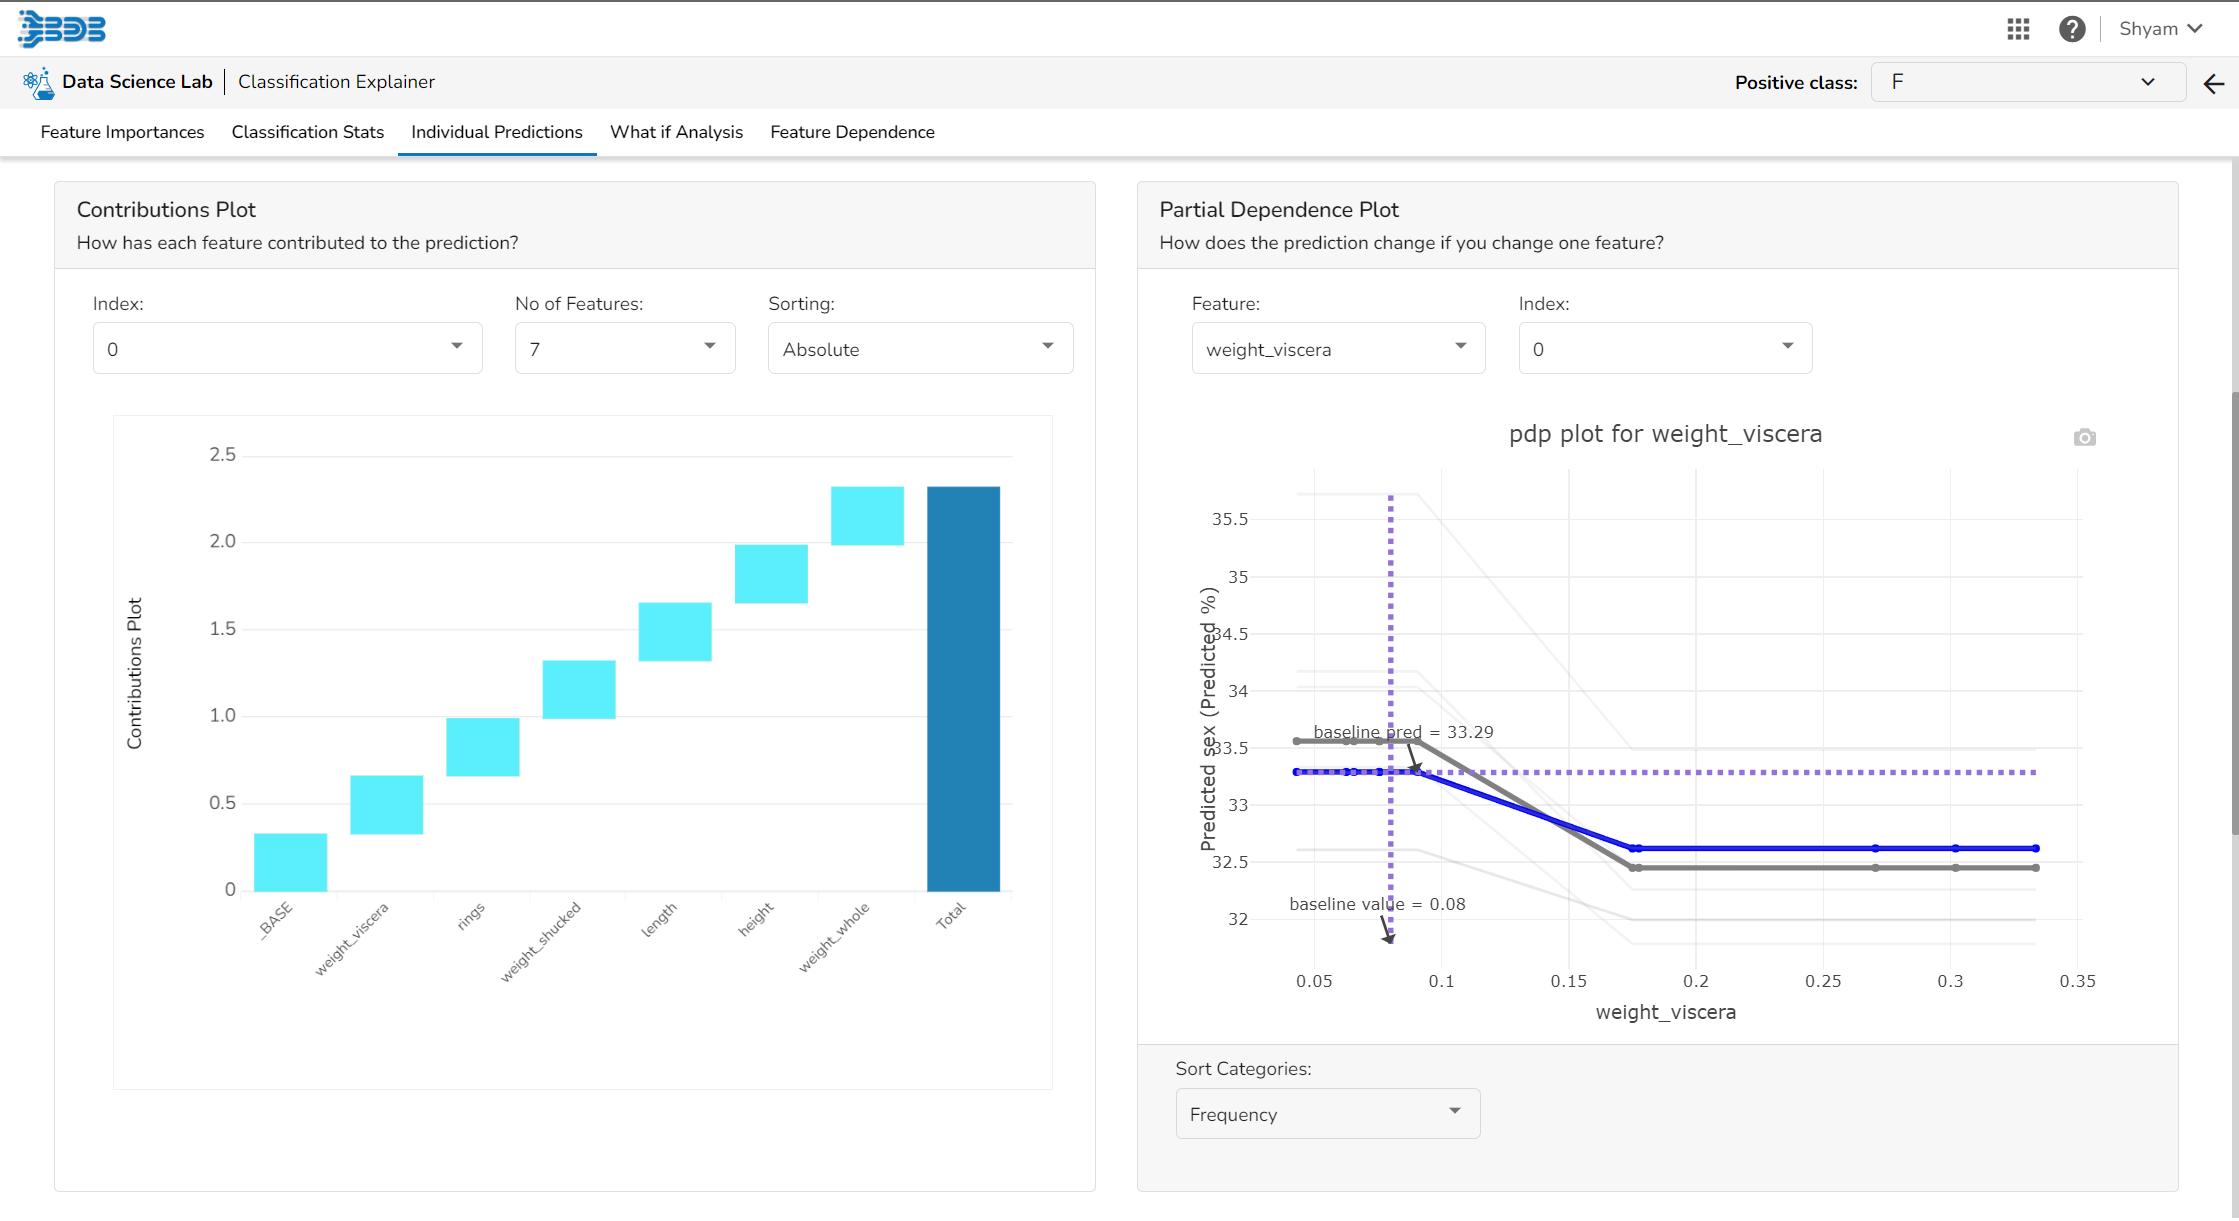
This plot shows the contribution that each feature has provided to the prediction for a specific observation. The contributions (starting from the population average) add up to the final prediction. This helps to explain exactly how each prediction has been built up from all the individual ingredients in the model.
Partial Dependence Plot
The PDP plot shows how the model prediction would change if you change one particular feature. the plot shows you a sample of observations and how these observations would change with this feature (gridlines). The average effect is shown in grey. The effect of changing the feature for a single record is shown in blue. The user can adjust how many observations to sample for the average, how many gridlines to show, and how many points along the x-axis to calculate model predictions for (grid points).
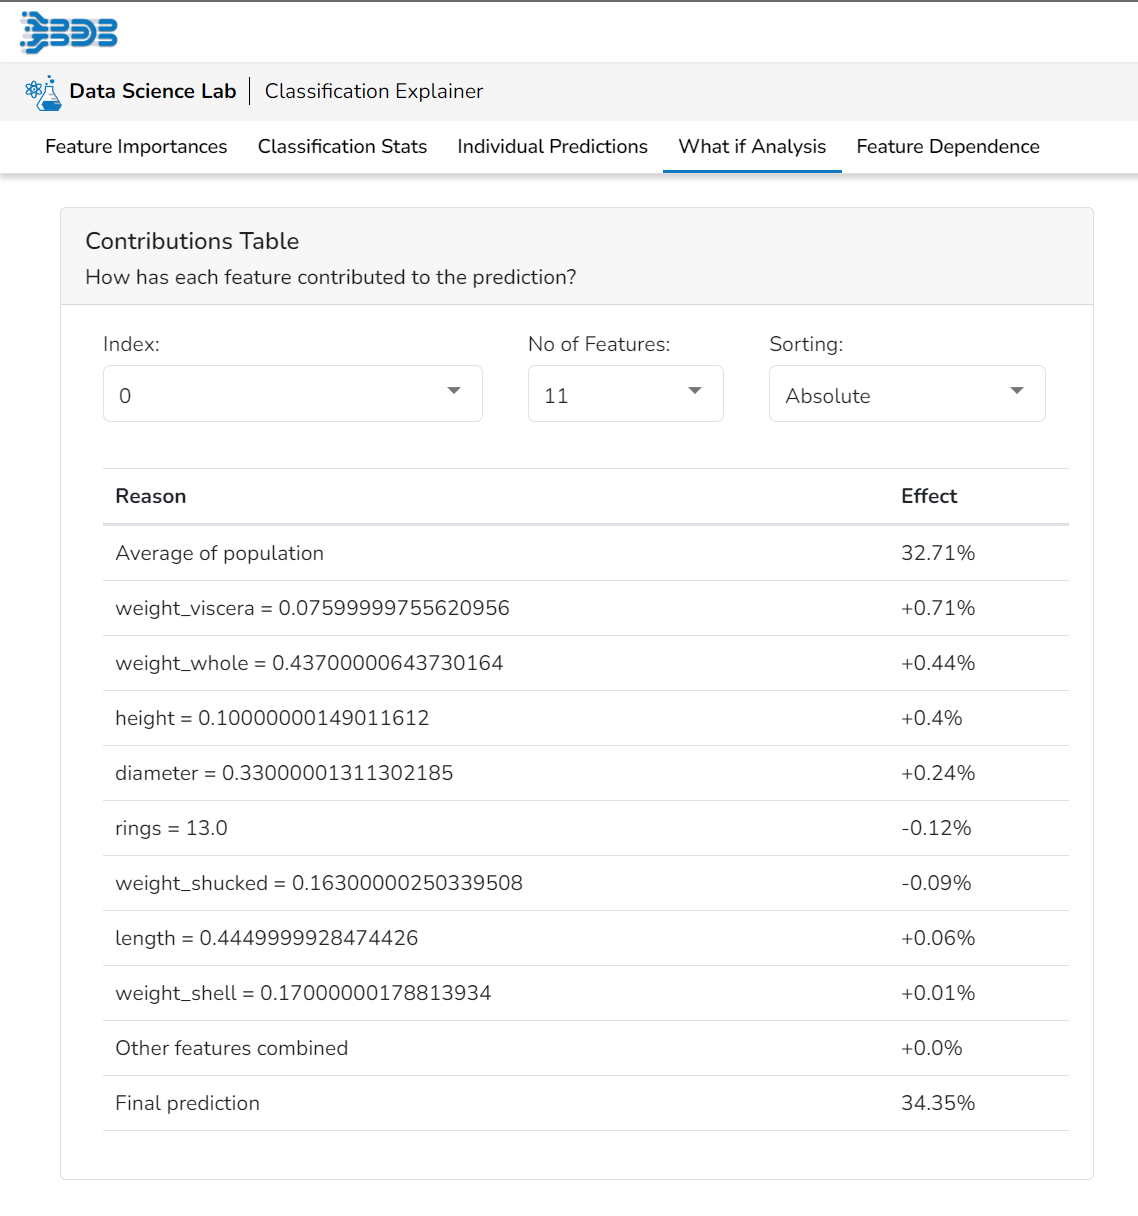
Contributions Table
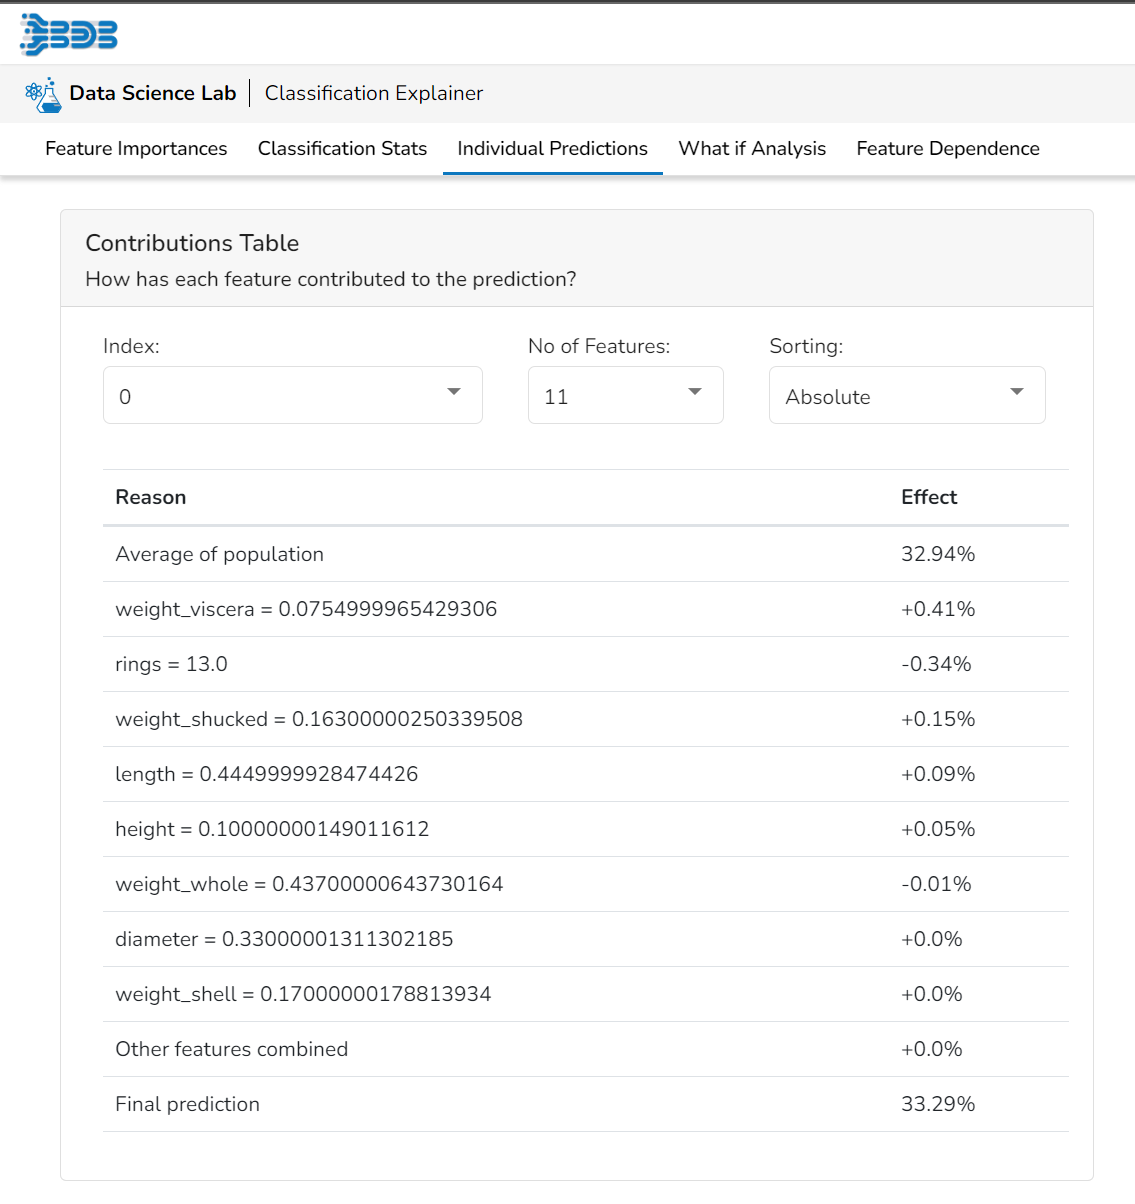
This table shows the contribution each individual feature has had on the prediction for a specific observation. The contributions (starting from the population average) add up to the final prediction. This allows you to explain exactly how each individual prediction has been built up from all the individual ingredients in the model.
What If Analysis
The What If Analysis is often used to help stakeholders understand the potential consequences of different scenarios or decisions. This tab displays how the outcome would change when the values of the selected variables get changed. This allows stakeholders to see how sensitive the outcome is to different inputs and can help them identify which variables are most important to focus on.
What-if analysis charts can be used in a variety of contexts, from financial modeling to marketing analysis to supply chain optimization. They are particularly useful when dealing with complex systems where it is difficult to predict the exact impact of different variables. By exploring a range of scenarios, analysts can gain a better understanding of the potential outcomes and make more informed decisions.
Select Index & Prediction
Feature Input
The user can adjust the input values to see predictions for what-if scenarios.

Contribution & Partial Dependence Plots
In a What-if analysis chart, analysts typically start by specifying a baseline scenario, which represents the current state of affairs. They then identify one or more variables that are likely to have a significant impact on the outcome of interest, and specify a range of possible values for each of these variables.
Contributions Table
This table shows the contribution each individual feature has had on the prediction for a specific observation. The contributions (starting from the population average) add up to the final prediction. This allows you to explain exactly how each individual prediction has been built up from all the individual ingredients in the model.
Feature Dependence
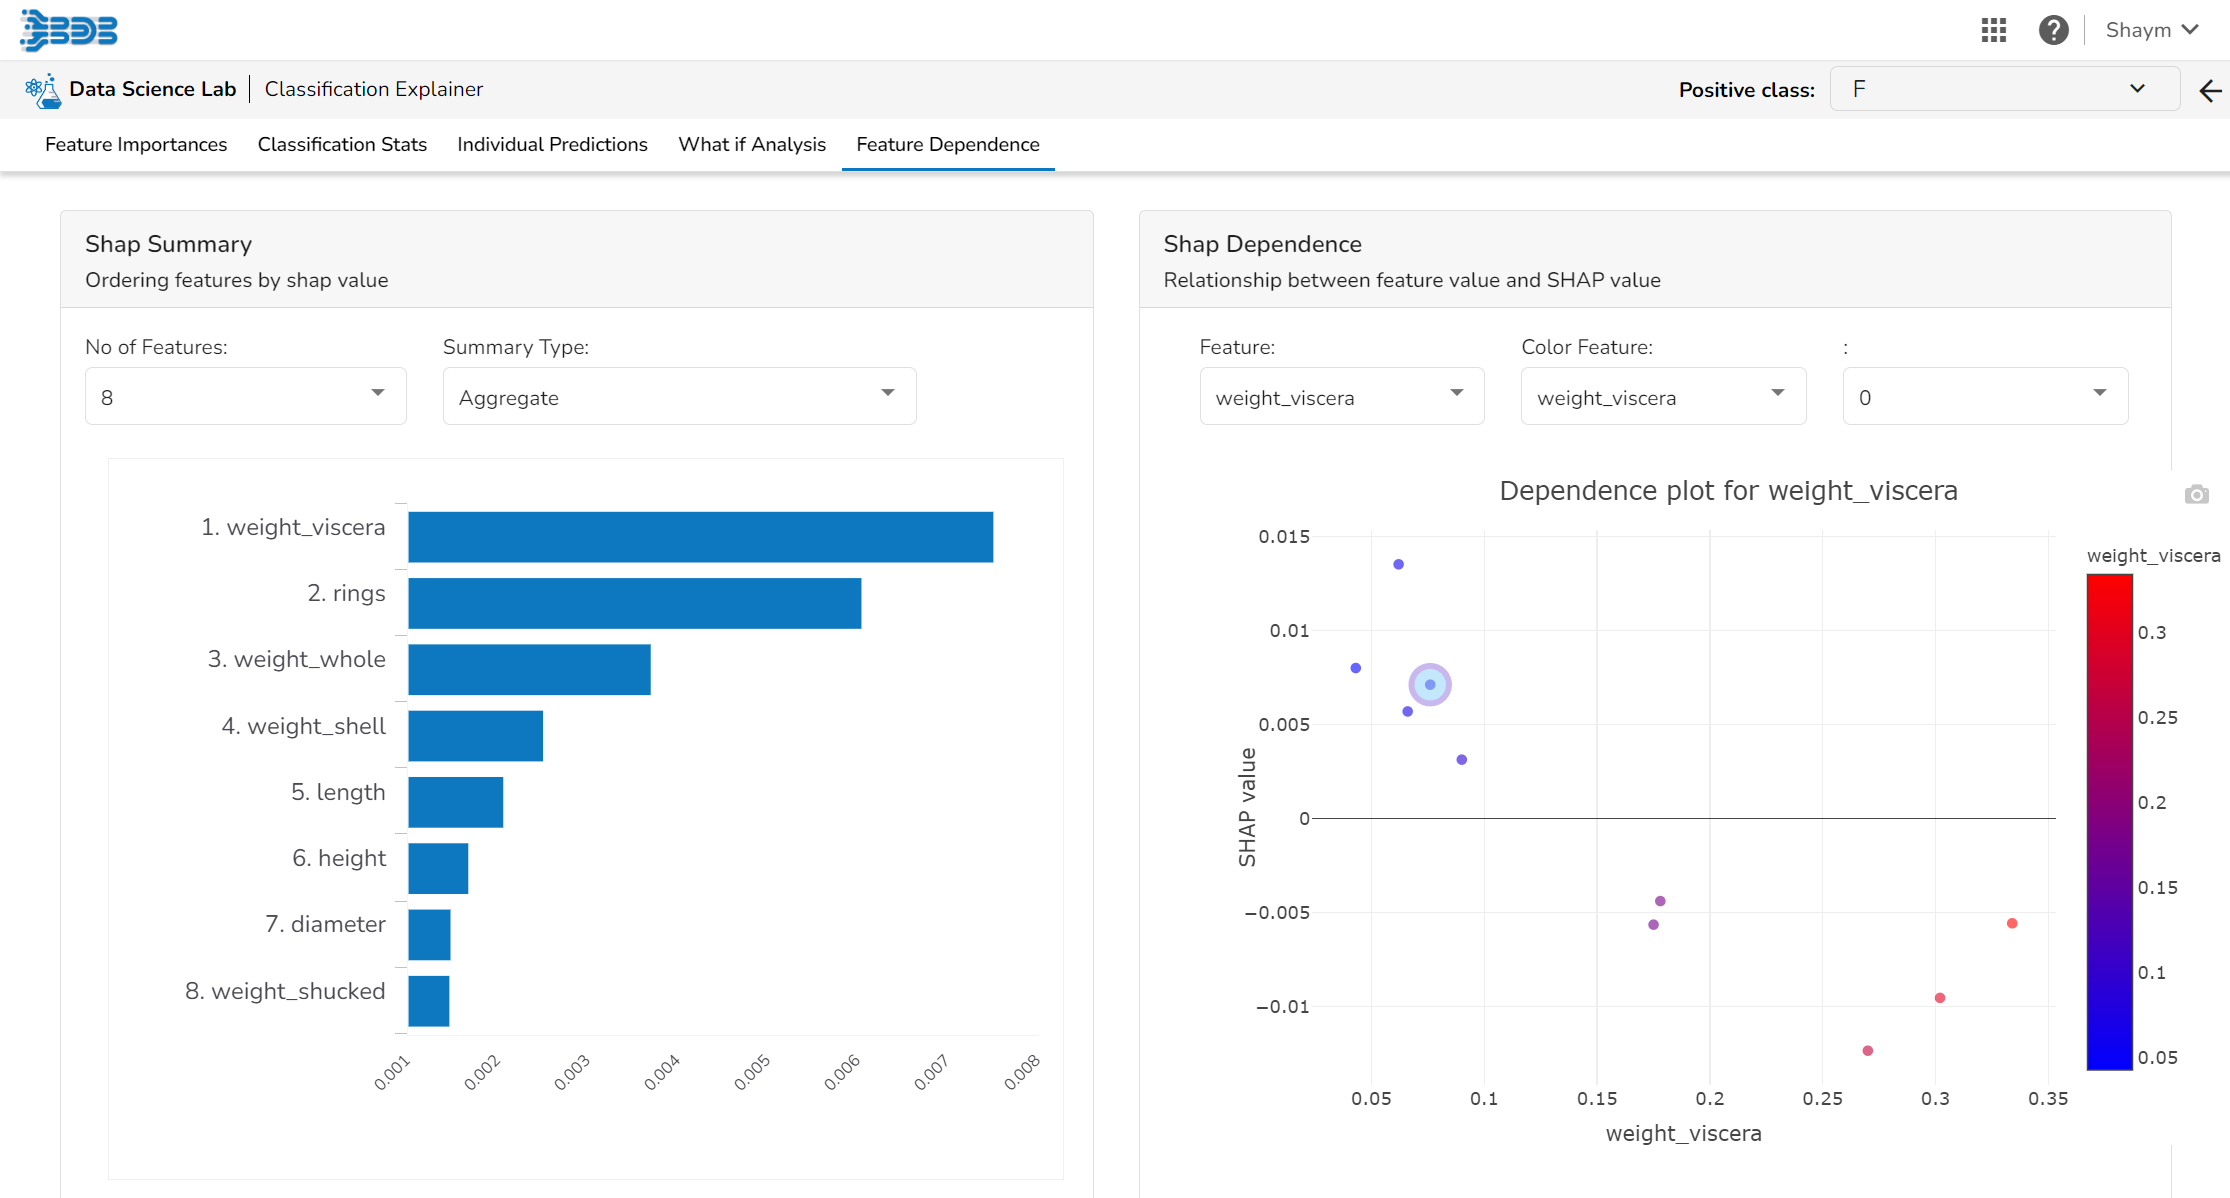
Shap Summary
The Shap Summary summarizes the Shap values per feature. The user can either select an aggregate display that shows the mean absolute Shap value per feature or get a more detailed look at the spread of Shap values per feature and how they co-relate the feature value (red is high).
Shap Dependence
This plot displays the relation between feature values and Shap values. This allows you to investigate the general relationship between feature value and impact on the prediction. The users can check whether the model uses features in line with their intuitions, or use the plots to learn about the relationships that the model has learned between the input features and the predicted outcome.
Last updated