> For the complete documentation index, see [llms.txt](https://docs.bdb.ai/data-center-3/llms.txt). Markdown versions of documentation pages are available by appending `.md` to page URLs; this page is available as [Markdown](https://docs.bdb.ai/data-center-3/data-center/data-sandbox/data-sandbox-list/visualize.md).

# Visualize

This option helps the users to generate and save Views instantly by using the widget visualizer.

* Navigate to the ***Data Sandbox*** list.
* Select a ***Data Sandbox*** from the list.&#x20;
* Click the ***Visualize*** icon for it.      &#x20;

<figure><img src="https://3037103496-files.gitbook.io/~/files/v0/b/gitbook-x-prod.appspot.com/o/spaces%2FIctE5LjGWDD6zEdW4vpJ%2Fuploads%2FDaecAsYyw0S1uG1bQzan%2Fimage.png?alt=media&amp;token=827e5211-de26-47ac-b80b-b0a233042030" alt=""><figcaption></figcaption></figure>

* The ***Widget Visualizer*** page opens for the selected Data Sandbox file.
* Click the ***Create New Widget*** icon.
* Select a chart type from the drop-down menu.
* Select a data field for the X-Axis.
* Select a data field for the Y-Axis.
* Provide a Title for the Widget.
* By selecting an option for ***Hover*** it will display the tooltip for that data point on the chart.
* By selecting a field name for the Color option, it will display various colors based on the data values.
* A View/widget gets created based on the selection.
* Click the ***Save*** option.    &#x20;

<figure><img src="https://3037103496-files.gitbook.io/~/files/v0/b/gitbook-x-prod.appspot.com/o/spaces%2FIctE5LjGWDD6zEdW4vpJ%2Fuploads%2FabAgt9ccVpT1GsJgu4Ao%2Fimage.png?alt=media&amp;token=08b1480e-7a9d-4692-87ec-8fcd5bba060a" alt=""><figcaption><p><em><strong>Creating a Widget</strong></em></p></figcaption></figure>

* The View/widget gets saved and the same gets notified by the ***Saved*** dialog box.
* Click the ***Close*** option to close the notification.    &#x20;

<figure><img src="https://3037103496-files.gitbook.io/~/files/v0/b/gitbook-x-prod.appspot.com/o/spaces%2FIctE5LjGWDD6zEdW4vpJ%2Fuploads%2FhuaNHK6isbnL6zV0APxL%2Fimage.png?alt=media&amp;token=0f986e76-c9a8-4fba-84e7-b361cd555bcf" alt=""><figcaption></figcaption></figure>

* The saved widget can be seen in the drop-down while opening the Widget Visualizer next time for the same Data Sandbox.

<figure><img src="https://3037103496-files.gitbook.io/~/files/v0/b/gitbook-x-prod.appspot.com/o/spaces%2FIctE5LjGWDD6zEdW4vpJ%2Fuploads%2Fech7D9w3t5W0Y4cEd4CT%2Fimage.png?alt=media&amp;token=a815ca2a-542b-4a64-b6ad-8e7e55b4b2e7" alt=""><figcaption></figcaption></figure>

{% hint style="info" %}
*<mark style="color:green;">Please Note:</mark>*&#x20;

* *The Widget Visualizer will not process the View until you provide a Title to the View.*
* The user generate and save multiple widget by using the same set of steps.&#x20;
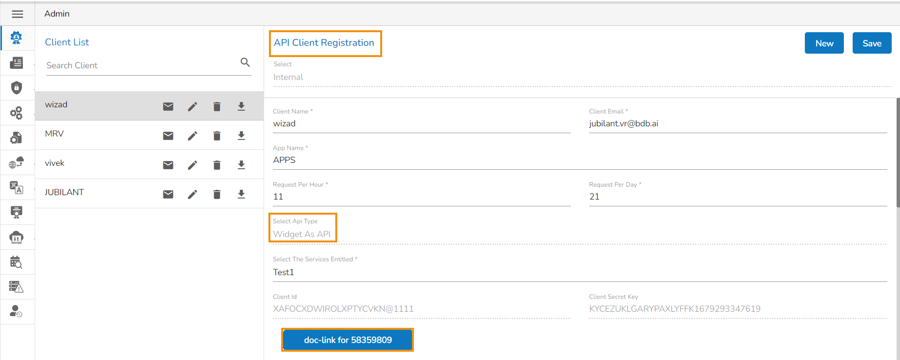
* The saved Widget can be also shared as APIs. The saved widgets will appear under the API Client Registration as Widget as API under the Select API Type drop-down option.
![](https://content.gitbook.com/content/IctE5LjGWDD6zEdW4vpJ/blobs/c4qAKXbyPMhuzV9k8HtM/image.png)
{% endhint %}
