
Advanced
Cluster & Edit
Find out the clusters based on the pronunciation sound and edit the bulk data in a single click.
Select a column from the given dataset.
Open the Transforms tab.
Select the Cluster and Edit transform from the Advanced category.
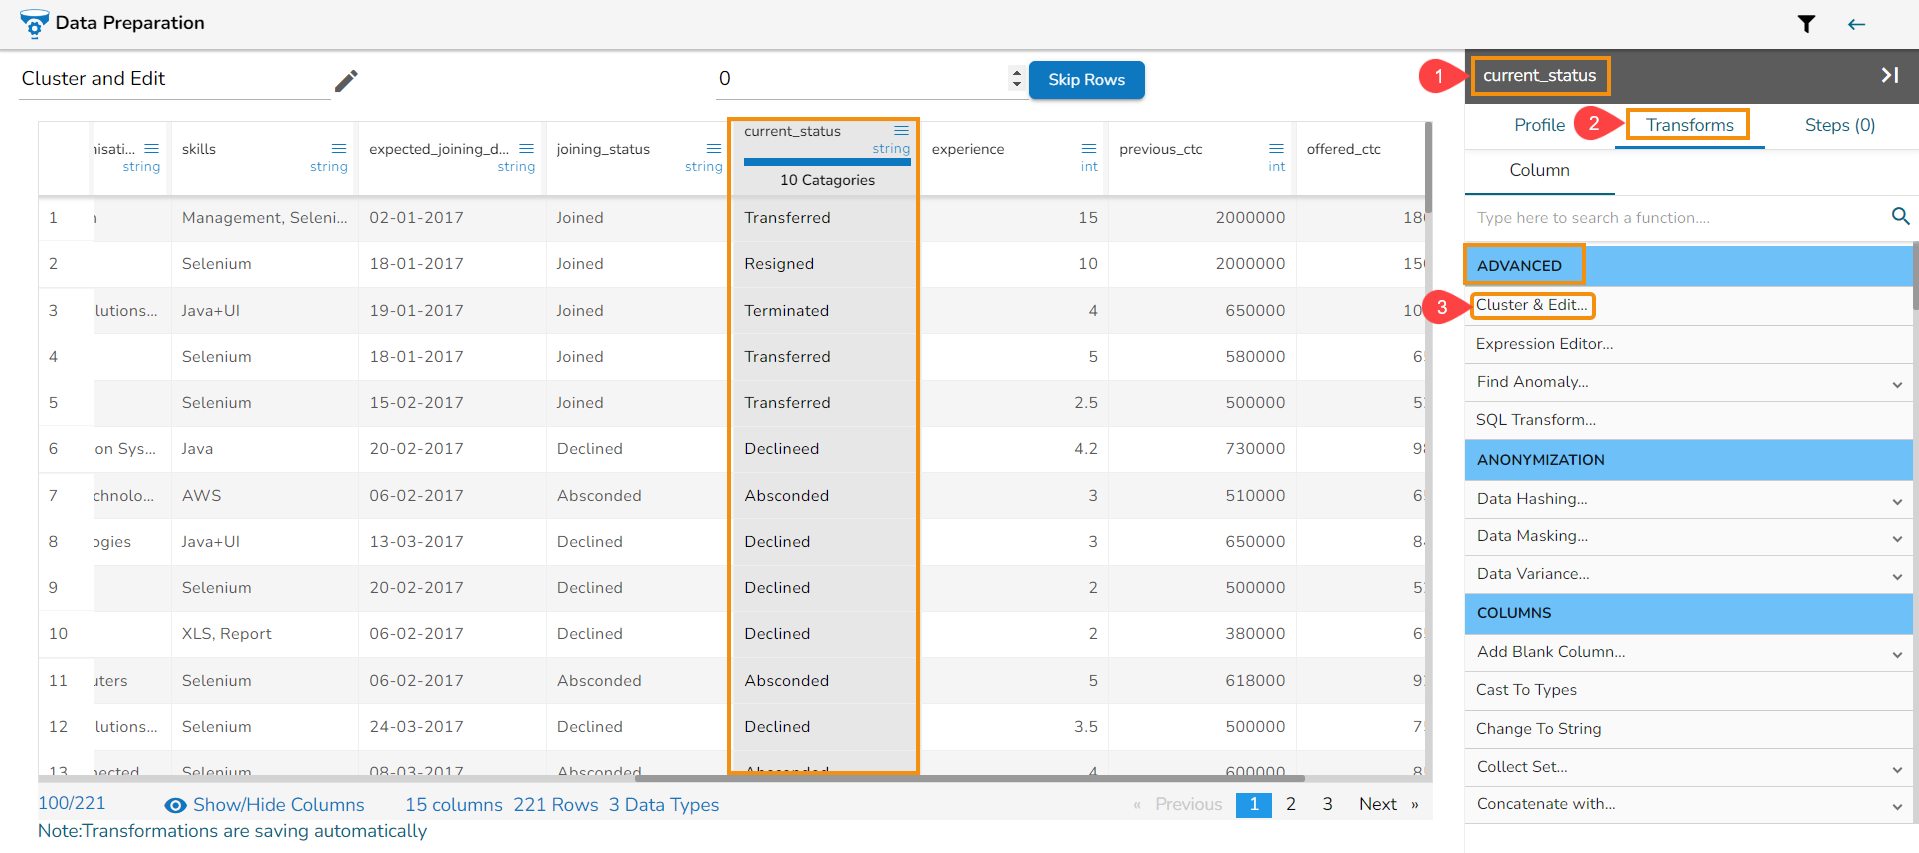
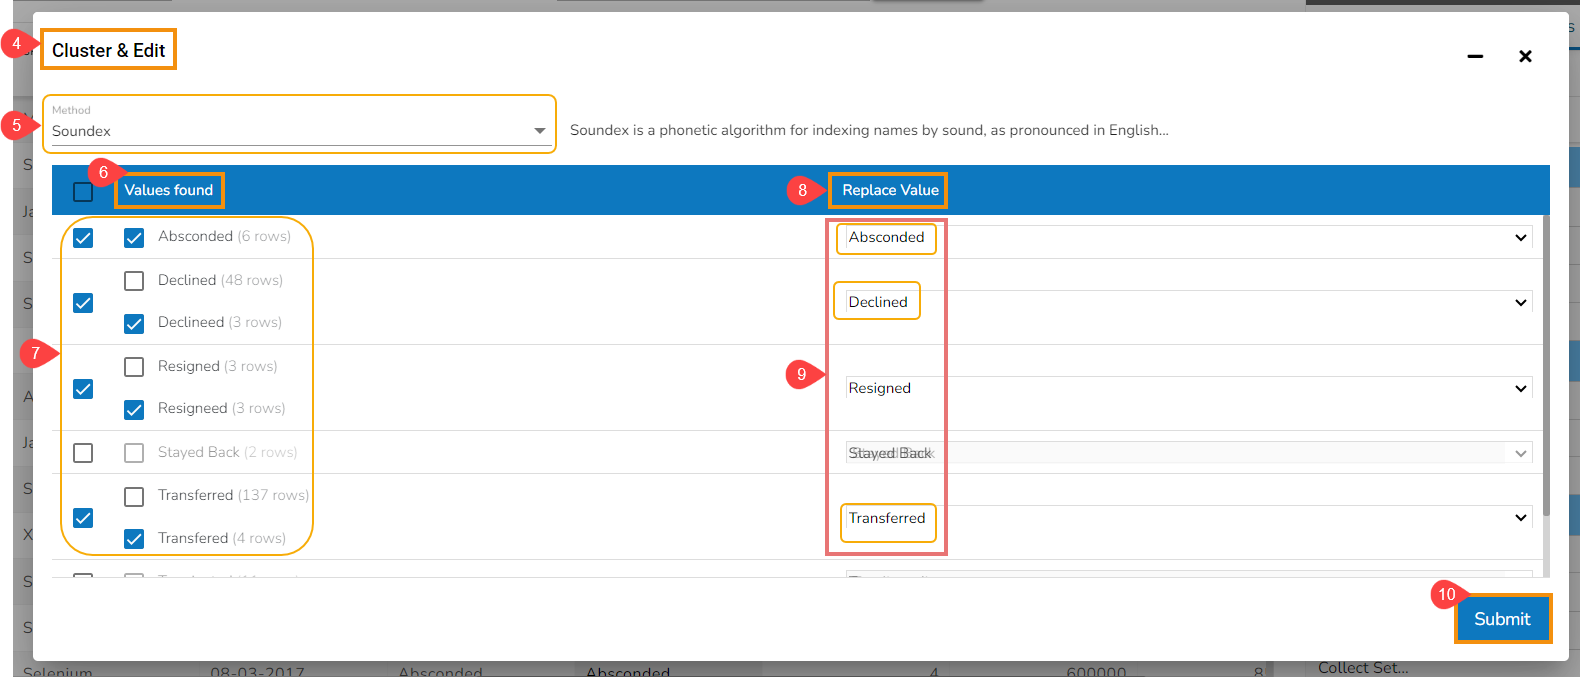
The Cluster & Edit window opens.
The Method drop-down uses the Soundex phonetic algorithm for indexing names by sound as pronounced in English.
The Values found column lists number of values found from the data set related to a specific sound. E.g., In the given image the Values found display 5 categories.
Select a value by using the checkbox that needs to be modified or changed. E.g., the 'Declineed' has been selected in the given example.
Navigate to the Replace Value list.
Search for a replace value or enter a value that you wish to be used as replace value using the drop-down menu from the Replace Value column.
Click the Submit option.
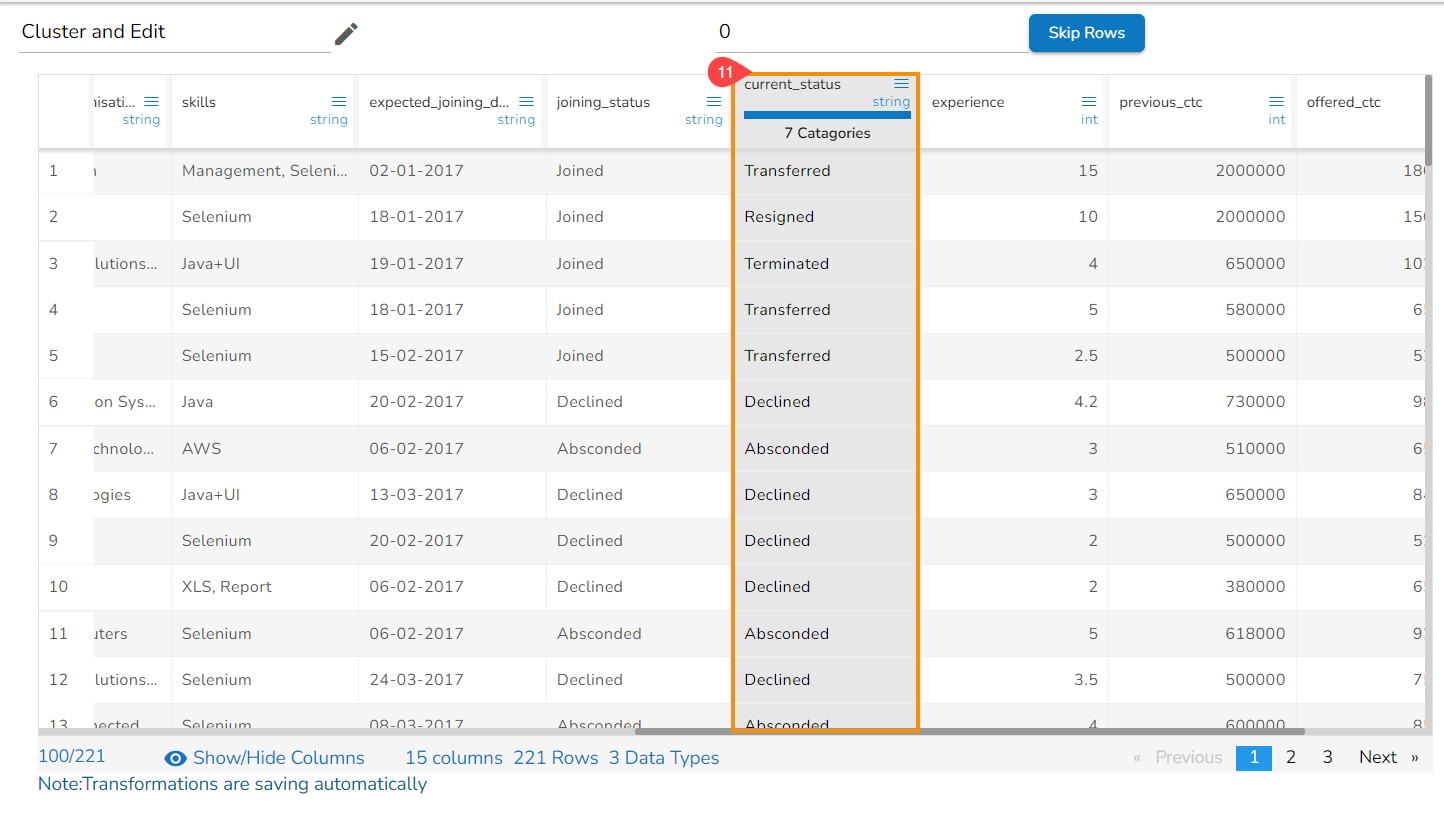
The selected values from the column get modified in the data set.
Expression Editor
This transform helps to execute expressions.
Navigate to a Dataset within the Data Preparation framework.
Navigate to the Transforms tab.
Open the Expression Editor from the Advanced transforms.
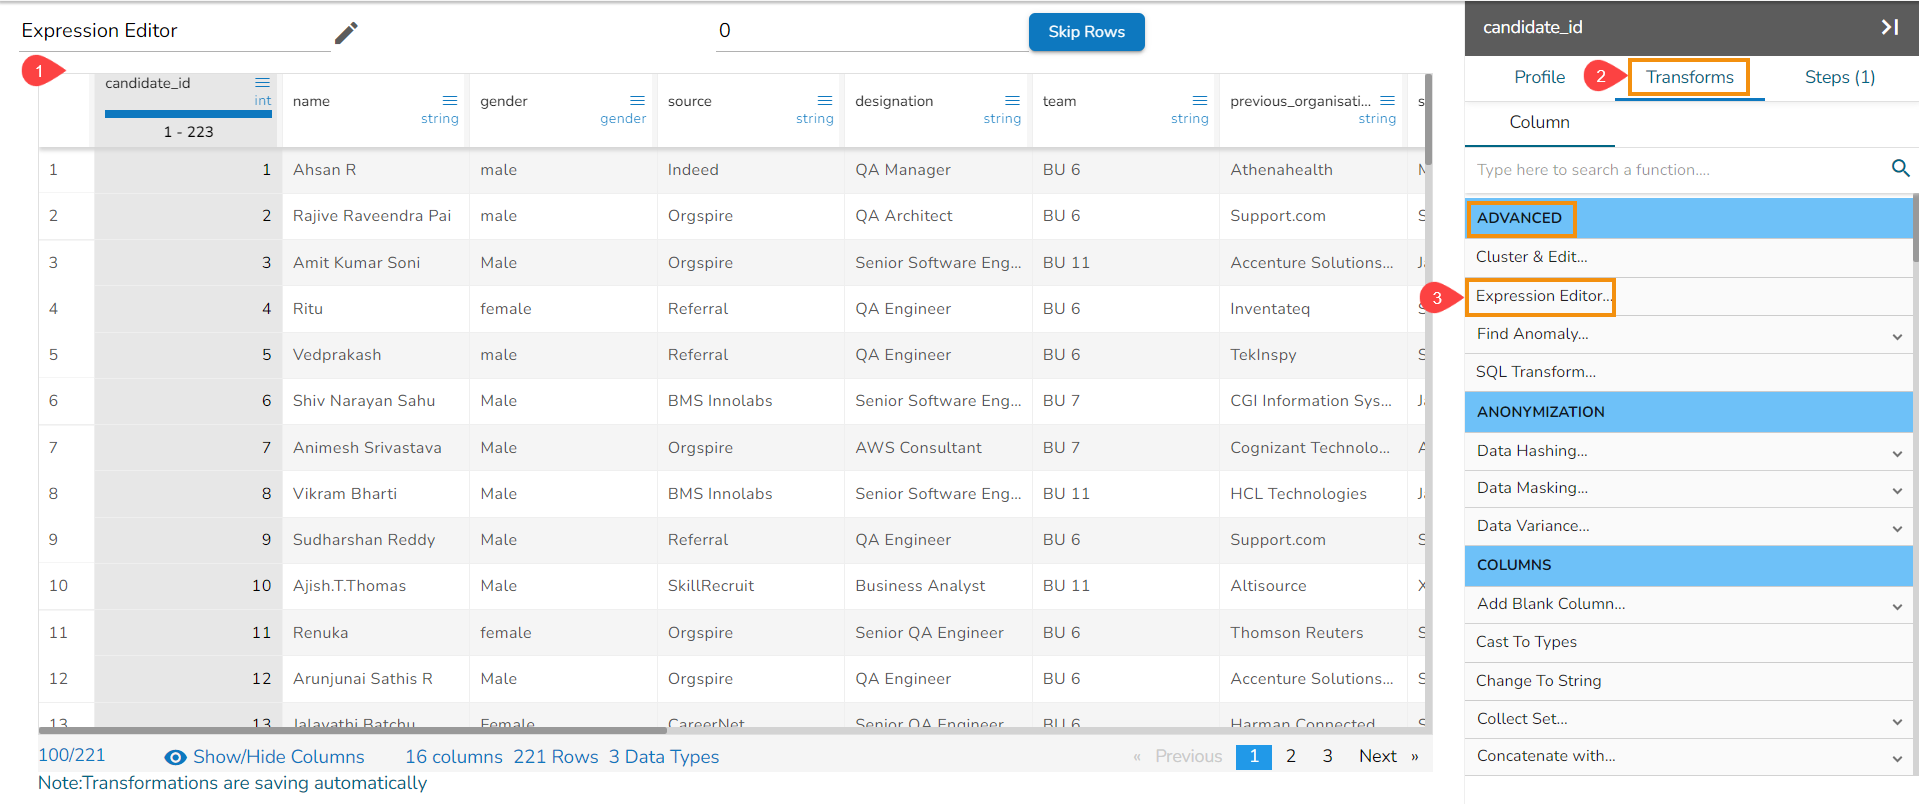
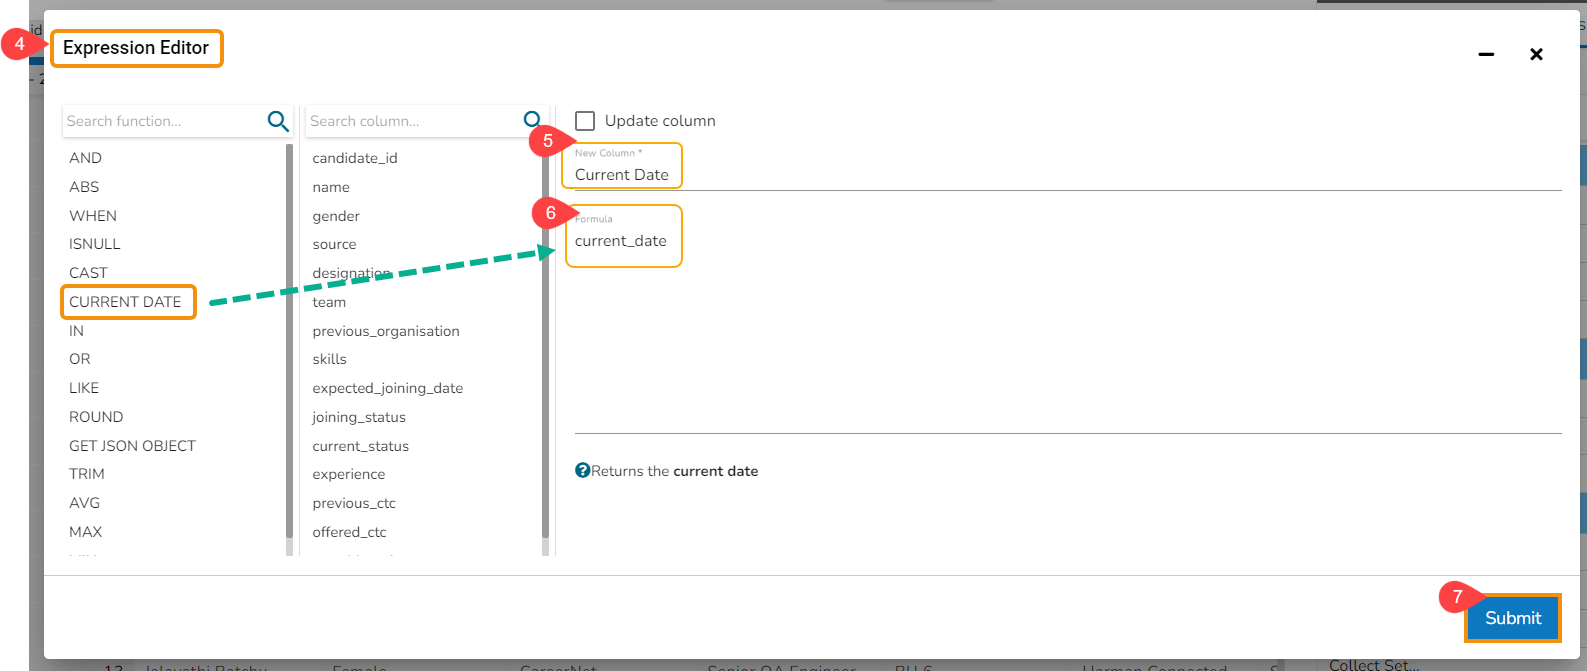
The Expression Editor window opens displaying the following columns:
Functions: The first column contains functions for the user to search for a function. By using the double clicks on a function, it gets added to the given space provided for creating a formula.
Columns: The second column lists all the column names available in the selected dataset.
The Formula space is provided to create and execute various formulas/ executions.
Use either of the following ways to consume the created expression or formula in the dataset.
Update a selected column by using the Update column option.
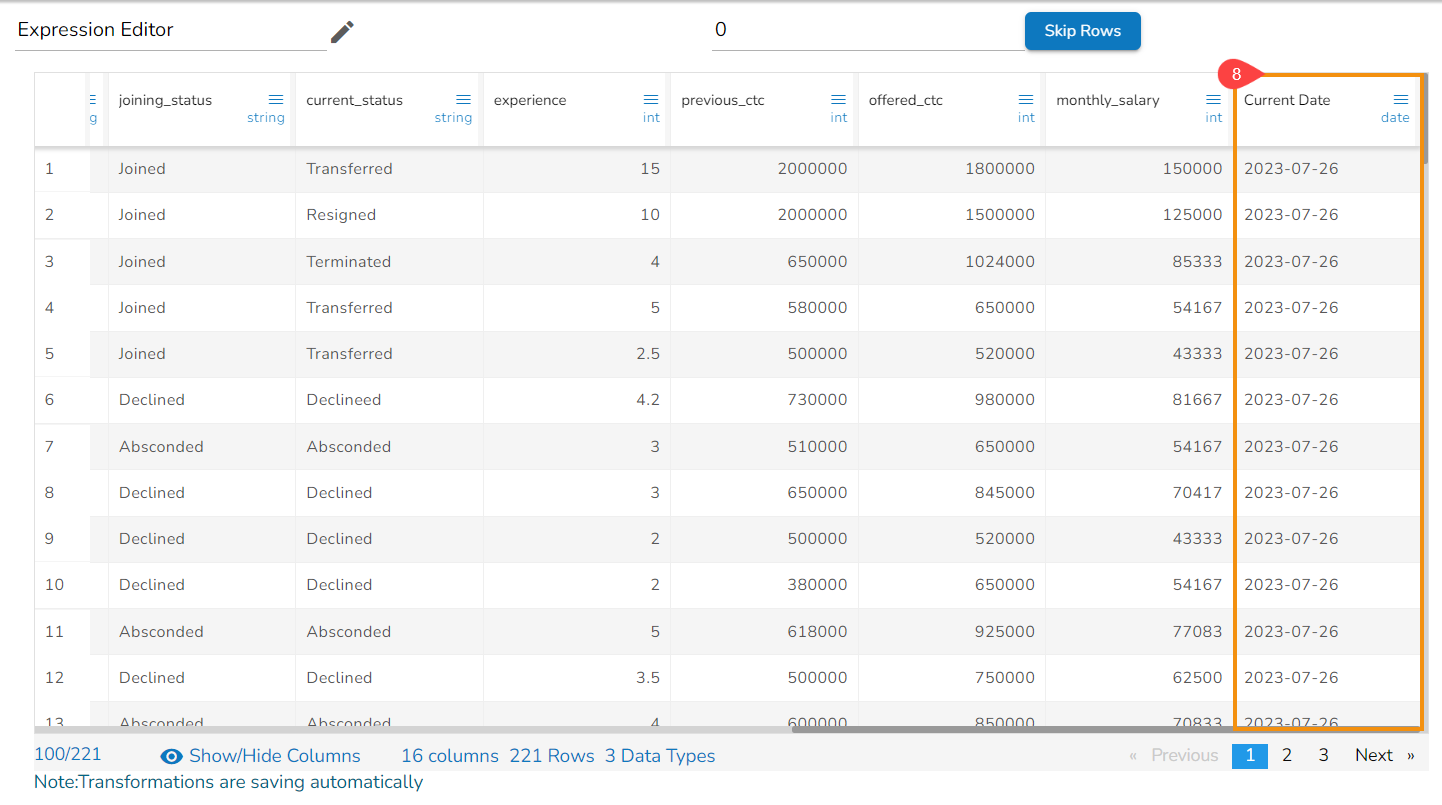
Create a new column with the created expression, and provide column name for the New Column. A new column has been created in the example given below:
Click the Submit option to either add a new column or update the selected column based on the executed formula/ expression.
The recently created or updated column with Formula gets added to the dataset.
Find Anomaly
Anomaly detection is used to identify any anomaly present in the data. i.e., Outlier. Instead of looking for usual points in the data, it looks for any anomaly. It uses the Isolation Forest algorithm.
The Find Anomaly transform takes four parameters:
Select a dataset within the Data Preparation framework.
Navigate to the Transforms tab.
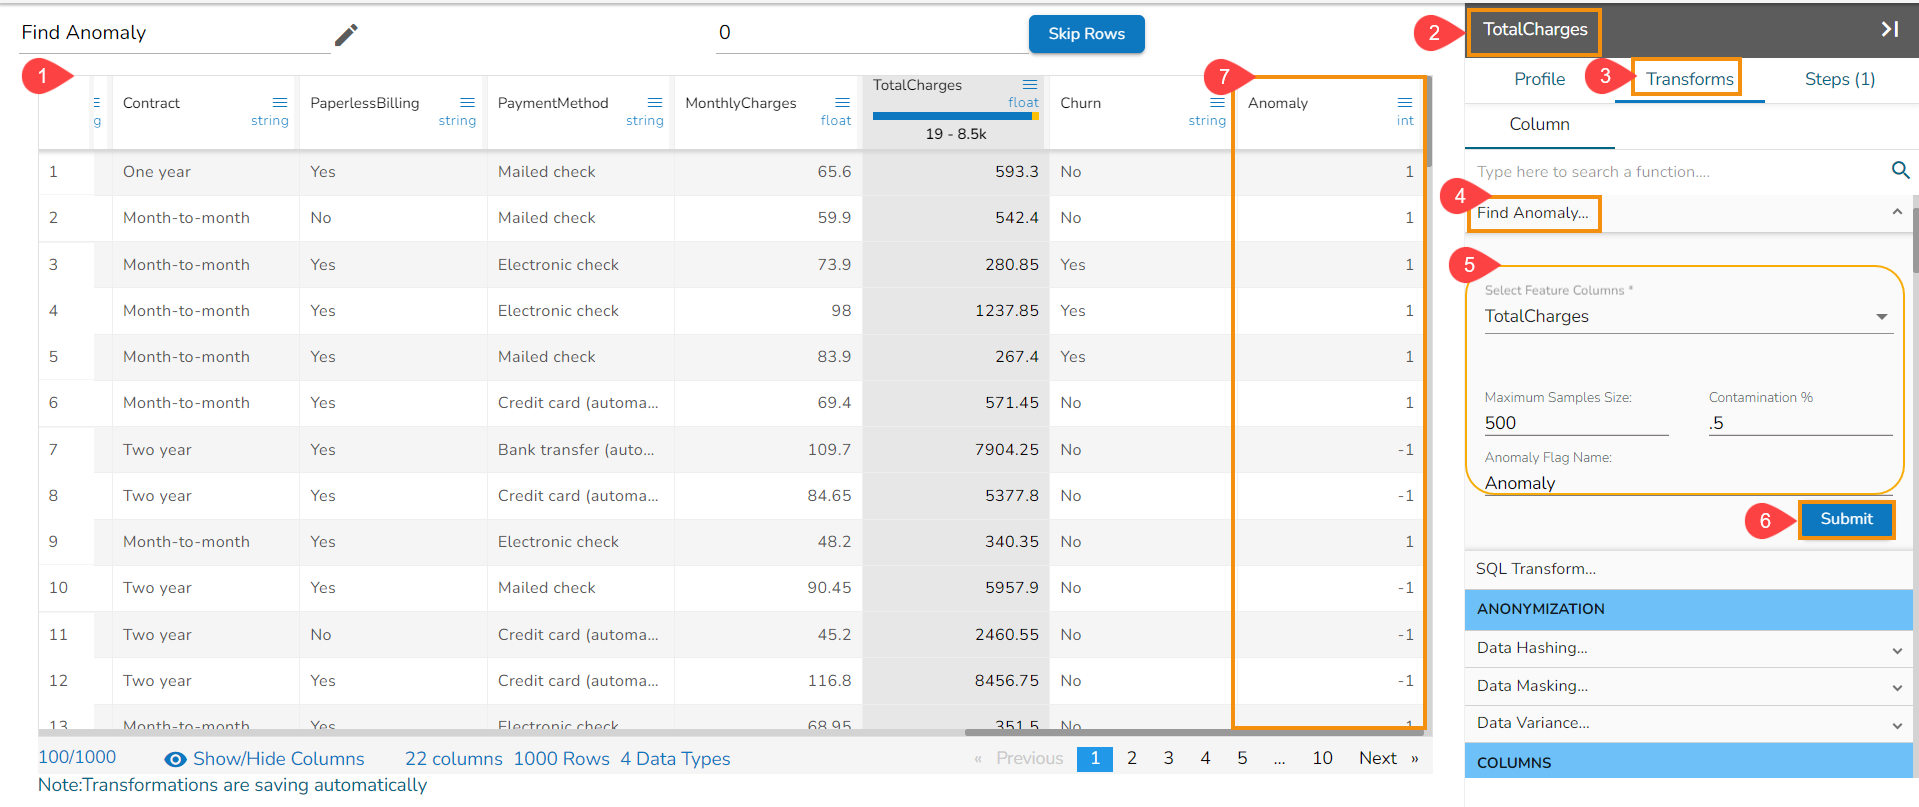
Select the Find Anomaly transform from the ADVANCED category.
Configure the following information:
Select Feature Columns: Select one or more columns where you want to find the anomaly.
Maximum Sample Size: The Isolation Forest algorithm takes the training data of a given sample size to find out the normal value in the dataset.
Contamination (%): It is the percentage of observations we believe to be outliers. It varies from 0 to 1 (both inclusive).
Anomaly Flag Name: The result is either -1 or 1. 1 means the data is standard, and -1 means data is an outlier. This information gets stored in the new column given in the anomaly flag name.
Click the Submit option after the required details are provided.
The anomaly gets flagged under the column that has been named using the Anomaly Flag Name option.
Please Note: The other needed parameters such as Estimators and seed values are considered based on their default values to run the Isolation Forest logic on the selected dataset sample.
SQL Transform
This transform helps to perform SQL queries.
Select a dataset within the Data Preparation framework.
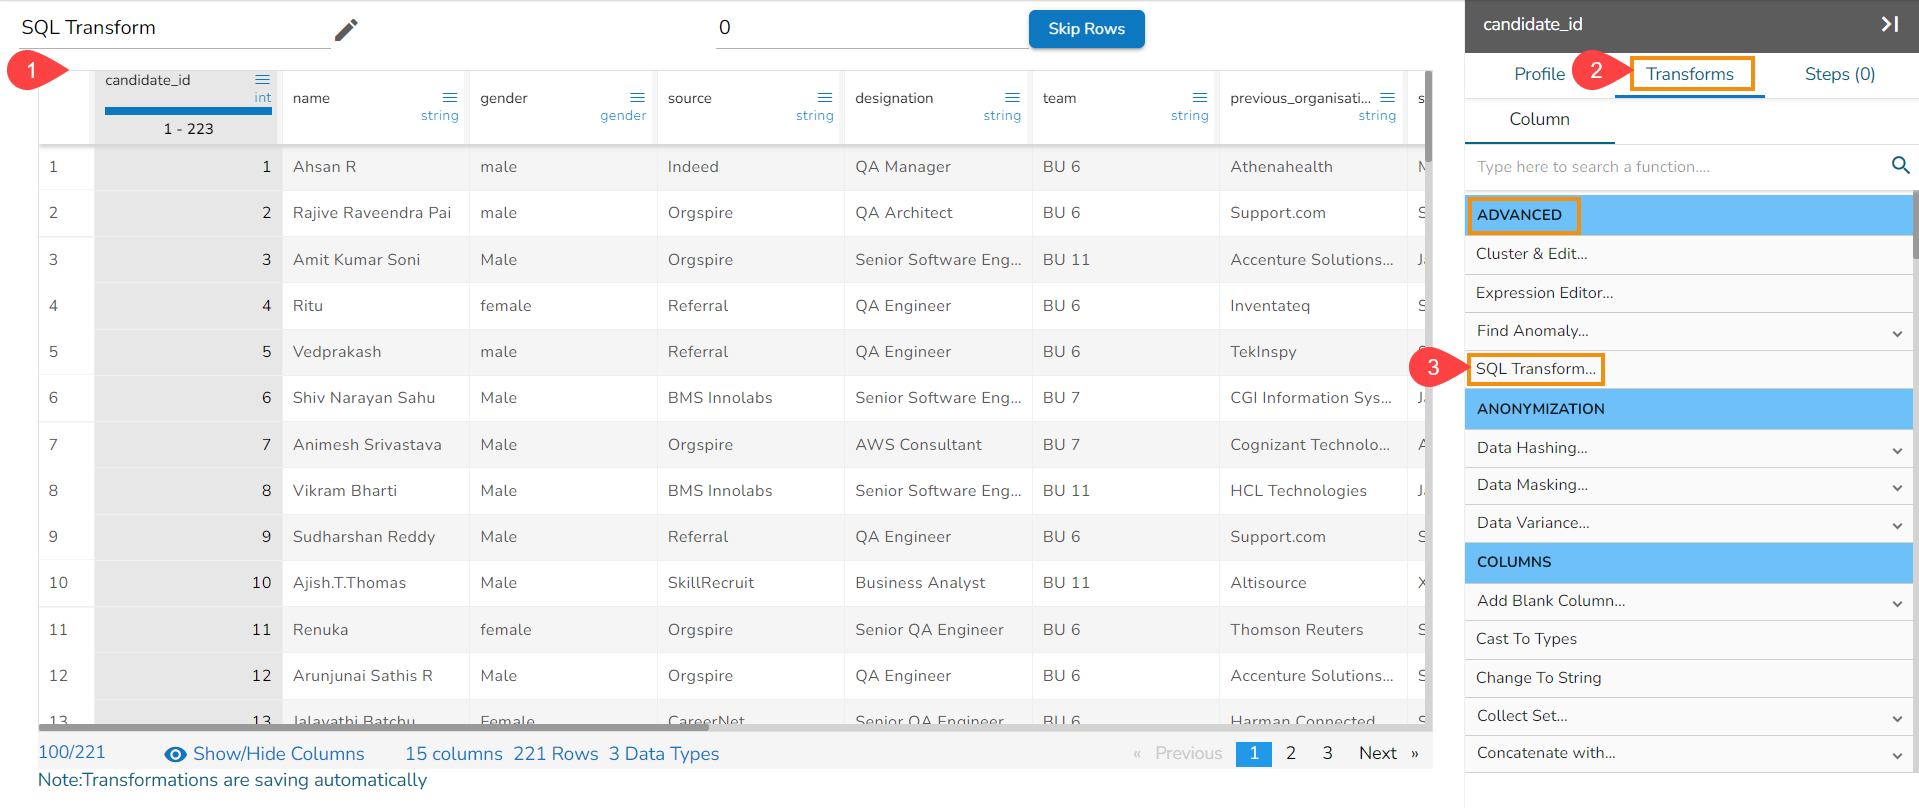
Navigate to the Transforms tab.
Open the SQL Transform from the Advanced transforms.
Please Note: Function syntax and small example comes under the text area by using double-clicks on the functions.
Click the Submit option to add a new column based on the query result.
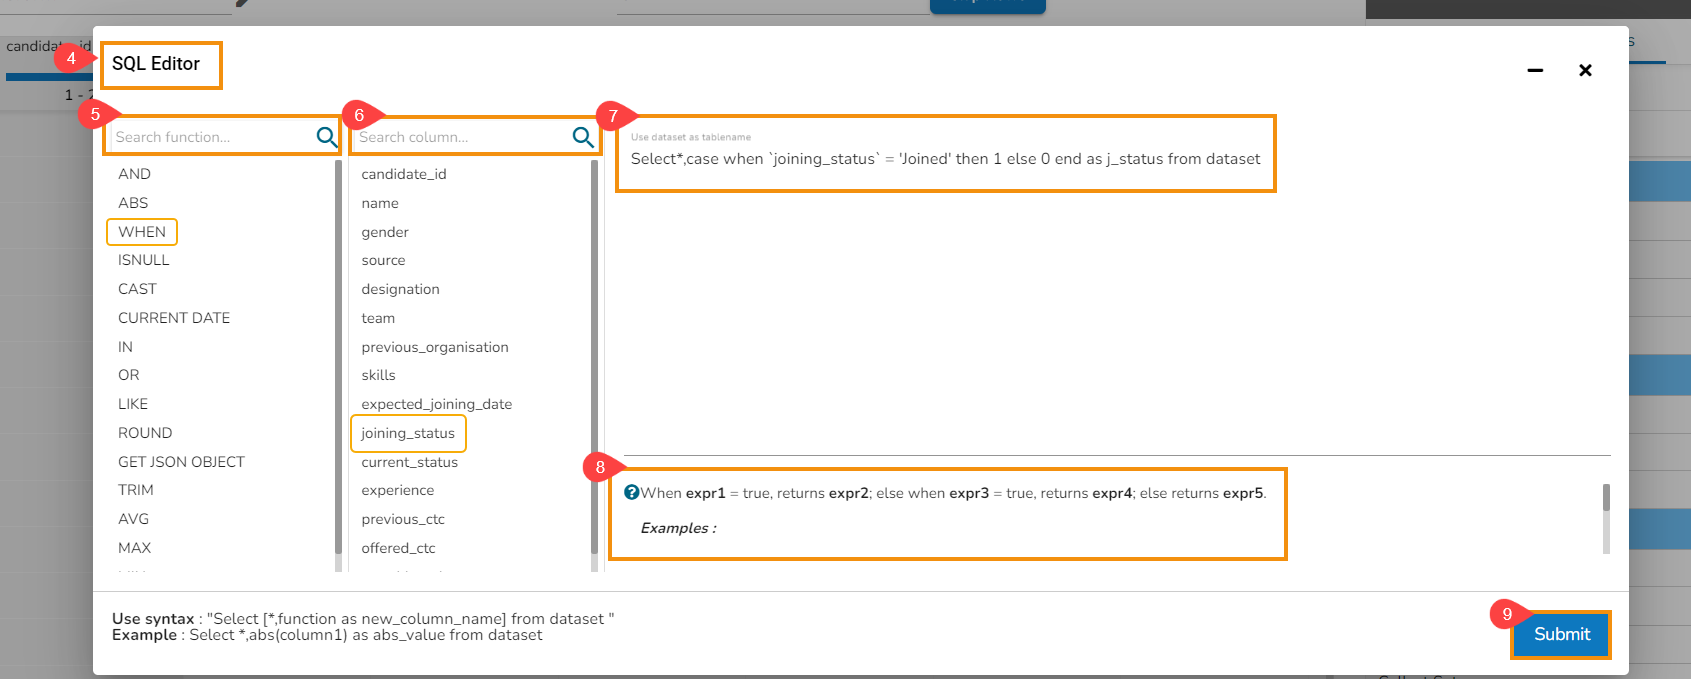
The SQL Editor page opens.
The First column contains SQL functions, the user can search for a function and add it to the given text space provided for writing query.
The Second column lists all the column names available in the dataset.
The Text area is provided for writing queries.
Based on the selected function an example will be displayed below the text space.
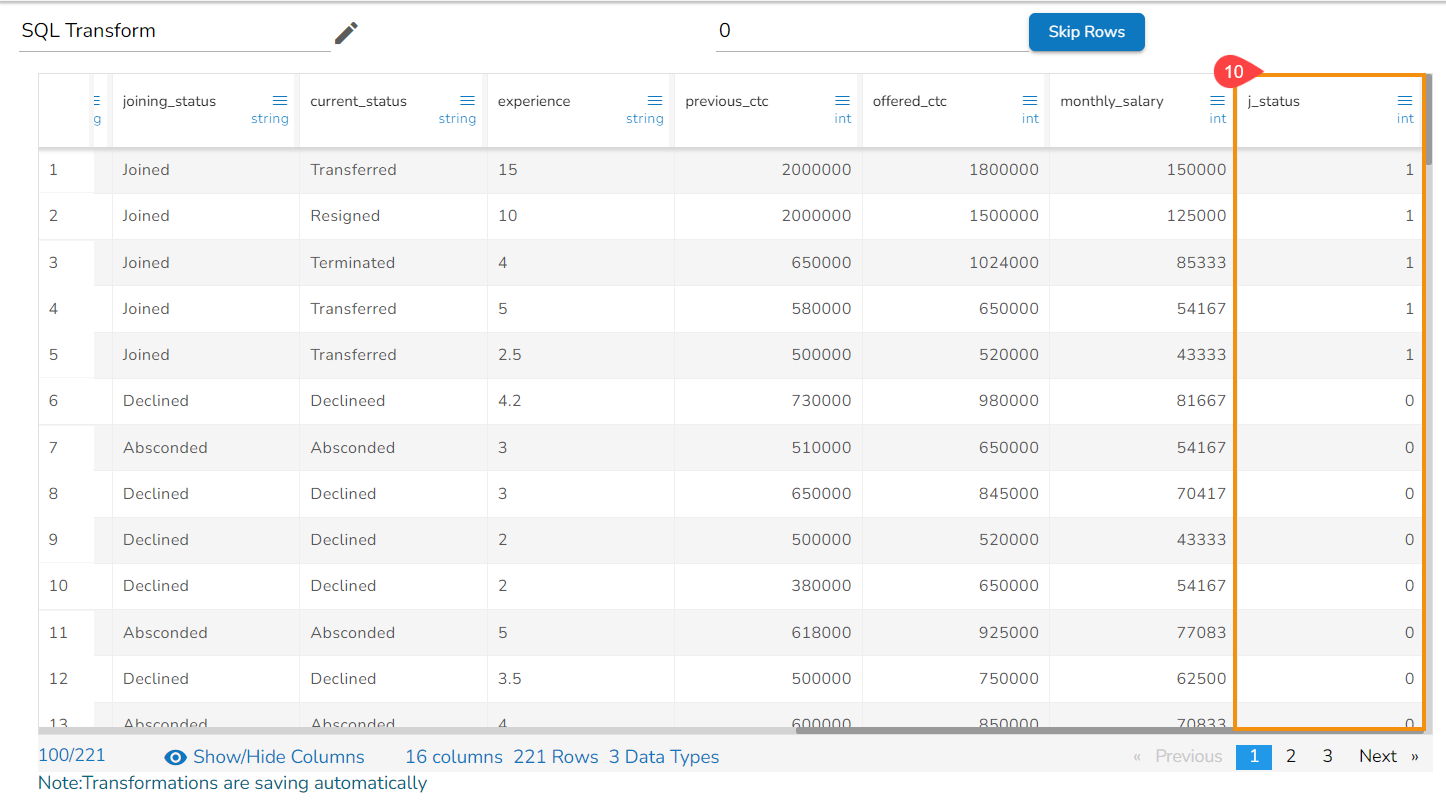
Click the Submit option.
A new column gets added to the dataset reflecting the condition provided through the SQL transform.
Please Note: The SQL Transform & Expression Editor support only Pandas SQL Queries.
Last updated